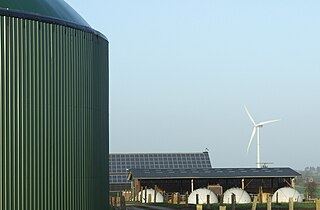
Renewable energy is energy from renewable natural resources that are replenished on a human timescale. Using renewable energy technologies helps with climate change mitigation, energy security, and also has some economic benefits. Commonly used renewable energy types include solar energy, wind power, hydropower, bioenergy and geothermal power. Renewable energy installations can be large or small. They are suited for urban as well as rural areas. Renewable energy is often deployed together with further electrification. This has several benefits: electricity can move heat and vehicles efficiently, and is clean at the point of consumption. Variable renewable energy sources are those that have a fluctuating nature, such as wind power and solar power. In contrast, controllable renewable energy sources include dammed hydroelectricity, bioenergy, or geothermal power.

Renewable energy progress in the European Union (EU) is driven by the European Commission's 2023 revision of the Renewable Energy Directive, which raises the EU's binding renewable energy target for 2030 to at least 42.5%, up from the previous target of 32%. Effective since November 20, 2023, across all EU countries, this directive aligns with broader climate objectives, including reducing greenhouse gas emissions by at least 55% by 2030 and achieving climate neutrality by 2050. Additionally, the Energy 2020 strategy exceeded its goals, with the EU achieving a 22.1% share of renewable energy in 2020, surpassing the 20% target.

Many countries and territories have installed significant solar power capacity into their electrical grids to supplement or provide an alternative to conventional energy sources. Solar power plants use one of two technologies:
Renewable energy in Germany is mainly based on wind and biomass, plus solar and hydro. Germany had the world's largest photovoltaic installed capacity until 2014, and as of 2023 it has over 82 GW. It is also the world's third country by installed total wind power capacity, 64 GW in 2021 and second for offshore wind, with over 7 GW. Germany has been called "the world's first major renewable energy economy".

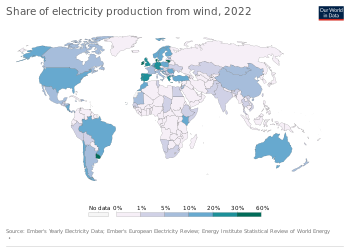
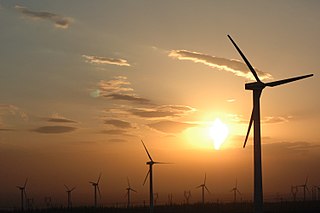
Wind power in Germany is a growing industry. The installed capacity was 55.6 gigawatts (GW) at the end of 2017, with 5.2 GW from offshore installations. In 2020, 23.3% of the country's total electricity was generated through wind power, up from 6.2% in 2010 and 1.6% in 2000.

Renewable energy commercialization involves the deployment of three generations of renewable energy technologies dating back more than 100 years. First-generation technologies, which are already mature and economically competitive, include biomass, hydroelectricity, geothermal power and heat. Second-generation technologies are market-ready and are being deployed at the present time; they include solar heating, photovoltaics, wind power, solar thermal power stations, and modern forms of bioenergy. Third-generation technologies require continued R&D efforts in order to make large contributions on a global scale and include advanced biomass gasification, hot-dry-rock geothermal power, and ocean energy. In 2019, nearly 75% of new installed electricity generation capacity used renewable energy and the International Energy Agency (IEA) has predicted that by 2025, renewable capacity will meet 35% of global power generation.

As of 2023, Europe had a total installed wind capacity of 255 gigawatts (GW). In 2017, a total of 15,680 MW of wind power was installed, representing 55% of all new power capacity, and the wind power generated 336 TWh of electricity, enough to supply 11.6% of the EU's electricity consumption.

Sweden has a total of 16.4 GW of wind power capacity at the end of 2023, the 5th highest in Europe and most per capita. Wind power produced 19.4% of national electricity generation in 2022, up from 0.3% in 2000.

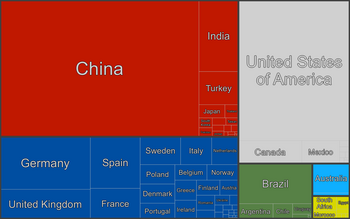
China is the world's leader in electricity production from renewable energy sources, with over triple the generation of the second-ranking country, the United States. China's renewable energy sector is growing faster than its fossil fuels and nuclear power capacity, and is expected to contribute 43% of global renewable capacity growth. China's total renewable energy capacity exceeded 1,000 GW in 2021, accounting for 43.5 per cent of the country's total power generation capacity, 10.2 percentage points higher than in 2015. The country aims to have 80 per cent of its total energy mix come from non-fossil fuel sources by 2060, and achieve a combined 1,200 GW of solar and wind capacity by 2030. In 2023, it was reported that China was on track to reach 1,371 gigawatts of wind and solar by 2025, five years ahead of target due to new renewables installations breaking records.
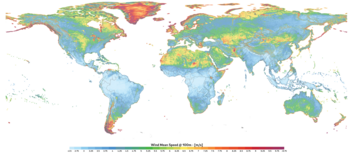
China is the world leader in wind power generation, with the largest installed capacity of any nation and continued rapid growth in new wind facilities. With its large land mass and long coastline, China has exceptional wind power resources: Wind power remained China's third-largest source of electricity at the end of 2021, accounting for 7.5% of total power generation.

Coal generated about 19.5% of the electricity at utility-scale facilities in the United States in 2022, down from 38.6% in 2014 and 51% in 2001. In 2021, coal supplied 9.5 quadrillion British thermal units (2,800 TWh) of primary energy to electric power plants, which made up 90% of coal's contribution to U.S. energy supply. Utilities buy more than 90% of the coal consumed in the United States. There were over 200 coal powered units across the United States in 2022. Coal plants have been closing since the 2010s due to cheaper and cleaner natural gas and renewables. Due to measures such as scrubbers air pollution from the plants kills far fewer people nowadays, but deaths in 2020 from PM 2.5 have been estimated at 1600. Environmentalists say that political action is needed to close them faster, to also reduce greenhouse gas emissions by the United States and better limit climate change.
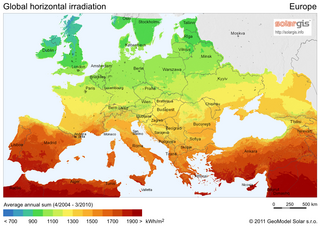
Solar power consists of photovoltaics (PV) and solar thermal energy in the European Union (EU).
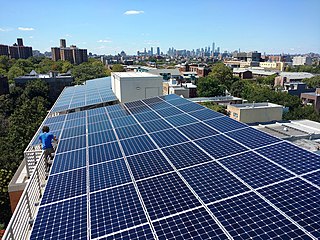
Solar power includes solar farms as well as local distributed generation, mostly on rooftops and increasingly from community solar arrays. In 2023, utility-scale solar power generated 164.5 terawatt-hours (TWh), or 3.9% of electricity in the United States. Total solar generation that year, including estimated small-scale photovoltaic generation, was 238 TWh.

The renewable-energy industry is the part of the energy industry focusing on new and appropriate renewable energy technologies. Investors worldwide have paid greater attention to this emerging industry in recent years. In many cases, this has translated into rapid renewable energy commercialization and considerable industry expansion. The wind power, solar power and hydroelectric power industries provide good examples of this.

China is the world's largest electricity producer, having overtaken the United States in 2011 after rapid growth since the early 1990s. In 2021, China produced 8.5 petawatt-hour (PWh) of electricity, approximately 30% of the world's electricity production.

Between 1992 and 2023, the worldwide usage of photovoltaics (PV) increased exponentially. During this period, it evolved from a niche market of small-scale applications to a mainstream electricity source. From 2016-2022 it has seen an annual capacity and production growth rate of around 26%- doubling approximately every three years.

The US state of Colorado has vast wind energy resources and the installed electricity capacity and generation from wind power in Colorado has been growing significantly in recent years. The growth has been sustained due to a combination of falling costs, continuing federal incentives, and the state's aggressive renewable portfolio standard that requires 30% of the state's electricity to come from renewable sources by 2020.

Renewables supply a quarter of energy in Turkey, including heat and electricity. Some houses have rooftop solar water heating, and hot water from underground warms many spas and greenhouses. In parts of the west hot rocks are shallow enough to generate electricity as well as heat. Wind turbines, also mainly near western cities and industry, generate a tenth of Turkey’s electricity. Hydropower, mostly from dams in the east, is the only modern renewable energy which is fully exploited. Hydropower averages about a fifth of the country's electricity, but much less in drought years. Apart from wind and hydro, other renewables; such as geothermal, solar and biogas; together generated almost a tenth of Turkey’s electricity in 2022. Türkiye has ranked 5th in Europe and 12th in the world in terms of installed capacity in renewable energy. The share of renewables in Türkiye’s installed power reached to 54% at the end of 2022.
Denmark is a leading country in renewable energy production and usage. Renewable energy sources collectively produced 81% of Denmark's electricity generation in 2022, and are expected to provide 100% of national electric power production from 2030. Including energy use in the heating/cooling and transport sectors, Denmark is expected to reach 100% renewable energy in 2050, up from the 34% recorded in 2021.

World energy supply and consumption refers to the global supply of energy resources and its consumption. The system of global energy supply consists of the energy development, refinement, and trade of energy. Energy supplies may exist in various forms such as raw resources or more processed and refined forms of energy. The raw energy resources include for example coal, unprocessed oil & gas, uranium. In comparison, the refined forms of energy include for example refined oil that becomes fuel and electricity. Energy resources may be used in various different ways, depending on the specific resource, and intended end use. Energy production and consumption play a significant role in the global economy. It is needed in industry and global transportation. The total energy supply chain, from production to final consumption, involves many activities that cause a loss of useful energy.