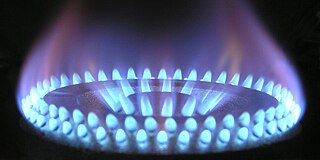
Natural gas is a naturally occurring mixture of gaseous hydrocarbons consisting primarily of methane (97%) in addition to various smaller amounts of other higher alkanes. Low levels of trace gases like carbon dioxide, nitrogen, hydrogen sulfide, and helium are also usually present. Methane is colorless and odorless, and the second largest greenhouse gas contributor to global climate change after carbon dioxide. Because natural gas is odorless, odorizers such as mercaptan are commonly added to it for safety so that leaks can be readily detected.

A fossil fuel is a hydrocarbon-containing material such as coal, oil, and natural gas, formed naturally in the Earth's crust from the remains of dead plants and animals that is extracted and burned as a fuel. Fossil fuels may be burned to provide heat for use directly, to power engines, or to generate electricity. Some fossil fuels are refined into derivatives such as kerosene, gasoline and propane before burning. The origin of fossil fuels is the anaerobic decomposition of buried dead organisms, containing organic molecules created by photosynthesis. The conversion from these materials to high-carbon fossil fuels typically require a geological process of millions of years.

Sasol Limited is an integrated energy and chemical company based in Sandton, South Africa. The company was formed in 1950 in Sasolburg, South Africa, and built on processes that German chemists and engineers first developed in the early 1900s. Today, Sasol develops and commercializes technologies, including synthetic fuel technologies, and produces different liquid fuels, chemicals, coal tar, and electricity.
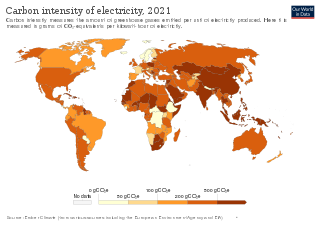
An emission intensity is the emission rate of a given pollutant relative to the intensity of a specific activity, or an industrial production process; for example grams of carbon dioxide released per megajoule of energy produced, or the ratio of greenhouse gas emissions produced to gross domestic product (GDP). Emission intensities are used to derive estimates of air pollutant or greenhouse gas emissions based on the amount of fuel combusted, the number of animals in animal husbandry, on industrial production levels, distances traveled or similar activity data. Emission intensities may also be used to compare the environmental impact of different fuels or activities. In some case the related terms emission factor and carbon intensity are used interchangeably. The jargon used can be different, for different fields/industrial sectors; normally the term "carbon" excludes other pollutants, such as particulate emissions. One commonly used figure is carbon intensity per kilowatt-hour (CIPK), which is used to compare emissions from different sources of electrical power.

Climate change mitigation is action to limit climate change. This action either reduces emissions of greenhouse gases or removes those gases from the atmosphere. The recent rise in global temperature is mostly due to emissions from burning fossil fuels such as coal, oil, and natural gas. There are various ways that mitigation can reduce emissions. These are transitioning to sustainable energy sources, conserving energy, and increasing efficiency. It is possible to remove carbon dioxide from the atmosphere. This can be done by enlarging forests, restoring wetlands and using other natural and technical processes. The name for these processes is carbon sequestration. Governments and companies have pledged to reduce emissions to prevent dangerous climate change. These pledges are in line with international negotiations to limit warming.
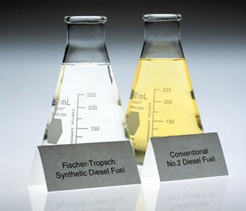
Synthetic fuel or synfuel is a liquid fuel, or sometimes gaseous fuel, obtained from syngas, a mixture of carbon monoxide and hydrogen, in which the syngas was derived from gasification of solid feedstocks such as coal or biomass or by reforming of natural gas.

A carbon footprint (or greenhouse gas footprint) is a calculated value or index that makes it possible to compare the total amount of greenhouse gases that an activity, product, company or country adds to the atmosphere. Carbon footprints are usually reported in tonnes of emissions (CO2-equivalent) per unit of comparison. Such units can be for example tonnes CO2-eq per year, per kilogram of protein for consumption, per kilometer travelled, per piece of clothing and so forth. A product's carbon footprint includes the emissions for the entire life cycle. These run from the production along the supply chain to its final consumption and disposal.
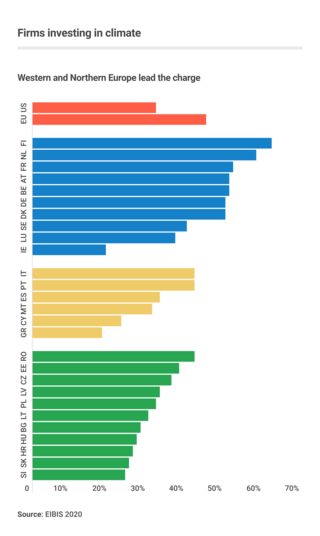
Business action on climate change includes a range of activities relating to climate change, and to influencing political decisions on climate change-related regulation, such as the Kyoto Protocol. Major multinationals have played and to some extent continue to play a significant role in the politics of climate change, especially in the United States, through lobbying of government and funding of climate change deniers. Business also plays a key role in the mitigation of climate change, through decisions to invest in researching and implementing new energy technologies and energy efficiency measures.

Carbon capture and storage (CCS) is a process in which a relatively pure stream of carbon dioxide (CO2) from industrial sources is separated, treated and transported to a long-term storage location. For example, the carbon dioxide stream that is to be captured can result from burning fossil fuels or biomass. Usually the CO2 is captured from large point sources, such as a chemical plant or biomass plant, and then stored in an underground geological formation. The aim is to reduce greenhouse gas emissions and thus mitigate climate change. The IPCC's most recent report on mitigating climate change describes CCS retrofits for existing power plants as one of the ways to limit emissions from the electricity sector and meet Paris Agreement goals.

Secunda CTL is a synthetic fuel plant owned by Sasol at Secunda, Mpumalanga in South Africa. It uses coal liquefaction to produce petroleum-like synthetic crude oil from coal. The process used by Sasol is based on the Fischer–Tropsch process. It is the largest coal liquefaction plant and the largest single emitter of greenhouse gas in the world.

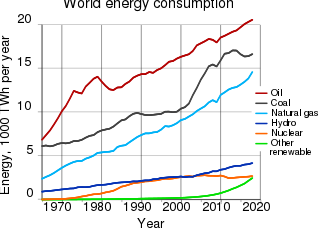
Greenhouse gas (GHG) emissions from human activities intensify the greenhouse effect. This contributes to climate change. Carbon dioxide, from burning fossil fuels such as coal, oil, and natural gas, is one of the most important factors in causing climate change. The largest emitters are China followed by the United States. The United States has higher emissions per capita. The main producers fueling the emissions globally are large oil and gas companies. Emissions from human activities have increased atmospheric carbon dioxide by about 50% over pre-industrial levels. The growing levels of emissions have varied, but have been consistent among all greenhouse gases. Emissions in the 2010s averaged 56 billion tons a year, higher than any decade before. Total cumulative emissions from 1870 to 2017 were 425±20 GtC from fossil fuels and industry, and 180±60 GtC from land use change. Land-use change, such as deforestation, caused about 31% of cumulative emissions over 1870–2017, coal 32%, oil 25%, and gas 10%.

The United States produced 5.2 billion metric tons of carbon dioxide equivalent greenhouse gas (GHG) emissions in 2020, the second largest in the world after greenhouse gas emissions by China and among the countries with the highest greenhouse gas emissions per person. In 2019 China is estimated to have emitted 27% of world GHG, followed by the United States with 11%, then India with 6.6%. In total the United States has emitted a quarter of world GHG, more than any other country. Annual emissions are over 15 tons per person and, amongst the top eight emitters, is the highest country by greenhouse gas emissions per person. However, the IEA estimates that the richest decile in the US emits over 55 tonnes of CO2 per capita each year. Because coal-fired power stations are gradually shutting down, in the 2010s emissions from electricity generation fell to second place behind transportation which is now the largest single source. In 2020, 27% of the GHG emissions of the United States were from transportation, 25% from electricity, 24% from industry, 13% from commercial and residential buildings and 11% from agriculture. In 2021, the electric power sector was the second largest source of U.S. greenhouse gas emissions, accounting for 25% of the U.S. total. These greenhouse gas emissions are contributing to climate change in the United States, as well as worldwide.
This article is intended to give an overview of the greenhouse gas emissions in the U.S. state of Kentucky.
The environmental impact of the energy industry is significant, as energy and natural resource consumption are closely related. Producing, transporting, or consuming energy all have an environmental impact. Energy has been harnessed by human beings for millennia. Initially it was with the use of fire for light, heat, cooking and for safety, and its use can be traced back at least 1.9 million years. In recent years there has been a trend towards the increased commercialization of various renewable energy sources. Scientific consensus on some of the main human activities that contribute to global warming are considered to be increasing concentrations of greenhouse gases, causing a warming effect, global changes to land surface, such as deforestation, for a warming effect, increasing concentrations of aerosols, mainly for a cooling effect.

As of 2011, South Africa produces in excess of 255 million tonnes of coal and consumes almost three-quarters of that domestically. As of 2018, South Africa was the seventh largest producer and consumer of coal in the world. The industry, as of 2015, employs about 80,000 workers, or .5% of total employment, down from a peak in 1981 of 135,000 workers. The coal industry is South Africa's largest contribution to the greenhouse gases that cause climate change.

In 2021, net greenhouse gas (GHG) emissions in the United Kingdom (UK) were 427 million tonnes (Mt) carbon dioxide equivalent, 80% of which was carbon dioxide itself. Emissions increased by 5% in 2021 with the easing of COVID-19 restrictions, primarily due to the extra road transport. The UK has over time emitted about 3% of the world total human caused CO2, with a current rate under 1%, although the population is less than 1%.

Climate change has resulted in an increase in temperature of 2.3 °C (2022) in Europe compared to pre-industrial levels. Europe is the fastest warming continent in the world. Europe's climate is getting warmer due to anthropogenic activity. According to international climate experts, global temperature rise should not exceed 2 °C to prevent the most dangerous consequences of climate change; without reduction in greenhouse gas emissions, this could happen before 2050. Climate change has implications for all regions of Europe, with the extent and nature of impacts varying across the continent.

Gas venting, more specifically known as natural-gas venting or methane venting, is the intentional and controlled release of gases containing alkane hydrocarbons - predominately methane - into Earth's atmosphere. It is a widely used method for disposal of unwanted gases which are produced during the extraction of coal and crude oil. Such gases may lack value when they are not recyclable into the production process, have no export route to consumer markets, or are surplus to near-term demand. In cases where the gases have value to the producer, substantial amounts may also be vented from the equipment used for gas collection, transport, and distribution.

Coal, cars and lorries vent more than a third of Turkey's six hundred million tonnes of annual greenhouse gas emissions, which are mostly carbon dioxide and part of the cause of climate change in Turkey. The nation's coal-fired power stations emit the most carbon dioxide, and other significant sources are road vehicles running on petrol or diesel. After coal and oil the third most polluting fuel is fossil gas; which is burnt in Turkey's gas-fired power stations, homes and workplaces. Much methane is belched by livestock; cows alone produce half of the greenhouse gas from agriculture in Turkey.

Greenhouse gas emissionsbyRussia are mostly from fossil gas, oil and coal. Russia emits 2 or 3 billion tonnes CO2eq of greenhouse gases each year; about 4% of world emissions. Annual carbon dioxide emissions alone are about 12 tons per person, more than double the world average. Cutting greenhouse gas emissions, and therefore air pollution in Russia, would have health benefits greater than the cost. The country is the world's biggest methane emitter, and 4 billion dollars worth of methane was estimated to leak in 2019/20.