
Crime in Canada is generally considered low overall. Under the Canadian constitution, the power to establish criminal law and rules of investigation is vested in the federal Parliament. The provinces share responsibility for law enforcement, and while the power to prosecute criminal offences is assigned to the federal government, responsibility for prosecutions is delegated to the provinces for most types of criminal offences. Laws and sentencing guidelines are uniform throughout the country, but provinces vary in their level of enforcement.

Dainik Bhaskar is a Hindi-language daily newspaper in India which is owned by the Dainik Bhaskar Group. According to the World Association of Newspapers, it ranked fourth in the world by circulation in 2016 and per the Indian Audit Bureau of Circulations was the eleventh largest newspaper in India by circulation as of 2022. Started in Bhopal in 1958, it expanded in 1983 with the launch of Dainik Bhaskar's Indore edition. The Dainik Bhaskar Group is present in 12 states with 65 editions in Hindi, Marathi, and Gujarati.
Crime has been recorded in the United States since its founding and has fluctuated significantly over time, with a sharp rise after 1900 and reaching a broad bulging peak between the 1970s and early 1990s. After 1992, crime rates have generally trended downwards each year, with the exceptions of a slight increase in property crimes in 2001 and increases in violent crimes in 2005-2006, 2014-2016 and 2020-2021. While official federal crime data beginning in 2021 has a wide margin of error due to the incomplete adoption of the National Incident-Based Reporting System by government agencies, federal data for 2020-2021 and limited data from select U.S. cities collected by the nonpartisan Council on Criminal Justice showed significantly elevated rates of homicide and motor vehicle theft in 2020-2022. Although overall crime rates have fallen far below the peak of crime seen in the United States during the late 1980s and early 1990s, the homicide rate in the U.S. has remained high, relative to other "high income"/developed nations, with eight major U.S. cities ranked among the 50 cities with the highest homicide rate in the world in 2022. The aggregate cost of crime in the United States is significant, with an estimated value of $4.9 trillion reported in 2021. Data from the first half of 2023, from government and private sector sources show that the murder rate has dropped, as much as 12% in as many as 90 cities across the United States. The drop in homicide rates is not uniform across the country however, with some cities such as Memphis, TN, showing an uptick in murder rates.
The Scheduled Castes and the Scheduled Tribes Act, 1989 was enacted by the Parliament of India to prevent atrocities and hate crimes against the scheduled castes and scheduled tribes. In popular usage, including in parliamentary debates and in the judgements of the Supreme Court of India, it is referred to as the SC/ST Act. It is also referred to as the 'Atrocities Act', POA, and PoA.
Crime in India has been recorded since the British Raj, with comprehensive statistics now compiled annually by the National Crime Records Bureau (NCRB), under the Ministry of Home Affairs (India).
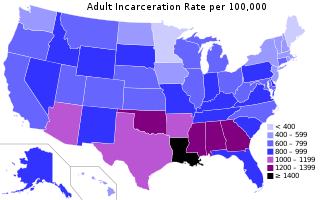
According to the World Prison Brief the United States in 2021 had the sixth highest incarceration rate in the world, at 531 people per 100,000. Between 2019 and 2020, the United States saw a significant drop in the total number of incarcerations. State and federal prison and local jail incarcerations dropped by 14% from 2.1 million in 2019 to 1.8 million in mid-2020. In 2018, the United States had the highest incarceration rate in the world.
Gender inequality in India refers to health, education, economic and political inequalities between men and women in India. Various international gender inequality indices rank India differently on each of these factors, as well as on a composite basis, and these indices are controversial.

The Directorate of Enforcement, or Enforcement Directorate (ED), is a domestic law enforcement agency and economic intelligence agency responsible for enforcing economic laws and fighting economic crimes in India. It is part of the Department of Revenue, Ministry of Finance, Government Of India. The Enforcement Directorate focuses on investigating and prosecuting cases related to money laundering, foreign exchange violations, corruption, and economic offenses. Its primary objective is to curb the generation and circulation of black money and to ensure compliance with the laws concerning foreign exchange and prevention of money laundering.
Suicide is a major national public health issue in the India. 1.71 lakh suicides were recorded in 2022, registering a 4.2% increase over 2021 and a jump of 27% compared to 2018. The rate of suicide per one lakh population has increased to 12.4 in 2022 which is the highest rate of deaths from suicides since 1967, which is the earliest recorded year for this data. Suicides during 2022 increased by 27% in comparison to 2018 with India reporting highest number of suicides in the world. India's contribution to global suicide deaths increased from 25.3% in 1990 to 36.6% in 2016 among women, and from 18.7% to 24.3% among men. In 2016, suicide was the most common cause of death in both the age groups of 15–29 years and 15–39 years. Daily wage earners accounted for 26% of suicide victims, the largest group in the suicide data.
The conviction rate, expressed as a percentage, represents the proportion of cases resulting in a legal declaration of guilt for an offense, against the total number of trials completed. It is calculated by dividing the number of convictions by the total number of adjudicated cases and then multiplying by 100. A conviction is a legal declaration that someone is guilty of committing an offense, determined through a jury's or bench's verdict within a court of law.

Child marriage in India, according to the Indian law, is a marriage where the woman and man both are younger than 21 years of age respectively. Most child marriages involve women, many of whom are poor socio-economic conditions.

Domestic violence in India includes any form of violence suffered by a person from a biological relative but typically is the violence suffered by a woman by male members of her family or relatives. Although Men also suffer Domestic violence, the law under IPC 498A specifically protects only women. Specifically only a woman can file a case of domestic violence. According to a National Family and Health Survey in 2005, total lifetime prevalence of domestic violence was 33.5% and 8.5% for sexual violence among women aged 15–49. A 2014 study in The Lancet reports that although the reported sexual violence rate in India is among the lowest in the world, the large population of India means that the violence affects 27.5 million women over their lifetimes. However, an opinion survey among experts carried out by the Thomson Reuters Foundation ranked India as the most dangerous country in the world for women.
Rape is the fourth most common crime against women in India. According to the 2021 annual report of the National Crime Records Bureau (NCRB), 31,677 rape cases were registered across the country, or an average of 86 cases daily, a rise from 2020 with 28,046 cases, while in 2019, 32,033 cases were registered. Of the total 31,677 rape cases, 28,147 of the rapes were committed by persons known to the victim. The share of victims who were minors or below 18 – the legal age of consent – stood at 10%.
Crime rates in Connecticut are lower than in the United States as a whole and have fallen significantly over the past decade, according to the 2021 Crime in Connecticut Report. This pattern holds true overall, and for most types of crime.
Prisons in India are overcrowded and eight of out ten prisoners in Indian jails await trial. There are 1319 prisons in India as of 2021. Currently, there are about 1400 prisons. After the COVID-19 pandemic, the number of prisoners increased 13% from 2020 to 2021, making over 80% of the prisons overcrowded. After the Supreme Court order, a number of prisoners were released in 2020 to decongest the jails, reducing the overall prison occupancy in 20 states and two Union Territories to a little over 93%. However, the occupancy rate increased to 130% again by 2021. About 63 unnatural deaths took place in Indian prisons. Among the major states, Tamil Nadu is the only state which has less than 100% occupancy followed by Karnataka.

Violence against women in India refers to physical or sexual violence committed against a woman, typically by a man. Common forms of violence against women in India include acts such as domestic abuse, sexual assault, and murder. There are several forms of violence against women, murder, female infanticide, sexual crimes, acid throwing, perpetuation.
This is a list of states and union territories of India ranked according to crime against women and rate of crime against women. The list is compiled from the 2016 and 2018 Crime in India Report published by National Crime Records Bureau (NCRB), Government of India.
The All India Institutes of Medical Sciences (AIIMS) is a group of autonomous government public medical universities of higher education under the jurisdiction of Ministry of Health and Family Welfare, Government of India. These institutes have been declared by an Act of Parliament as Institutes of National Importance. AIIMS New Delhi, the forerunner institute, was established in 1956. Since then, 24 more institutes were announced.
