
India is the third largest producer of electricity in the world. During the fiscal year (FY) 2022–23, the total electricity generation in the country was 1,844 TWh, of which 1,618 TWh was generated by utilities.

Many countries and territories have installed significant solar power capacity into their electrical grids to supplement or provide an alternative to conventional energy sources. Solar power plants use one of two technologies:

As of 2018, renewable energy accounted for 79% of the domestically produced electricity used in Brazil.

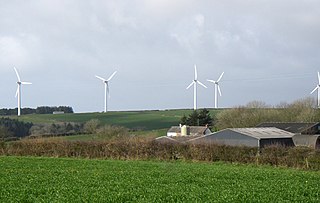
Wind power generation capacity in India has significantly increased in recent years. As of 31 August 2023, the total installed wind power capacity was 44.089 gigawatts (GW), the fourth largest installed wind power capacity in the world. Wind power capacity is mainly spread across the southern, western, and northwestern states.

Brazil is the 10th largest energy consumer in the world and the largest in South America. At the same time, it is an important oil and gas producer in the region and the world's second largest ethanol fuel producer. The government agencies responsible for energy policy are the Ministry of Mines and Energy (MME), the National Council for Energy Policy (CNPE), the National Agency of Petroleum, Natural Gas and Biofuels (ANP) and the National Agency of Electricity (ANEEL). State-owned companies Petrobras and Eletrobras are the major players in Brazil's energy sector, as well as Latin America's.

India's solar power installed capacity was 71.61 GWAC as of 31 August 2023.
For solar power, South Asia has the ideal combination of both high solar insolation and a high density of potential customers.
Renewable energy in the United Kingdom contributes to production for electricity, heat, and transport.
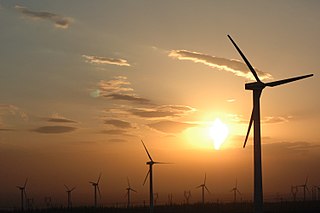
China is the world leader in wind power generation, with the largest installed capacity of any nation and continued rapid growth in new wind facilities. With its large land mass and long coastline, China has exceptional wind power resources: Wind power remained China's third-largest source of electricity at the end of 2021, accounting for 7.5% of total power generation.

China is the largest market in the world for both photovoltaics and solar thermal energy. China's photovoltaic industry began by making panels for satellites, and transitioned to the manufacture of domestic panels in the late 1990s. After substantial government incentives were introduced in 2011, China's solar power market grew dramatically: the country became the world's leading installer of photovoltaics in 2013. China surpassed Germany as the world's largest producer of photovoltaic energy in 2015, and became the first country to have over 100 GW of total installed photovoltaic capacity in 2017.

Wind power in Romania has total cumulative installed capacity of 3,028 MW as of the end of 2016, up from the 14 MW installed capacity in 2009.

India is world's 4th largest consumer of electricity and world's 3rd largest renewable energy producer with 40% of energy capacity installed in the year 2022 coming from renewable sources. Ernst & Young's (EY) 2021 Renewable Energy Country Attractiveness Index (RECAI) ranked India 3rd behind USA and China. In FY2023-24, India is planning to issue 50 GW tenders for wind, solar and hybrid projects. India has committed for a goal of 500 GW renewable energy capacity by 2030. In line with this commitment, India's installed renewable energy capacity has been experiencing a steady upward trend. From 94.4 GW in 2021, the capacity has gone up to 119.1 GW in 2023 as of Q4.

As of 2019, renewable energy in Morocco covered 35% of the country’s electricity needs.

Primary energy consumption in Spain in 2015 was mainly composed of fossil fuels. The largest sources are petroleum (42.3%), natural gas (19.8%) and coal (11.6%). The remaining 26.3% is accounted for by nuclear energy (12%) and different renewable energy sources (14.3%). Domestic production of primary energy includes nuclear (44,8%), solar, wind and geothermal (22,4%), biomass and waste (21,1%), hydropower (7,2%) and fossil (4,5%).

Solar power in Mexico has the potential to produce vast amounts of energy. 70% of the country has an insolation of greater than 4.5 kWh/m2/day. Using 15% efficient photovoltaics, a square 25 km (16 mi) on each side in the state of Chihuahua or the Sonoran Desert could supply all of Mexico's electricity.
Under its commitment to the EU renewable energy directive of 2009, France has a target of producing 23% of its total energy needs from renewable energy by 2020. This figure breaks down to renewable energy providing 33% of energy used in the heating and cooling sector, 27% of the electricity sector and 10.5% in the transport sector. By the end of 2014, 14.3% of France's total energy requirements came from renewable energy, a rise from 9.6% in 2005.

Renewable energy in Taiwan contributed to 8.7% of national electricity generation as of end of 2013. The total installed capacity of renewable energy in Taiwan by the end of 2013 was 3.76 GW. As of 2020, the Taiwan government aims for a renewable share of 20% by 2025, with coal and gas providing the other 80%.

Power sector of Andhra Pradesh is divided into 4 categories namely Regulation, Generation, Transmission and Distribution. Andhra Pradesh Electricity Regulatory Commission (APERC) is the regulatory body. APGENCO deals with the electricity production and also maintenance, proposes new projects and upgrades existing ones as well. The APGENCO also set up a Special Purpose Vehicle (SPV), named as Andhra Pradesh Power Development Company Limited (APPDCL), a joint venture company of APGENCO and IL&FS to set up Krishnapatanam thermal power project.

The Australian electricity sector has been historically dominated by coal-fired power stations, but renewables are forming a rapidly growing fraction of supply.

In Ukraine, the share of renewables within the total energy mix is less than 5%. In 2020 10% of electricity was generated from renewables; made up of 5% hydro, 4% wind, and 1% solar. Biomass provides renewable heat.
