Membership statistics of the Church of Jesus Christ of Latter-day Saints (United States)

Last updated
Flag of the United States.svg
The Church of Jesus Christ of Latter-day Saints in the United States
Salt Lake Temple - panoramio.jpg
Members 6,868,793 (2023) [1]
Stakes 1,693
Districts 6
Wards 12,792
Branches 1,801
Total Congregations [2] 14,593
Missions 110
Temples 83 Operating
25 Under Construction
22 Announced
130 Total
Family History Centers 1,864 [3]
Recent Membership History
YearMembers
20126,321,416 (2.02% of US total)
2013 6,398,889 (2.03% of US total)
2014 6,466,267 (2.03% of US total)
2015 6,531,656 (2.04% of US total)
2016 6,592,195 (2.04% of US total)
2017 6,641,886 (2.01% of US total)
2018 6,681,829 (2.01% of US total)
2019 6,721,032 (2.02% of US total)
*2020 6,742,000 (2.00% of US total)
2021 6,763,019 (2.01% of US total)
2022 6,804,028 (2.01% of US total)
Source: https://newsroom.churchofjesuschrist.org/facts-and-statistics/country/united-states (*2020 is an estimate since official numbers weren't released.)

This page shows the membership statistics of the Church of Jesus Christ of Latter-day Saints (LDS Church) within the United States.

Contents

Membership defined

Membership reported by the Church of Jesus Christ of Latter-day Saints on December 31, 2022, was used to determine the number of members in each state. [1] The church defines membership as: [4]

The United States Census Bureau 2022 population estimates was used as the basis for the general population. [5] Each state link gives a brief history and additional membership information for that state.

LDS membership as percentage of population by US states (2021) LDS membership as percentage of population by US states (2021).svg
LDS membership as percentage of population by US states (2021)
LDS membership in absolute numbers, by US states (2021) LDS membership by US states (2021).svg
LDS membership in absolute numbers, by US states (2021)

Table

Congregational

State Area Temples Mis­sions Stakes Dis­tricts Con­gre­ga­tions FHC
OUAT Wards Bran­ches Total
Flag of Alabama.svg Alabama NA Southeast 100118047287544
Flag of Alaska.svg Alaska NA West 101219060228215
Flag of Arizona.svg Arizona NA Southwest 6017611708358992474
Flag of Arkansas.svg Arkansas NA Southeast 010127051237425
Flag of California.svg California NA West 723121514709771351,112228
Flag of Colorado.svg Colorado NA Central 211443502773331064
Flag of Connecticut.svg Connecticut NA Northeast 10010302863410
Flag of Delaware.svg Delaware NA Northeast 0000020102123
Flag of the District of Columbia.svg District of Columbia NA Northeast 00000004041
Flag of Florida.svg Florida NA Southeast 212543402245027484
Flag of Georgia (U.S. state).svg Georgia NA Southeast 100121901342816244
Flag of Hawaii.svg Hawaii NA West 200221601271614326
Flag of Idaho.svg Idaho NA Central 6129313701,179491,22870
Flag of Illinois.svg Illinois NA Central 20021120912611742
Flag of Indiana.svg Indiana NA Northeast 10011120782310140
Flag of Iowa.svg Iowa NA Central 001118044246830
Flag of Kansas.svg Kansas NA Central 001117059157429
Flag of Kentucky.svg Kentucky NA Southeast 100118051328328
Flag of Louisiana.svg Louisiana NA Southeast 100117033185115
Flag of Maine.svg Maine NA Northeast 00000201882610
Flag of Maryland.svg Maryland NA Northeast 1001210065178214
Flag of Massachusetts.svg Massachusetts NA Northeast 100117042155718
Flag of Michigan.svg Michigan NA Northeast 101229162379943
Flag of Minnesota.svg Minnesota NA Central 100118054217529
Flag of Mississippi.svg Mississippi NA Southeast 000004030194920
Flag of Missouri.svg Missouri NA Central 201321801382616451
Flag of Montana.svg Montana NA Central 21141130904313350
Flag of Nebraska.svg Nebraska NA Central 100115042155718
Flag of Nevada.svg Nevada NA Southwest 211434303063734334
Flag of New Hampshire.svg New Hampshire NA Northeast 0000130144186
Flag of New Jersey.svg New Jersey NA Northeast 000016041216220
Flag of New Mexico.svg New Mexico NA Southwest 110221401043313731
Flag of New York.svg New York NA Northeast 20022171964914565
Flag of North Carolina.svg North Carolina NA Southeast 101221901394418351
Flag of North Dakota.svg North Dakota NA Central 1001130206267
Flag of Ohio.svg Ohio NA Northeast 102321501012612746
Flag of Oklahoma.svg Oklahoma NA Southwest 100119075209530
Flag of Oregon.svg Oregon NA West 210333502434829176
Flag of Pennsylvania.svg Pennsylvania NA Northeast 11132130802710746
Flag of Rhode Island.svg Rhode Island NA Northeast 00000108191
Flag of South Carolina.svg South Carolina NA Southeast 100119066178323
Flag of South Dakota.svg South Dakota NA Central 000002014173113
Flag of Tennessee.svg Tennessee NA Southeast 20132120863111735
Flag of Texas.svg Texas NA Southwest 413810792622129751138
Flag of Utah.svg Utah Utah 18110291062925,1023155,417170
Flag of Vermont.svg Vermont NA Northeast 000001084128
Flag of Virginia.svg Virginia NA Northeast 101222201733721046
Flag of Washington (state).svg Washington NA West 402676004285448297
Flag of West Virginia.svg West Virginia NA Northeast 000014025123714
Flag of Wisconsin.svg Wisconsin NA Central 000016048216929
Flag of Wyoming.svg Wyoming NA Central 111301901432917246

Members and growth

StateAreaMembersPopulation%LDS20122022ChangeGrowth (%)% of Total Growth Pew ARDA
Flag of Alabama.svg Alabama NA Southeast 39,8325,074,2960.78%35,70839,8324,12411.55%0.59%1%10th
Flag of Alaska.svg Alaska NA West 33,574733,5834.58%33,03333,5745411.64%0.08%5%2nd
Flag of Arizona.svg Arizona NA Southwest 439,4117,359,1975.97%414,261439,41125,1506.07%3.58%5%2nd
Flag of Arkansas.svg Arkansas NA Southeast 35,4053,045,6371.16%28,66735,4056,73823.5%0.96%1%9th
Flag of California.svg California NA West 728,99539,029,3421.87%777,061728,995−48,066-6.19%-6.83%1%2nd
Flag of Colorado.svg Colorado NA Central 148,7085,839,9262.55%147,707148,7081,0010.68%0.14%2%2nd
Flag of Connecticut.svg Connecticut NA Northeast 15,8383,626,2050.44%15,27315,8385653.7%0.08%1%10th
Flag of Delaware.svg Delaware NA Northeast 5,6131,018,3960.55%5,0805,61353310.49%0.08%<1%11th
Flag of the District of Columbia.svg District of Columbia NA Northeast 3,168671,8030.47%2,4853,16868327.48%0.1%1%39th
Flag of Florida.svg Florida NA Southeast 168,52722,244,8230.76%143,057168,52725,47017.8%3.62%1%8th
Flag of Georgia (U.S. state).svg Georgia NA Southeast 89,28510,912,8760.82%80,54889,2858,73710.85%1.24%1%8th
Flag of Hawaii.svg Hawaii NA West 74,9521,440,1965.2%72,45974,9522,4933.44%0.35%3%2nd
Flag of Idaho.svg Idaho NA Central 473,8941,939,03324.44%422,345473,89451,54912.21%7.33%19%1st
Flag of Illinois.svg Illinois NA Central 57,01512,582,0320.45%56,53157,0154840.86%0.07%<1%13th
Flag of Indiana.svg Indiana NA Northeast 46,8236,833,0370.69%42,14746,8234,67611.09%0.66%1%13th
Flag of Iowa.svg Iowa NA Central 28,6973,200,5170.9%26,00128,6972,69610.37%0.38%<1%13th
Flag of Kansas.svg Kansas NA Central 39,3562,937,1501.34%35,62739,3563,72910.47%0.53%1%10th
Flag of Kentucky.svg Kentucky NA Southeast 37,8304,512,3100.84%33,45537,8304,37513.08%0.62%<1%8th
Flag of Louisiana.svg Louisiana NA Southeast 29,7274,590,2410.65%29,36629,7273611.23%0.05%<1%6th
Flag of Maine.svg Maine NA Northeast 11,0541,385,3400.8%10,77811,0542762.56%0.04%2%6th
Flag of Maryland.svg Maryland NA Northeast 43,2966,164,6600.7%43,22743,296690.16%0.01%1%8th
Flag of Massachusetts.svg Massachusetts NA Northeast 28,1976,981,9740.4%25,99628,1972,2018.47%0.31%1%11th
Flag of Michigan.svg Michigan NA Northeast 45,54710,034,1130.45%43,17845,5472,3695.49%0.34%<1%13th
Flag of Minnesota.svg Minnesota NA Central 33,3655,717,1840.58%31,29833,3652,0676.6%0.29%1%12th
Flag of Mississippi.svg Mississippi NA Southeast 22,1892,940,0570.75%21,70422,1894852.23%0.07%1%10th
Flag of Missouri.svg Missouri NA Central 77,9596,177,9571.26%67,94377,95910,01614.74%1.42%1%8th
Flag of Montana.svg Montana NA Central 51,7151,122,8674.61%47,85451,7153,8618.07%0.55%4%2nd
Flag of Nebraska.svg Nebraska NA Central 25,2291,967,9231.28%23,68825,2291,5416.51%0.22%1%6th
Flag of Nevada.svg Nevada NA Southwest 181,9753,177,7725.73%178,737181,9753,2381.81%0.46%4%2nd
Flag of New Hampshire.svg New Hampshire NA Northeast 8,9961,395,2310.64%8,3358,9966617.93%0.09%1%6th
Flag of New Jersey.svg New Jersey NA Northeast 34,5369,261,6990.37%32,74434,5361,7925.47%0.25%<1%15th
Flag of New Mexico.svg New Mexico NA Southwest 69,0552,113,3443.27%69,36569,055−310-0.45%-0.04%1%3rd
Flag of New York.svg New York NA Northeast 84,85719,677,1510.43%79,93384,8574,9246.16%0.7%<1%13th
Flag of North Carolina.svg North Carolina NA Southeast 94,01810,698,9730.88%79,83594,01814,18317.77%2.02%1%8th
Flag of North Dakota.svg North Dakota NA Central 11,487779,2611.47%9,12211,4872,36525.93%0.34%<1%7th
Flag of Ohio.svg Ohio NA Northeast 63,81411,756,0580.54%59,66263,8144,1526.96%0.59%1%14th
Flag of Oklahoma.svg Oklahoma NA Southwest 51,8474,019,8001.29%45,00851,8476,83915.2%0.97%1%8th
Flag of Oregon.svg Oregon NA West 150,2074,240,1373.54%150,630150,207−423-0.28%-0.06%3%2nd
Flag of Pennsylvania.svg Pennsylvania NA Northeast 52,19312,972,0080.4%51,17152,1931,0222%0.15%<1%13th
Flag of Rhode Island.svg Rhode Island NA Northeast 4,3511,093,7340.4%4,0544,3512977.33%0.04%<1%8th
Flag of South Carolina.svg South Carolina NA Southeast 44,2305,282,6340.84%38,67644,2305,55414.36%0.79%<1%11th
Flag of South Dakota.svg South Dakota NA Central 11,494909,8241.26%10,38511,4941,10910.68%0.16%<1%8th
Flag of Tennessee.svg Tennessee NA Southeast 57,4227,051,3390.81%47,34357,42210,07921.29%1.43%1%10th
Flag of Texas.svg Texas NA Southwest 378,28130,029,5721.26%315,895378,28162,38619.75%8.87%1%6th
Flag of Utah.svg Utah Utah 2,173,5603,380,80064.29%1,951,9372,173,560221,62311.35%31.51%55%1st
Flag of Vermont.svg Vermont NA Northeast 4,631647,0640.72%4,5964,631350.76%0%<1%7th
Flag of Virginia.svg Virginia NA Northeast 97,4498,683,6191.12%92,40797,4495,0425.46%0.72%2%7th
Flag of Washington (state).svg Washington NA West 281,3897,785,7863.61%276,837281,3894,5521.64%0.65%3%2nd
Flag of West Virginia.svg West Virginia NA Northeast 17,2941,775,1560.97%17,06017,2942341.37%0.03%2%9th
Flag of Wisconsin.svg Wisconsin NA Central 27,9435,892,5390.47%25,68627,9432,2578.79%0.32%<1%10th
Flag of Wyoming.svg Wyoming NA Central 67,797581,38111.66%65,48567,7972,3123.53%0.33%9%1st

Territories

Country Area Temples Mis­sions Dis­tricts Stakes Con­gre­ga­tions FHC
OUAT Wards Bran­ches Total
Flag of American Samoa.svg American Samoa Pacific 0101005385435
Flag of Guam.svg Guam Asia North 10011014152
Flag of Northern Mariana Islands.svg Northern Mariana Islands Pacific 00000001011
Flag of Puerto Rico.svg Puerto Rico Caribbean 01011152711388
Flag of United States Virgin Islands.svg United States Virgin Islands Caribbean 00000000220
Totals1203211170198915
CountryAreaMembersPopulation%LDS20122022ChangeGrowth (%)% of Total Growth
Flag of American Samoa.svg American Samoa Pacific 16,43649,71033.06%15,41116,4361,0256.65%0.05%
Flag of Guam.svg Guam Asia North 2,547153,8361.66%2,2522,54729513.1%0.01%
Flag of the Northern Mariana Islands.svg Northern Mariana Islands Pacific 90647,3291.91%75390615320.32%0.01%
Flag of Puerto Rico.svg Puerto Rico Caribbean 23,2433,221,7890.72%20,94023,2432,30311%0.1%
Flag of United States Virgin Islands.svg United States Virgin Islands Caribbean 61687,1460.71%570616468.07%0%
Totals43,7483,559,8101.23%39,92643,7483,8229.57%0.17%

From religious surveys

2001 American Religious Identification Survey

Percentage of US adult population by state claiming membership in the LDS church in the 2001 ARIS survey. Click image for map legend. US LDS percent 2001.svg
Percentage of US adult population by state claiming membership in the LDS church in the 2001 ARIS survey. Click image for map legend.

The 2001 American Religious Identification Survey (ARIS) was based on a random digit-dialed telephone survey of 50,281 American adults in the continental U.S.

2007 Pew Forum on Religion & Public Life

Percentage of US adult population, by state, claiming Mormon as religious preference in the 2007 survey by the Pew Forum on Religion & Public Life. 2007 PEW Survey (Percent Mormon).PNG
Percentage of US adult population, by state, claiming Mormon as religious preference in the 2007 survey by the Pew Forum on Religion & Public Life.

The Pew Forum on Religion & Public Life published a survey of 35,556 adults living in the United States that was conducted in 2007. [6] The 2007 survey, conducted by Princeton Survey Research Associates International (PSRAI), found 1.7% of the U.S. adult population self identified themselves as Mormon. [7] The table below lists a few significant findings, from the survey, about Mormons. Note: some less populated states were combined in this survey. These include: Montana-Wyoming, D.C.-Maryland, North & South Dakota, New Hampshire-Vermont, and Connecticut-Rhode Island. The racial and ethnic composition of the U.S. membership is predominantly white [8] with a lower percentage of blacks when compared to the U.S. average. [9]

DemographicMormons (U.S.)U.S. Avg.
Married71 %54 %
Divorced or separated9 %12 %
3 or more children at home21 %9 %
Weekly (or more) Attendance at Religious Services76 %39 %
Race, EthnicityMormons (U.S.)U.S. Avg.
White, non-Hisp.86 %71 %
Black, non-Hisp.3 %11 %
Other non-Hisp.5 %6 %
Hispanic7 %12 %

See also

Related Research Articles

The self-reported membership of the Church of Jesus Christ of Latter-day Saints as of December 31, 2023, was 17,255,394.

<span class="mw-page-title-main">The Church of Jesus Christ of Latter-day Saints in Mississippi</span>

The Church of Jesus Christ of Latter-day Saints in Mississippi refers to the Church of Jesus Christ of Latter-day Saints and its members in Mississippi. The first small branch was established in 1842. It has since grown to 22,189 members in 49 congregations.

<span class="mw-page-title-main">The Church of Jesus Christ of Latter-day Saints in Colorado</span>

The Church of Jesus Christ of Latter-day Saints in Colorado refers to the Church of Jesus Christ of Latter-day Saints and its members in Colorado. The first congregation of the Church in Colorado was organized in 1897. It has since grown to 148,708 members in 310 congregations.

<span class="mw-page-title-main">The Church of Jesus Christ of Latter-day Saints in New Mexico</span>

The Church of Jesus Christ of Latter-day Saints in New Mexico refers to the Church of Jesus Christ of Latter-day Saints and its members in New Mexico. The first congregation of the Church in New Mexico was organized in 1895. It has since grown to 69,055 members in 137 congregations.

<span class="mw-page-title-main">The Church of Jesus Christ of Latter-day Saints in Wyoming</span>

The Church of Jesus Christ of Latter-day Saints in Wyoming refers to the Church of Jesus Christ of Latter-day Saints and its members in Wyoming. The church's first congregation in Wyoming was organized in 1877. It has since grown to 67,797 members in 172 congregations.

<span class="mw-page-title-main">The Church of Jesus Christ of Latter-day Saints in Missouri</span>

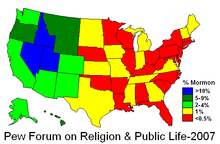
The Church of Jesus Christ of Latter-day Saints in Missouri refers to the Church of Jesus Christ of Latter-day Saints and its members in Missouri. The official church membership as a percentage of general population was 1.14% in 2014. According to the 2014 Pew Forum on Religion & Public Life survey, roughly 1% of Missourians self-identify themselves most closely with The Church of Jesus Christ of Latter-day Saints. The LDS Church is the 8th largest denomination in Missouri.

<span class="mw-page-title-main">The Church of Jesus Christ of Latter-day Saints in Illinois</span>

The Church of Jesus Christ of Latter-day Saints in Illinois refers to the Church of Jesus Christ of Latter-day Saints and its members in Illinois. The official church membership as a percentage of general population was 0.44% in 2014. According to the 2014 Pew Forum on Religion & Public Life survey, less than 1% of Illinoisans self-identify themselves most closely with The Church of Jesus Christ of Latter-day Saints. The LDS Church is the 13th largest denomination in Illinois.

<span class="mw-page-title-main">The Church of Jesus Christ of Latter-day Saints in Ohio</span>

The Church of Jesus Christ of Latter-day Saints in Ohio refers to the Church of Jesus Christ of Latter-day Saints and its members in Ohio. The official church membership as a percentage of general population was 0.52% in 2014. According to the 2014 Pew Forum on Religion & Public Life survey, roughly 1% of Ohioans self-identify themselves most closely with The Church of Jesus Christ of Latter-day Saints. The LDS Church is the 14th largest denomination in Ohio.

<span class="mw-page-title-main">The Church of Jesus Christ of Latter-day Saints in Pennsylvania</span>

The Church of Jesus Christ of Latter-day Saints in Pennsylvania refers to the Church of Jesus Christ of Latter-day Saints and its members in Pennsylvania. Joseph and Emma Smith lived in Northern Pennsylvania near the Susquehanna River just prior to the organization of the Church of Christ. Much of the translation of the Book of Mormon and revelation of the priesthood occurred here during that time.

<span class="mw-page-title-main">The Church of Jesus Christ of Latter-day Saints in Kentucky</span>

The Church of Jesus Christ of Latter-day Saints in Kentucky refers to the Church of Jesus Christ of Latter-day Saints and its members in Kentucky. The first small branch was established in 1834. In 2022, the church claimed 37,830 members in 83 congregations.

<span class="mw-page-title-main">The Church of Jesus Christ of Latter-day Saints in Minnesota</span>

The Church of Jesus Christ of Latter-day Saints in Minnesota refers to the Church of Jesus Christ of Latter-day Saints and its members in Minnesota. The official church membership as a percentage of general population was 0.59% in 2014. According to the 2014 Pew Forum on Religion & Public Life survey, roughly 1% of Minnesotans self-identify themselves most closely with the LDS Church. The LDS Church is the 12th largest denomination in Minnesota.

<span class="mw-page-title-main">The Church of Jesus Christ of Latter-day Saints in Massachusetts</span>

The Church of Jesus Christ of Latter-day Saints in Massachusetts refers to the Church of Jesus Christ of Latter-day Saints and its members in Massachusetts.

<span class="mw-page-title-main">The Church of Jesus Christ of Latter-day Saints in North Dakota</span>

The Church of Jesus Christ of Latter-day Saints held its first congregation in North Dakota in 1919. In 2022, there was 11,487 members in 26 congregations.

<span class="mw-page-title-main">The Church of Jesus Christ of Latter-day Saints in New Jersey</span>

The Church of Jesus Christ of Latter-day Saints in New Jersey refers to the Church of Jesus Christ of Latter-day Saints and its members in New Jersey.

<span class="mw-page-title-main">The Church of Jesus Christ of Latter-day Saints in Wisconsin</span>

The Church of Jesus Christ of Latter-day Saints in Wisconsin refers to the Church of Jesus Christ of Latter-day Saints and its members in Wisconsin. The official church membership as a percentage of general population was 0.44% in 2014. According to the 2014 Pew Forum on Religion & Public Life survey, less than 1% of Wisconsinites self-identify themselves most closely with the LDS Church. The LDS Church is the 10th largest denomination in Wisconsin.

<span class="mw-page-title-main">The Church of Jesus Christ of Latter-day Saints in Kansas</span>

The Church of Jesus Christ of Latter-day Saints in Kansas refers to the Church of Jesus Christ of Latter-day Saints and its members in Kansas. The first congregation of the church in Kansas was organized in 1895. As of 2022, it has grown to 39,356 members in 74 congregations.

<span class="mw-page-title-main">The Church of Jesus Christ of Latter-day Saints in West Virginia</span>

The Church of Jesus Christ of Latter-day Saints in West Virginia refers to the Church of Jesus Christ of Latter-day Saints and its members in West Virginia. The official church membership as a percentage of general population was 0.92% in 2014. According to the 2014 Pew Forum on Religion & Public Life survey, roughly 2% of West Virginians self-identify themselves most closely with The Church of Jesus Christ of Latter-day Saints. The LDS Church is the 9th largest denomination in West Virginia.

<span class="mw-page-title-main">The Church of Jesus Christ of Latter-day Saints in New Hampshire</span>

The Church of Jesus Christ of Latter-day Saints in New Hampshire refers to the Church of Jesus Christ of Latter-day Saints and its members in New Hampshire.

<span class="mw-page-title-main">The Church of Jesus Christ of Latter-day Saints in Maine</span>

The Church of Jesus Christ of Latter-day Saints in Maine refers to the Church of Jesus Christ of Latter-day Saints and its members in Maine. Official church membership as a percentage of general population was 0.81% in 2014. According to the 2014 Pew Forum on Religion & Public Life survey, roughly 2% of Mainers self-identify themselves most closely with the LDS Church.

<span class="mw-page-title-main">Demographics of the Church of Jesus Christ of Latter-day Saints</span>

The demographics of the Church of Jesus Christ of Latter-day Saints include statistical data relating to the church's population and particular groups within it.

References

  1. 1 2 "Facts and Statistics: Statistics by Country: United States", Newsroom, LDS Church, retrieved 15 May 2022
  2. Excludes groups meeting separate from wards and branches.
  3. Category:United States Family History Centers, familysearch.org, retrieved March 28, 2022
  4. "General Handbook [2022], 33.6.2 Members of Record". ChurchofJesusChrist.org. Retrieved 11 Aug 2022.
  5. "State Population Totals and Components of Change: 2020-2022". www.census.gov. Archived from the original on 2023-05-31. Retrieved 2023-06-14.
  6. "Religion in American Culture -- Pew Forum on Religion & Public Life". Archived from the original on 14 February 2015. Retrieved 14 February 2015.
  7. Portrait of Mormons in the U.S. Archived 2009-07-30 at the Wayback Machine , Pew Forum on Religion & Public Life, July 24, 2009
  8. "The most and least racially diverse U.S. religious groups". pewresearch.org. Jul 27, 2015.
  9. "Racial and ethnic composition among Mormons". pewforum.org. Retrieved 2021-11-24.