Tropical cyclones and subtropical cyclones are named by various warning centers to simplify communication between forecasters and the general public regarding forecasts, watches and warnings. The names are intended to reduce confusion in the event of concurrent storms in the same basin. Once storms develop sustained wind speeds of more than 33 knots, names are generally assigned to them from predetermined lists, depending on the basin in which they originate. Some tropical depressions are named in the Western Pacific, while tropical cyclones must contain a significant amount of gale-force winds before they are named in the Southern Hemisphere.
Tropical cyclone warnings and watches are alerts issued by national weather forecasting bodies to coastal areas threatened by the imminent approach of a tropical cyclone of tropical storm or hurricane intensity. They are notices to the local population and civil authorities to make appropriate preparation for the cyclone, including evacuation of vulnerable areas where necessary. It is important that interests throughout the area of an alert make preparations to protect life and property, and do not disregard it on the strength of the detailed forecast track.
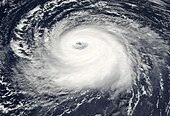
Tropical cyclones are ranked on one of five tropical cyclone intensity scales, according to their maximum sustained winds and which tropical cyclone basins they are located in. Only a few scales of classifications are used officially by the meteorological agencies monitoring the tropical cyclones, but other scales also exist, such as accumulated cyclone energy, the Power Dissipation Index, the Integrated Kinetic Energy Index, and the Hurricane Severity Index.

The 2007–08 South Pacific cyclone season was one of the least active South Pacific tropical cyclone seasons on record, with only four tropical cyclones occurring within the South Pacific basin to the east of 160°E. The season officially ran from November 1, 2007, until April 30, 2008, although the first cyclone, Tropical Depression 01F, developed on October 17. The most intense tropical cyclone of the season was Severe Tropical Cyclone Daman, which reached a minimum pressure of 925 hPa (27.32 inHg) as it affected Fiji. After the season had ended, the names Daman, Funa, and Gene were retired from the tropical cyclone naming lists.

In the south-west Indian Ocean, tropical cyclones form south of the equator and west of 90° E to the coast of Africa.
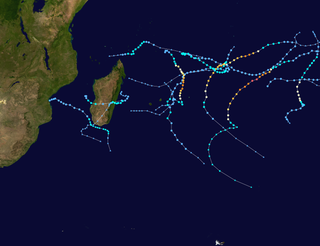
The 2009–10 South-West Indian Ocean tropical cyclone season was a near average event in tropical cyclone formation. The season officially started on July 1, 2009, and ended on June 30, 2010, after incorporating the tropical cyclone season which ran from November 1 to April 30 for all areas except for Mauritius and the Seychelles, for which it ended on May 15, 2010. In this basin which officially runs from 30 to 90E, and is, to the south of the equator, the main warning center is the Regional Specialized Meteorological Center on La Réunion Island; however they delegate the naming of Cyclones to the Meteorological services of Mauritius and Madagascar.
The following outline is provided as an overview of and topical guide to tropical cyclones:
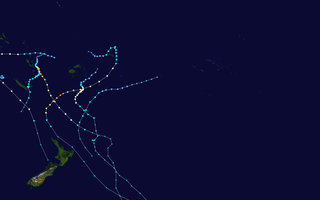
The 2010–11 South Pacific cyclone season was an average tropical cyclone season, with seven tropical cyclones and five severe tropical cyclones developing during the season. The season ran from November 1, 2010 until April 30, 2011, though if any tropical cyclones had developed between July 1, 2010 and June 30, 2011, the official tropical cyclone year, they would have been counted towards the season's total. Within the South Pacific basin tropical cyclones were officially monitored by the Fiji Meteorological Service's Regional Specialized Meteorological Center in Nadi, Fiji, north of 25°S, and to the south the Meteorological Service of New Zealand's Tropical Cyclone Warning Center in Wellington, New Zealand. Any disturbances forming in the region were designated with a sequential number suffixed by the letter F. In addition, the United States Military's Joint Typhoon Warning Center unofficially monitored parts of the basin during the season, where any systems judged to have achieved tropical storm strength or greater received a number suffixed with the letter P. RSMC Nadi and TCWC Wellington both use the Australian Tropical Cyclone Intensity Scale, and measure wind speeds over a period of ten minutes, while the JTWC measures sustained winds over a period of one minute which can be applied to the Saffir–Simpson hurricane scale. Seven named storms formed or moved into the South Pacific basin during the 2010–11 season, the strongest of which was Severe Tropical Cyclone Wilma in late January.
The practice of using names to identify tropical cyclones goes back several centuries, with storms named after places, saints or things they hit before the formal start of naming in each basin. Examples of such names are the 1928 Okeechobee hurricane and the 1938 New England hurricane. The system currently in place provides identification of tropical cyclones in a brief form that is easily understood and recognized by the public. The credit for the first usage of personal names for weather systems is given to the Queensland Government Meteorologist Clement Wragge, who named tropical cyclones and anticyclones between 1887 and 1907. This system of naming fell into disuse for several years after Wragge retired, until it was revived in the latter part of World War II for the Western Pacific. Over the following decades, formal naming schemes were introduced for several tropical cyclone basins, including the North and South Atlantic, Eastern, Central, Western and Southern Pacific basins as well as the Australian region and Indian Ocean.

Throughout 2006, 133 tropical cyclones formed in seven bodies of water known as tropical cyclone basins. Of these, 80 have been named, including two tropical cyclones in the South Atlantic Ocean, and a tropical cyclone in the Mediterranean Sea, by various weather agencies when they attained maximum sustained winds of 65 km/h (40 mph). The strongest storms of the year were Typhoon Yagi in the Western Pacific, and Cyclone Glenda of the Australian region. The deadliest and costliest storms of the year were a series of five typhoons that struck the Philippines and China; Chanchu, Bilis, Saomai, Xangsane, and Durian, with most of the damage being caused by Durian of November. So far, 27 Category 3 tropical cyclones formed, including five Category 5 tropical cyclones in the year. The accumulated cyclone energy (ACE) index for the 2006, as calculated by Colorado State University was 761 units.

Throughout 2013, 139 tropical cyclones formed in seven different areas called basins. Of these, 67 have been named by various weather agencies when they attained maximum sustained winds of 35 knots. The strongest and deadliest tropical cyclone of the year was Typhoon Haiyan, which was estimated to have a minimum barometric pressure of 895 hPa (26.43 inHg) and caused at least 6,300 deaths in the Philippines. The costliest tropical cyclone of the year was Hurricane Manuel, which was responsible for at least $4.2 billion worth of damages in Mexico. 21 major tropical cyclones formed in 2013, including five Category 5 tropical cyclones. The accumulated cyclone energy (ACE) index for the 2013, as calculated by Colorado State University was 618.5 units.

During 2001, tropical cyclones formed in seven different areas called basins, located within various parts of the Atlantic, Pacific and Indian Oceans. A total of 128 tropical cyclones formed within bodies of water known as tropical cyclone basins, with 83 of them were further named by the responsible weather agencies when they attained maximum sustained winds of 35 knots. Typhoon Faxai is the strongest tropical cyclone throughout the year, peaking with a pressure of 915 hPa (27.02 inHg) and attaining 10-minute sustained winds of 195 km/h (120 mph). The deadliest tropical cyclone of the year was Lingling in the West Pacific which caused 379 fatalities in total as it struck the Philippines and Vietnam, while the costliest storm of the year was Michelle, with a damage cost of around $2.43 billion as it catastrophically affected the Greater Antilles and the Bahamas in late October. So far, 23 Category 3 tropical cyclones formed, including two Category 5 tropical cyclones formed in the year. The accumulated cyclone energy (ACE) index for the 2001, as calculated by Colorado State University was 672.4 units.

During 2003, tropical cyclones formed within seven different tropical cyclone basins, located within various parts of the Atlantic, Pacific and Indian Oceans. During the year, a total of 129 systems formed with 85 of these developing further and were named by the responsible warning centre. The strongest tropical cyclone of the year was Cyclone Inigo, which was estimated to have a minimum barometric pressure of 900 hPa (26.58 inHg) and was tied with Cyclone Gwenda for being the most intense recorded cyclone in the Australian region in terms of pressure, with the possible exception of Cyclone Mahina. So far, 26 Category 3 tropical cyclones formed, including six Category 5 tropical cyclones formed in 2003, tying 2021. The accumulated cyclone energy (ACE) index for the 2003, as calculated by Colorado State University was 833 units.

The year 1997 was regarded as one of the most intense tropical cyclone years on record, featuring a record 12 category 5-equivalent tropical cyclones, according to the Saffir–Simpson hurricane wind scale. The year also featured the second-highest amount of accumulated cyclone energy (ACE) on record, just behind 1992 and 2018. Throughout the year, 108 tropical cyclones have developed in bodies of water, commonly known as tropical cyclone basins. However, only 89 tropical cyclones were of those attaining 39 mph or greater, falling just below the long term average of 102 named systems. The most active basin was the Western Pacific, attaining an ACE amount of 571, the highest ever recorded in any season in any basin on record. The deadliest tropical cyclone was Severe Tropical Storm Linda (Openg). The costliest tropical cyclone was Super Typhoon Winnie (Ibiang), which set a record for having the largest eye on record. The most intense tropical cyclone was Hurricane Linda, peaking at 902 hPa/mbar. Typhoon Paka (Rubing), the longest-lived system, produced the fourth-highest ACE for a single tropical cyclone, just behind Typhoon Nancy (1961), Hurricane/Typhoon Ioke (2006), and Cyclone Freddy (2023). The accumulated cyclone energy (ACE) index for the 1997, as calculated by Colorado State University was 1,099.2 units.
During 1994, tropical cyclones formed within seven different tropical cyclone basins, located within various parts of the Atlantic, Pacific and Indian Oceans. During the year, a total of 124 systems formed with 91 of these developing further and were named by the responsible warning centre. The strongest tropical cyclone of the year was Cyclone Geralda, which was estimated to have a minimum barometric pressure of 905 hPa (26.72 inHg). The deadliest tropical cyclone was Typhoon Fred, which caused 1,248 fatalities in China, while the costliest was Tropical Storm Sharon, which caused an estimated $5.27 billion USD in damage after striking Hong Kong, China and the Philippines. Five Category 5 tropical cyclones formed in 1994. The accumulated cyclone energy (ACE) index for the 1994, as calculated by Colorado State University was 1019 units.

The year 1992 featured the highest amount of accumulated cyclone energy (ACE) on record, with an ACE rating of 1,163.1 units. It would be regarded as one of the most intense tropical cyclone years on record. Throughout the year, 111 tropical cyclones formed, of which 101 were given names by various weather agencies. Five Category 5 tropical cyclones would form in 1992.
During 1991, tropical cyclones formed within seven different tropical cyclone basins, located within various parts of the Atlantic, Pacific and Indian Oceans. During the year, a total of 100 systems formed with 75 of these developing further and were named by the responsible warning centre. The strongest tropical cyclone of the year was Typhoon Yuri, which was estimated to have a minimum barometric pressure of 895 hPa (26.43 inHg). The deadliest tropical cyclone was Cyclone BOB 01, which caused 138,866 fatalities in Bangladesh, Northeastern India, Myanmar, Yunnan, while the costliest was Typhoon Mireille, which caused an estimated $10 billion USD in damage after striking Japan. Four Category 5 tropical cyclones formed in 1991.

Throughout 2008, 124 tropical cyclones have formed in bodies of water known as tropical cyclone basins. Of these, 83 have been named, by various weather agencies when they attained maximum sustained winds of 35 knots. The strongest storm of the year was Typhoon Jangmi in the Western Pacific Ocean. The deadliest storm of the year was Cyclone Nargis, which caused devastating and castatrophic destruction in Myanmar with 138,373 fatalities. The costliest storm of the year was Hurricane Ike, which wreaked havoc thorough Cuba and Texas, with $38 billion in damage. Throughout the year, 24 Category 3 tropical cyclones formed, including one Category 5 tropical cyclone in the year. The accumulated cyclone energy (ACE) index for the 2008, as calculated by Colorado State University was 613.9 units.
In 2024, tropical cyclones will form in seven major bodies of water, commonly known as tropical cyclone basins. Tropical cyclones will be named by various weather agencies when they attain maximum sustained winds of 35 knots. So far, eighteen systems have formed, with ten of them being named. The most intense storm of the year so far is Djoungou, with a minimum pressure of 922 hPa (27.23 inHg). Among this year's systems, so far, two became a major tropical cyclone, with no tropical cyclones intensifying into Category 5 tropical cyclones on the Saffir–Simpson scale (SSHWS). The accumulated cyclone energy (ACE) index for the 2024 so far, as calculated by Colorado State University (CSU) is 69.6 units overall.