Tropical cyclogenesis

Last updated

Global tropical cyclone tracks between 1985 and 2005, indicating the areas where tropical cyclones usually develop Global tropical cyclone tracks-edit2.jpg
Global tropical cyclone tracks between 1985 and 2005, indicating the areas where tropical cyclones usually develop

Tropical cyclogenesis is the development and strengthening of a tropical cyclone in the atmosphere. [1] The mechanisms through which tropical cyclogenesis occurs are distinctly different from those through which temperate cyclogenesis occurs. Tropical cyclogenesis involves the development of a warm-core cyclone, due to significant convection in a favorable atmospheric environment. [2]

Contents

Tropical cyclogenesis requires six main factors: sufficiently warm sea surface temperatures (at least 26.5 °C (79.7 °F)), atmospheric instability, high humidity in the lower to middle levels of the troposphere, enough Coriolis force to develop a low-pressure center, a pre-existing low-level focus or disturbance, and low vertical wind shear. [3]

Tropical cyclones tend to develop during the summer, but have been noted in nearly every month in most basins. Climate cycles such as ENSO and the Madden–Julian oscillation modulate the timing and frequency of tropical cyclone development. [4] [5] The maximum potential intensity is a limit on tropical cyclone intensity which is strongly related to the water temperatures along its path. [6]

An average of 86 tropical cyclones of tropical storm intensity form annually worldwide. Of those, 47 reach strength higher than 74 mph (119 km/h), and 20 become intense tropical cyclones (at least Category 3 intensity on the Saffir–Simpson scale). [7]

Requirements for tropical cyclone formation

Depth of 26 degC isotherm on October 1, 2006 Depth26Cisotherm.png
Depth of 26 °C isotherm on October 1, 2006

There are six main requirements for tropical cyclogenesis: sufficiently warm sea surface temperatures, atmospheric instability, high humidity in the lower to middle levels of the troposphere, enough Coriolis force to sustain a low pressure center, a preexisting low level focus or disturbance, and low vertical wind shear. [3] While these conditions are necessary for tropical cyclone formation, they do not guarantee that a tropical cyclone will form. [3]

Warm waters, instability, and mid-level moisture

Waves in the trade winds in the Atlantic Ocean--areas of converging winds that move slowly along the same track as the prevailing wind--create instabilities in the atmosphere that may lead to the formation of hurricanes. Atlantic hurricane graphic.png
Waves in the trade winds in the Atlantic Ocean—areas of converging winds that move slowly along the same track as the prevailing wind—create instabilities in the atmosphere that may lead to the formation of hurricanes.

Normally, an ocean temperature of 26.5 °C (79.7 °F) spanning through at least a 50-metre depth is considered the minimum to maintain a tropical cyclone. [3] These warm waters are needed to maintain the warm core that fuels tropical systems. This value is well above 16.1 °C (60.9 °F), the global average surface temperature of the oceans. [8]

Tropical cyclones are known to form even when normal conditions are not met. For example, cooler air temperatures at a higher altitude (e.g., at the 500  hPa level, or 5.9 km) can lead to tropical cyclogenesis at lower water temperatures, as a certain lapse rate is required to force the atmosphere to be unstable enough for convection. In a moist atmosphere, this lapse rate is 6.5 °C/km, while in an atmosphere with less than 100% relative humidity, the required lapse rate is 9.8 °C/km. [9]

At the 500 hPa level, the air temperature averages −7 °C (18 °F) within the tropics, but air in the tropics is normally dry at this level, giving the air room to wet-bulb, or cool as it moistens, to a more favorable temperature that can then support convection. A wetbulb temperature at 500 hPa in a tropical atmosphere of −13.2 °C is required to initiate convection if the water temperature is 26.5 °C, and this temperature requirement increases or decreases proportionally by 1 °C in the sea surface temperature for each 1 °C change at 500 hpa. Under a cold cyclone, 500 hPa temperatures can fall as low as −30 °C, which can initiate convection even in the driest atmospheres. This also explains why moisture in the mid-levels of the troposphere, roughly at the 500 hPa level, is normally a requirement for development. However, when dry air is found at the same height, temperatures at 500 hPa need to be even colder as dry atmospheres require a greater lapse rate for instability than moist atmospheres. [10] [11] At heights near the tropopause, the 30-year average temperature (as measured in the period encompassing 1961 through 1990) was −77 °C (−105 °F). [12] A recent example of a tropical cyclone that maintained itself over cooler waters was Epsilon of the 2005 Atlantic hurricane season. [13]

Role of Maximum Potential Intensity (MPI)

Kerry Emanuel created a mathematical model around 1988 to compute the upper limit of tropical cyclone intensity based on sea surface temperature and atmospheric profiles from the latest global model runs. Emanuel's model is called the maximum potential intensity , or MPI. Maps created from this equation show regions where tropical storm and hurricane formation is possible, based upon the thermodynamics of the atmosphere at the time of the last model run. This does not take into account vertical wind shear. [14]

Schematic representation of flow around a low-pressure area (in this case, Hurricane Isabel) in the Northern hemisphere. The pressure gradient force is represented by blue arrows, the Coriolis acceleration (always perpendicular to the velocity) by red arrows Hurricane isabel and coriolis force.jpg
Schematic representation of flow around a low-pressure area (in this case, Hurricane Isabel) in the Northern hemisphere. The pressure gradient force is represented by blue arrows, the Coriolis acceleration (always perpendicular to the velocity) by red arrows

Coriolis force

A minimum distance of 500 km (310 mi) from the equator (about 4.5 degrees from the equator) is normally needed for tropical cyclogenesis. [3] The Coriolis force imparts rotation on the flow and arises as winds begin to flow in toward the lower pressure created by the pre-existing disturbance. In areas with a very small or non-existent Coriolis force (e.g. near the Equator), the only significant atmospheric forces in play are the pressure gradient force (the pressure difference that causes winds to blow from high to low pressure [15] ) and a smaller friction force; these two alone would not cause the large-scale rotation required for tropical cyclogenesis. The existence of a significant Coriolis force allows the developing vortex to achieve gradient wind balance. [16] This is a balance condition found in mature tropical cyclones that allows latent heat to concentrate near the storm core; this results in the maintenance or intensification of the vortex if other development factors are neutral. [17]

Low level disturbance

Whether it be a depression in the Intertropical Convergence Zone (ITCZ), a tropical wave, a broad surface front, or an outflow boundary, a low level feature with sufficient vorticity and convergence is required to begin tropical cyclogenesis. [3] Even with perfect upper-level conditions and the required atmospheric instability, the lack of a surface focus will prevent the development of organized convection and a surface low. [3] Tropical cyclones can form when smaller circulations within the Intertropical Convergence Zone come together and merge. [18]

Weak vertical wind shear

Tropical Storm Paulette in 2020, with its low-level centre partially exposed due to strong windshear. Paulette 2020-09-10 1200Z.png
Tropical Storm Paulette in 2020, with its low-level centre partially exposed due to strong windshear.

Vertical wind shear of less than 10 m/s (20  kt, 22 mph) between the surface and the tropopause is favored for tropical cyclone development. [3] Weaker vertical shear makes the storm grow faster vertically into the air, which helps the storm develop and become stronger. If the vertical shear is too strong, the storm cannot rise to its full potential and its energy becomes spread out over too large of an area for the storm to strengthen. [19] Strong wind shear can "blow" the tropical cyclone apart, [19] as it displaces the mid-level warm core from the surface circulation and dries out the mid-levels of the troposphere, halting development. In smaller systems, the development of a significant mesoscale convective complex in a sheared environment can send out a large enough outflow boundary to destroy the surface cyclone. Moderate wind shear can lead to the initial development of the convective complex and surface low similar to the mid-latitudes, but it must diminish to allow tropical cyclogenesis to continue. [19]

Favorable trough interactions

Limited vertical wind shear can be positive for tropical cyclone formation. When an upper-level trough or upper-level low is roughly the same scale as the tropical disturbance, the system can be steered by the upper level system into an area with better diffluence aloft, which can cause further development. Weaker upper cyclones are better candidates for a favorable interaction. There is evidence that weakly sheared tropical cyclones initially develop more rapidly than non-sheared tropical cyclones, although this comes at the cost of a peak in intensity with much weaker wind speeds and higher minimum pressure. [20] This process is also known as baroclinic initiation of a tropical cyclone. Trailing upper cyclones and upper troughs can cause additional outflow channels and aid in the intensification process. Developing tropical disturbances can help create or deepen upper troughs or upper lows in their wake due to the outflow jet emanating from the developing tropical disturbance/cyclone. [21] [22]

There are cases where large, mid-latitude troughs can help with tropical cyclogenesis when an upper-level jet stream passes to the northwest of the developing system, which will aid divergence aloft and inflow at the surface, spinning up the cyclone. This type of interaction is more often associated with disturbances already in the process of recurvature. [23]

Times of formation

Peaks of activity worldwide WorldwideTCpeaks.gif
Peaks of activity worldwide

Worldwide, tropical cyclone activity peaks in late summer when water temperatures are warmest. Each basin, however, has its own seasonal patterns. On a worldwide scale, May is the least active month, while September is the most active. [24]

In the North Atlantic, a distinct hurricane season occurs from June 1 through November 30, sharply peaking from late August through October. [24] The statistical peak of the North Atlantic hurricane season is September 10. [25] The Northeast Pacific has a broader period of activity, but in a similar time frame to the Atlantic. [24] The Northwest Pacific sees tropical cyclones year-round, with a minimum in February and a peak in early September. [24] In the North Indian basin, storms are most common from April to December, with peaks in May and November. [24]

In the Southern Hemisphere, tropical cyclone activity generally begins in early November and generally ends on April 30. Southern Hemisphere activity peaks in mid-February to early March. [24] Virtually all the Southern Hemisphere activity is seen from the southern African coast eastward, toward South America. Tropical cyclones are rare events across the south Atlantic Ocean and the far southeastern Pacific Ocean. [26]

Season lengths and averages
BasinSeason
start
Season
end
Tropical
cyclones
Refs
North AtlanticJune 1November 3014.4 [27]
Eastern PacificMay 15November 3016.6 [27]
Western PacificJanuary 1December 3126.0 [27]
North IndianJanuary 1December 3112 [28]
South-West IndianJuly 1June 309.3 [27] [29]
Australian regionNovember 1April 3011.0 [30]
Southern PacificNovember 1April 307.1 [31]
Total:96.4

Unusual areas of formation

Hurricane Pablo formed in the extreme northeastern Atlantic during the 2019 season. Pablo 2019-10-27 1402Z.jpg
Hurricane Pablo formed in the extreme northeastern Atlantic during the 2019 season.

Middle latitudes

Areas farther than 30 degrees from the equator (except in the vicinity of a warm current) are not normally conducive to tropical cyclone formation or strengthening, and areas more than 40 degrees from the equator are often very hostile to such development. The primary limiting factor is water temperatures, although higher shear at increasing latitudes is also a factor. These areas are sometimes frequented by cyclones moving poleward from tropical latitudes. On rare occasions, such as Pablo in 2019, Alex in 2004, [32] Alberto in 1988, [33] and the 1975 Pacific Northwest hurricane, [34] storms may form or strengthen in this region. Typically, tropical cyclones will undergo extratropical transition after recurving polewards, and typically become fully extratropical after reaching 45–50° of latitude. The majority of extratropical cyclones tend to restrengthen after completing the transition period. [35]

Near the Equator

Areas within approximately ten degrees latitude of the equator do not experience a significant Coriolis force, a vital ingredient in tropical cyclone formation. [36] However, a few tropical cyclones have been observed forming within five degrees of the equator. [37]

South Atlantic

A combination of wind shear and a lack of tropical disturbances from the Intertropical Convergence Zone (ITCZ) makes it very difficult for the South Atlantic to support tropical activity. [38] [39] At least six tropical cyclones have been observed here, including a weak tropical storm in 1991 off the coast of Africa near Angola, Hurricane Catarina in March 2004, which made landfall in Brazil at Category 2 strength, Tropical Storm Anita in March 2010, Tropical Storm Iba in March 2019, Tropical Storm 01Q in February 2021, and Tropical Storm Akará in February 2024. [40]

Mediterranean and Black Seas

Storms that appear similar to tropical cyclones in structure sometimes occur in the Mediterranean Sea. Notable examples of these "Mediterranean tropical cyclones" include an unnamed system in September 1969, Leucosia in 1982, Celeno in 1995, Cornelia in 1996, Querida in 2006, Rolf in 2011, Qendresa in 2014, Numa in 2017, Ianos in 2020, and Daniel in 2023. However, there is debate on whether these storms were tropical in nature. [41]

The Black Sea has, on occasion, produced or fueled storms that begin cyclonic rotation, and that appear to be similar to tropical-like cyclones observed in the Mediterranean. [42] Two of these storms reached tropical storm and subtropical storm intensity in August 2002 and September 2005 respectively. [43]

Elsewhere

Tropical cyclogenesis is extremely rare in the far southeastern Pacific Ocean, due to the cold sea-surface temperatures generated by the Humboldt Current, and also due to unfavorable wind shear; as such, Cyclone Yaku in March 2023 is the only known instance of a tropical cyclone impacting western South America. Besides Yaku, there have been several other systems that have been observed developing in the region east of 120°W, which is the official eastern boundary of the South Pacific basin. On May 11, 1983, a tropical depression developed near 110°W, which was thought to be the easternmost forming South Pacific tropical cyclone ever observed in the satellite era. [44] In mid-2015, a rare subtropical cyclone was identified in early May, slightly near Chile, even further east than the 1983 tropical depression. This system was unofficially dubbed Katie by researchers. [45] Another subtropical cyclone was identified at 77.8 degrees longitude west in May 2018, just off the coast of Chile. [46] This system was unofficially named Lexi by researchers. [47] A subtropical cyclone was spotted just off the Chilean coast in January 2022, named Humberto by researchers. [48] [49]

Vortices have been reported off the coast of Morocco in the past. However, it is debatable if they are truly tropical in character. [42]

Tropical activity is also extremely rare in the Great Lakes. However, a storm system that appeared similar to a subtropical or tropical cyclone formed in September 1996 over Lake Huron. The system developed an eye-like structure in its center, and it may have briefly been a subtropical or tropical cyclone. [50]

Inland intensification

Tropical cyclones typically began to weaken immediately following and sometimes even prior to landfall as they lose the sea fueled heat engine and friction slows the winds. However, under some circumstances, tropical or subtropical cyclones may maintain or even increase their intensity for several hours in what is known as the brown ocean effect. This is most likely to occur with warm moist soils or marshy areas, with warm ground temperatures and flat terrain, and when upper level support remains conducive.

Influence of large-scale climate cycles

Influence of ENSO

Loop of sea surface temperature (SST) anomalies in the Tropical Pacific Sstaanim.gif
Loop of sea surface temperature (SST) anomalies in the Tropical Pacific
ENSO effects on hurricanes distribution. ENSO effects on Hurricane activity.jpg
ENSO effects on hurricanes distribution.

El Niño (ENSO) shifts the region (warmer water, up and down welling at different locations, due to winds) in the Pacific and Atlantic where more storms form, resulting in nearly constant accumulated cyclone energy (ACE) values in any one basin. The El Niño event typically decreases hurricane formation in the Atlantic, and far western Pacific and Australian regions, but instead increases the odds in the central North and South Pacific and particular in the western North Pacific typhoon region. [51]

Tropical cyclones in the northeastern Pacific and north Atlantic basins are both generated in large part by tropical waves from the same wave train. [52]

In the Northwestern Pacific, El Niño shifts the formation of tropical cyclones eastward. During El Niño episodes, tropical cyclones tend to form in the eastern part of the basin, between 150°E and the International Date Line (IDL). [53] Coupled with an increase in activity in the North-Central Pacific (IDL to 140°W) and the South-Central Pacific (east of 160°E), there is a net increase in tropical cyclone development near the International Date Line on both sides of the equator. [54] While there is no linear relationship between the strength of an El Niño and tropical cyclone formation in the Northwestern Pacific, typhoons forming during El Niño years tend to have a longer duration and higher intensities. [55] Tropical cyclogenesis in the Northwestern Pacific is suppressed west of 150°E in the year following an El Niño event. [53]

Influence of the MJO

5-day running mean of MJO. Note how it moves eastward with time. MJO 5-day running mean through 1 Oct 2006.png
5-day running mean of MJO. Note how it moves eastward with time.

In general, westerly wind increases associated with the Madden–Julian oscillation lead to increased tropical cyclogenesis in all basins. As the oscillation propagates from west to east, it leads to an eastward march in tropical cyclogenesis with time during that hemisphere's summer season. [56] There is an inverse relationship between tropical cyclone activity in the western Pacific basin and the north Atlantic basin, however. When one basin is active, the other is normally quiet, and vice versa. The main cause appears to be the phase of the Madden–Julian oscillation, or MJO, which is normally in opposite modes between the two basins at any given time. [57]

Influence of equatorial Rossby waves

Research has shown that trapped equatorial Rossby wave packets can increase the likelihood of tropical cyclogenesis in the Pacific Ocean, as they increase the low-level westerly winds within that region, which then leads to greater low-level vorticity. The individual waves can move at approximately 1.8  m/s (4 mph) each, though the group tends to remain stationary. [58]

Seasonal forecasts

Since 1984, Colorado State University has been issuing seasonal tropical cyclone forecasts for the north Atlantic basin, with results that they claim are better than climatology. [59] The university claims to have found several statistical relationships for this basin that appear to allow long range prediction of the number of tropical cyclones. Since then, numerous others have issued seasonal forecasts for worldwide basins. [60] The predictors are related to regional oscillations in the global climate system: the Walker circulation which is related to the El Niño–Southern Oscillation; the North Atlantic oscillation (NAO); the Arctic oscillation (AO); and the Pacific North American pattern (PNA). [59]

See also

Related Research Articles

<span class="mw-page-title-main">Cyclone</span> Large scale air mass that rotates around a strong center of low pressure

In meteorology, a cyclone is a large air mass that rotates around a strong center of low atmospheric pressure, counterclockwise in the Northern Hemisphere and clockwise in the Southern Hemisphere as viewed from above. Cyclones are characterized by inward-spiraling winds that rotate about a zone of low pressure. The largest low-pressure systems are polar vortices and extratropical cyclones of the largest scale. Warm-core cyclones such as tropical cyclones and subtropical cyclones also lie within the synoptic scale. Mesocyclones, tornadoes, and dust devils lie within the smaller mesoscale.

<span class="mw-page-title-main">Subtropical cyclone</span> Cyclonic storm with both tropical and extratropical characteristics

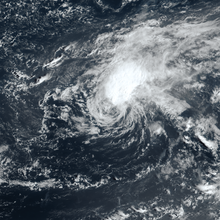
A subtropical cyclone is a weather system that has some characteristics of both tropical and extratropical cyclones.

<span class="mw-page-title-main">Low-pressure area</span> Area with air pressures lower than adjacent areas

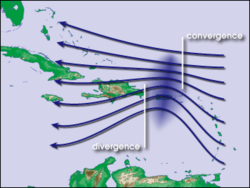
In meteorology, a low-pressure area, low area or low is a region where the atmospheric pressure is lower than that of surrounding locations. Low-pressure areas are commonly associated with inclement weather, while high-pressure areas are associated with lighter winds and clear skies. Winds circle anti-clockwise around lows in the northern hemisphere, and clockwise in the southern hemisphere, due to opposing Coriolis forces. Low-pressure systems form under areas of wind divergence that occur in the upper levels of the atmosphere (aloft). The formation process of a low-pressure area is known as cyclogenesis. In meteorology, atmospheric divergence aloft occurs in two kinds of places:

<span class="mw-page-title-main">Tropical wave</span> Type of atmospheric trough

A tropical wave, in and around the Atlantic Ocean, is a type of atmospheric trough, an elongated area of relatively low air pressure, oriented north to south, which moves from east to west across the tropics, causing areas of cloudiness and thunderstorms. Tropical waves form in the easterly flow along the equatorial side of the subtropical ridge or belt of high air pressure which lies north and south of the Intertropical Convergence Zone (ITCZ). Tropical waves are generally carried westward by the prevailing easterly winds along the tropics and subtropics near the equator. They can lead to the formation of tropical cyclones in the north Atlantic and northeastern Pacific basins. A tropical wave study is aided by Hovmöller diagrams, a graph of meteorological data.

<span class="mw-page-title-main">Pacific hurricane</span> Mature tropical cyclone that develops within the eastern and central Pacific Ocean

A Pacific hurricane is a tropical cyclone that develops within the northeastern and central Pacific Ocean to the east of 180°W, north of the equator. For tropical cyclone warning purposes, the northern Pacific is divided into three regions: the eastern, central, and western, while the southern Pacific is divided into 2 sections, the Australian region and the southern Pacific basin between 160°E and 120°W. Identical phenomena in the western north Pacific are called typhoons. This separation between the two basins has a practical convenience, however, as tropical cyclones rarely form in the central north Pacific due to high vertical wind shear, and few cross the dateline.

<span class="mw-page-title-main">Typhoon</span> Types of tropical cyclone that develops in the Northern Hemisphere going to the eastern side

A typhoon is a tropical cyclone that develops between 180° and 100°E in the Northern Hemisphere and which produces sustained hurricane-force winds of at least 119 km/h (74 mph). This region is referred to as the Northwestern Pacific Basin, accounting for almost one third of the world's tropical cyclones. The term hurricane refers to a tropical cyclone in the north central and northeast Pacific, and the north Atlantic. In all of the preceding regions, weaker tropical cyclones are called tropical storms. For organizational purposes, the northern Pacific Ocean is divided into three regions: the eastern, central, and western. The Regional Specialized Meteorological Center (RSMC) for tropical cyclone forecasts is in Japan, with other tropical cyclone warning centres for the northwest Pacific in Hawaii, the Philippines, and Hong Kong. Although the RSMC names each system, the main name list itself is coordinated among 18 countries that have territories threatened by typhoons each year.

<span class="mw-page-title-main">Atlantic hurricane</span> Tropical cyclone that forms in the Atlantic Ocean

An Atlantic hurricane is a type of tropical cyclone that forms in the Atlantic Ocean primarily between June and November. The terms "hurricane", "typhoon", and "cyclone" can be used interchangeably to describe this weather phenomenon. These storms are rotating, organized systems of clouds and thunderstorms that originate over tropical or subtropical waters and have closed low-level circulation, not to be confused with tornadoes. They form over low pressure systems. In the North Atlantic, central North Pacific, and eastern North Pacific, the term "hurricane" is mainly used, whereas "typhoon" is more commonly used for storms originating in the western North Pacific. The term "cyclone" is used in the South Pacific and Indian Ocean.

<span class="mw-page-title-main">Dvorak technique</span> Subjective technique to estimate tropical cyclone intensity

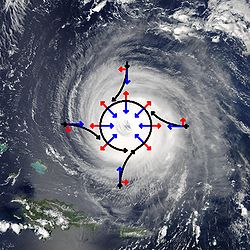
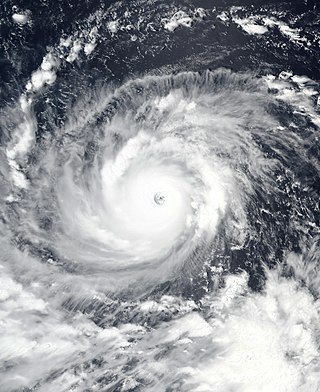
The Dvorak technique is a widely used system to estimate tropical cyclone intensity based solely on visible and infrared satellite images. Within the Dvorak satellite strength estimate for tropical cyclones, there are several visual patterns that a cyclone may take on which define the upper and lower bounds on its intensity. The primary patterns used are curved band pattern (T1.0-T4.5), shear pattern (T1.5–T3.5), central dense overcast (CDO) pattern (T2.5–T5.0), central cold cover (CCC) pattern, banding eye pattern (T4.0–T4.5), and eye pattern (T4.5–T8.0).

<span class="mw-page-title-main">Tropical cyclone</span> Rapidly rotating storm system

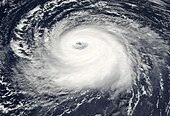
A tropical cyclone is a rapidly rotating storm system with a low-pressure center, a closed low-level atmospheric circulation, strong winds, and a spiral arrangement of thunderstorms that produce heavy rain and squalls. Depending on its location and strength, a tropical cyclone is called a hurricane, typhoon, tropical storm, cyclonic storm, tropical depression, or simply cyclone. A hurricane is a strong tropical cyclone that occurs in the Atlantic Ocean or northeastern Pacific Ocean, and a typhoon occurs in the northwestern Pacific Ocean. In the Indian Ocean and South Pacific, comparable storms are referred to as "tropical cyclones". In modern times, on average around 80 to 90 named tropical cyclones form each year around the world, over half of which develop hurricane-force winds of 65 kn or more. Tropical cyclones carry heat away from the tropics and transport it towards temperate latitudes. This plays an important role in regulating global climate. Tropical cyclones can be very harmful for people.

<span class="mw-page-title-main">Tropical cyclone basins</span> Areas of tropical cyclone formation

Traditionally, areas of tropical cyclone formation are divided into seven basins. These include the north Atlantic Ocean, the eastern and western parts of the northern Pacific Ocean, the southwestern Pacific, the southwestern and southeastern Indian Oceans, and the northern Indian Ocean. The western Pacific is the most active and the north Indian the least active. An average of 86 tropical cyclones of tropical storm intensity form annually worldwide, with 47 reaching hurricane/typhoon strength, and 20 becoming intense tropical cyclones, super typhoons, or major hurricanes.

<span class="mw-page-title-main">Tropical cyclone forecasting</span> Science of forecasting how a tropical cyclone moves and its effects

Tropical cyclone forecasting is the science of forecasting where a tropical cyclone's center, and its effects, are expected to be at some point in the future. There are several elements to tropical cyclone forecasting: track forecasting, intensity forecasting, rainfall forecasting, storm surge, tornado, and seasonal forecasting. While skill is increasing in regard to track forecasting, intensity forecasting skill remains unchanged over the past several years. Seasonal forecasting began in the 1980s in the Atlantic basin and has spread into other basins in the years since.

<span class="mw-page-title-main">Cold-core low</span> Cyclone with an associated cold pool of air at high altitude

A cold-core low, also known as an upper level low or cold-core cyclone, is a cyclone aloft which has an associated cold pool of air residing at high altitude within the Earth's troposphere, without a frontal structure. It is a low pressure system that strengthens with height in accordance with the thermal wind relationship. If a weak surface circulation forms in response to such a feature at subtropical latitudes of the eastern north Pacific or north Indian oceans, it is called a subtropical cyclone. Cloud cover and rainfall mainly occurs with these systems during the day.

<span class="mw-page-title-main">Glossary of tropical cyclone terms</span>

The following is a glossary of tropical cyclone terms.

<span class="mw-page-title-main">Subtropical Cyclone Katie</span> South Pacific subtropical cyclone in 2015

Subtropical Cyclone Katie, unofficially named by researchers, was an unusual weather event in early 2015. After the 2014–15 South Pacific cyclone season had officially ended, a rare subtropical cyclone was identified outside of the basin near Easter Island, during early May, and was unofficially dubbed Katie by researchers. Katie was one of the few tropical or subtropical systems ever observed forming in the far Southeast Pacific, outside of the official basin boundary of 120°W, which marks the eastern edge of RSMC Nadi's and RSMC Wellington's warning areas, during the satellite era. Due to the fact that this storm developed outside of the official areas of responsibility of the warning agencies in the South Pacific, the storm was not officially included as a part of the 2014–15 South Pacific cyclone season. However, the Chilean Navy Weather Service issued High Seas Warnings on the system as an extratropical low.

The year 1997 was regarded as one of the most intense tropical cyclone years on record, featuring a record 12 category 5-equivalent tropical cyclones, according to the Saffir–Simpson hurricane wind scale. The year also featured the second-highest amount of accumulated cyclone energy (ACE) on record, just behind 1992 and 2018. Throughout the year, 108 tropical cyclones have developed in bodies of water, commonly known as tropical cyclone basins. However, only 89 tropical cyclones were of those attaining 39 mph or greater, falling just below the long term average of 102 named systems. The most active basin was the Western Pacific, attaining an ACE amount of 571, the highest ever recorded in any season in any basin on record. The deadliest tropical cyclone was Severe Tropical Storm Linda (Openg). The costliest tropical cyclone was Super Typhoon Winnie (Ibiang), which set a record for having the largest eye on record. The most intense tropical cyclone was Hurricane Linda, peaking at 902 hPa/mbar. Typhoon Paka (Rubing), the longest-lived system, produced the fourth-highest ACE for a single tropical cyclone, just behind Typhoon Nancy (1961), Hurricane/Typhoon Ioke (2006), and Cyclone Freddy (2023). The accumulated cyclone energy (ACE) index for the 1997, as calculated by Colorado State University was 1,099.2 units.

References

  1. "Definition for Cyclogenesis". Arctic Climatology and Meteorology. National Snow and Ice Data Center. Archived from the original on August 30, 2006. Retrieved October 20, 2006.
  2. Goldenberg, Stan (August 13, 2004). "What is an extra-tropical cyclone?". Frequently Asked Questions: Hurricanes, Typhoons and Tropical Cyclones. Atlantic Oceanographic and Meteorological Laboratory, Hurricane Research Division. Retrieved August 30, 2008.
  3. 1 2 3 4 5 6 7 8 Landsea, Chris. "How do tropical cyclones form?". Frequently Asked Questions. Atlantic Oceanographic and Meteorological Laboratory, Hurricane Research Division. Retrieved October 9, 2017.
  4. Landsea, Christopher. "AOML Climate Variability of Tropical Cyclones paper". Atlantic Oceanographic and Meteorological Laboratory. Retrieved September 23, 2010.
  5. "Madden–Julian Oscillation". UAE. Archived from the original on March 9, 2012. Retrieved September 23, 2010.
  6. Berg, Robbie. "Tropical cyclone intensity in relation to SST and moisture variability" (PDF). RSMAS (University of Miami). Retrieved September 23, 2010.
  7. Chris Landsea (January 4, 2000). "Climate Variability table — Tropical Cyclones". Atlantic Oceanographic and Meteorological Laboratory, National Oceanic and Atmospheric Administration . Retrieved October 19, 2006.
  8. Matt Menne (March 15, 2000). "Global Long-term Mean Land and Sea Surface Temperatures". National Climatic Data Center. Archived from the original on December 19, 2002. Retrieved October 19, 2006.
  9. Kushnir, Yochanan. "The Climate System". EESC. Retrieved September 24, 2010.
  10. John M. Wallace & Peter V. Hobbs (1977). Atmospheric Science: An Introductory Survey. Academic Press, Inc. pp. 76–77.
  11. Chris Landsea (2000). "Climate Variability of Tropical Cyclones: Past, Present and Future". Storms. Atlantic Oceanographic and Meteorological Laboratory. pp. 220–41. Retrieved October 19, 2006.
  12. Dian J. Gaffen-Seidel, Rebecca J. Ross and James K. Angell (November 2000). "Climatological characteristics of the tropical tropopause as revealed by radiosondes". National Oceanic and Atmospheric Administration Air Resources Laboratory. Archived from the original on May 8, 2006. Retrieved October 19, 2006.
  13. Lixion Avila (December 3, 2005). "Hurricane Epsilon Discussion Eighteen". National Hurricane Center. Retrieved December 14, 2010.
  14. Kerry A. Emanuel (1998). "Maximum Intensity Estimation". Massachusetts Institute of Technology. Retrieved October 20, 2006.
  15. Department of Atmospheric Sciences (October 4, 1999). "Pressure Gradient Force". University of Illinois at Urbana–Champaign. Retrieved October 20, 2006.
  16. G.P. King (November 18, 2004). "Vortex Flows and Gradient Wind Balance" (PDF). University of Warwick. Archived from the original (PDF) on November 29, 2007. Retrieved October 20, 2006.
  17. Kepert, Jeffrey D. (2010). "Tropical Cyclone Structure and Dynamics" (PDF). In Johnny C.L. Chan, Jeffrey D Kepert (ed.). Global Perspectives on Tropical Cyclones: From Science to Mitigation. Singapore: World Scientific. ISBN   978-981-4293-47-1. Archived from the original (PDF) on June 29, 2011. Retrieved February 2, 2011.
  18. Kieu, Chanh Q. & Da-Lin Zhang (June 2010). "Genesis of Tropical Storm Eugene (2005) from Merging Vortices Associated with ITCZ Breakdowns. Part III: Sensitivity to Various Genesis Parameters". Journal of the Atmospheric Sciences. 67 (6): 1745. Bibcode:2010JAtS...67.1745K. doi:10.1175/2010JAS3227.1. S2CID   55906577.
  19. 1 2 3 Department of Atmospheric Sciences (DAS) (1996). "Hurricanes: a tropical cyclone with winds > 64 knots". University of Illinois at Urbana–Champaign. Retrieved August 9, 2008.
  20. M. E. Nicholls & R. A. Pielke (April 1995). "A Numerical Investigation of the Effect of Vertical Wind Shear on Tropical Cyclone Intensification" (PDF). 21st Conference on Hurricanes and Tropical Meteorology of the American Meteorological Society . Colorado State University. pp. 339–41. Archived from the original (PDF) on September 9, 2006. Retrieved October 20, 2006.
  21. Clark Evans (January 5, 2006). "Favorable trough interactions on tropical cyclones". Flhurricane.com. Retrieved October 20, 2006.
  22. Deborah Hanley; John Molinari & Daniel Keyser (October 2001). "A Composite Study of the Interactions between Tropical Cyclones and Upper-Tropospheric Troughs". Monthly Weather Review . 129 (10): 2570–84. Bibcode:2001MWRv..129.2570H. doi: 10.1175/1520-0493(2001)129<2570:ACSOTI>2.0.CO;2 . ISSN   1520-0493.
  23. Eric Rappin & Michael C. Morgan. "The Tropical Cyclone — Jet Interaction" (PDF). University of Wisconsin, Madison. Archived from the original (PDF) on September 7, 2006. Retrieved October 20, 2006.
  24. 1 2 3 4 5 6 Atlantic Oceanographic and Meteorological Laboratory, Hurricane Research Division. "Frequently Asked Questions: When is hurricane season?". National Oceanic and Atmospheric Administration. Archived from the original on May 6, 2009. Retrieved July 25, 2006.
  25. Kaye, Ken (September 9, 2010). "Peak of hurricane season". Sun Sentinel. Retrieved September 23, 2010.
  26. Chris Landsea (July 13, 2005). "FAQ: Why doesn't the South Atlantic Ocean experience tropical cyclones?". NOAA. Retrieved May 14, 2009.
  27. 1 2 3 4 Hurricane Research Division. "Frequently Asked Questions: What are the average, most, and least tropical cyclones occurring in each basin?". National Oceanic and Atmospheric Administration's Atlantic Oceanographic and Meteorological Laboratory. Retrieved December 5, 2012.
  28. "Report on Cyclonic Disturbances Over North Indian Ocean During 2018" (PDF). Archived from the original (PDF) on May 11, 2020.
  29. RA I Tropical Cyclone Committee (November 9, 2012). Tropical Cyclone Operational Plan for the South-West Indian Ocean: 2012 (PDF) (Report No. TCP-12). World Meteorological Organization. pp. 11–14. Archived (PDF) from the original on March 29, 2015. Retrieved March 29, 2015.
  30. "Australian Tropical Cyclone Outlook for 2019 to 2020". Australian Bureau of Meteorology. October 11, 2019. Archived from the original on October 14, 2019. Retrieved October 14, 2019.
  31. 2019–20 Tropical Cyclone Season Outlook [in the] Regional Specialised Meteorological Centre Nadi – Tropical Cyclone Centre (RSMC Nadi – TCC) Area of Responsibility (AOR) (PDF) (Report). Fiji Meteorological Service. October 11, 2019. Archived (PDF) from the original on October 11, 2019. Retrieved October 11, 2019.
  32. James L. Franklin (October 26, 2004). "Hurricane Alex Tropical Cyclone Report". National Hurricane Center . Retrieved October 24, 2006.
  33. "Alberto "Best-track"". Unisys. Archived from the original on January 31, 2008. Retrieved March 31, 2006.
  34. "12" "Best-track". Unisys. Archived from the original on January 31, 2009. Retrieved March 31, 2006.
  35. Evans, Jenni L.; Hart, Robert E. (May 2003). "Objective Indicators of the Life Cycle Evolution of Extratropical Transition for Atlantic Tropical Cyclones". Monthly Weather Review. 131 (5): 911–913. Bibcode:2003MWRv..131..909E. doi:10.1175/1520-0493(2003)131<0909:OIOTLC>2.0.CO;2. S2CID   3744671.
  36. Chang, C.-P.; Liu, C.-H.; Kuo, H.-C. (February 2003). "Typhoon Vamei: An equatorial tropical cyclone formation". Geophysical Research Letters . 30 (3): 1150. Bibcode:2003GeoRL..30.1150C. doi: 10.1029/2002GL016365 . hdl:10945/36685 . Retrieved November 15, 2010.
  37. Tropical Cyclone Guidance for Season 2010/11 for the Fiji and the Southwest Pacific (PDF) (Report). Fiji Meteorological Service. October 26, 2010. Archived (PDF) from the original on May 19, 2024. Retrieved May 19, 2024.
  38. Atlantic Oceanographic and Meteorological Laboratory, Hurricane Research Division. "Frequently Asked Questions: Why doesn't the South Atlantic Ocean experience tropical cyclones?". National Oceanic and Atmospheric Administration . Retrieved July 25, 2006.
  39. Department of Meteorology, e-Education Institute. "Upper-Level Lows". Meteorology 241: Fundamentals of Tropical Forecasting. Pennsylvania State University. Archived from the original on September 7, 2006. Retrieved October 24, 2006.
  40. "Monitoramento – Ciclone tropical na costa gaúcha" (in Portuguese). Brazilian Meteorological Service. March 2010. Archived from the original on March 9, 2010.
  41. Atlantic Oceanographic and Meteorological Laboratory, Hurricane Research Division. "Frequently Asked Questions: What regions around the globe have tropical cyclones and who is responsible for forecasting there?". NOAA . Retrieved July 25, 2006.
  42. 1 2 "Miscellaneous Images". Met Office. Archived from the original on September 29, 2007. Retrieved November 21, 2015.
  43. Groenemeijer, Pieter; Holzer, Alois M. Satellite Based Climatology of (Sub-) Tropical Cyclones in Europe (PDF) (Report). EUMETSAT . Retrieved January 16, 2024.{{cite report}}: Unknown parameter |agency= ignored (help)
  44. Pacific ENSO Update - Quarter 1, 1998. Pacific ENSO Update (Report). Vol. 4. The Pacific ENSO Applications Climate Centre. Archived from the original on March 4, 2016.
  45. Diamond, Howard J (August 25, 2015). "Review of the 2014/15 Tropical Cyclone Season in the Southwest Pacific Ocean Basin". Climate Program Office. National Oceanic and Atmospheric Administration. Retrieved October 16, 2017.
  46. Jonathan Belles (May 9, 2018). "Extremely Rare Southeast Pacific Subtropical Cyclone Forms Off the Chilean Coast". The Weather Channel. Retrieved May 10, 2018.
  47. Steve Young (July 5, 2018). "Monthly Global Tropical Cyclone Tracks - May 2018". Australia Severe Weather. Retrieved September 3, 2018.
  48. "South American Forecast Discussion". Weather Prediction Center . January 12, 2022. Archived from the original on January 15, 2022. Retrieved January 15, 2022.
  49. "South American Forecast Discussion". Weather Prediction Center . January 13, 2022. Archived from the original on January 15, 2022. Retrieved January 15, 2022.
  50. Todd Miner; Peter J. Sousounis; James Wallman & Greg Mann (February 2000). "Hurricane Huron". Bulletin of the American Meteorological Society. 81 (2): 223–36. Bibcode:2000BAMS...81..223M. doi: 10.1175/1520-0477(2000)081<0223:HH>2.3.CO;2 .
  51. "Climate Change 2007: Working Group I: The Physical Science Basis". IPCC. 2007. Archived from the original on November 2, 2018. Retrieved October 9, 2017.
  52. Avila, Lixion A.; Pasch, Richard J. (March 1995). "Atlantic Tropical Systems of 1993". Monthly Weather Review. 123 (3): 893. Bibcode:1995MWRv..123..887A. doi: 10.1175/1520-0493(1995)123<0887:ATSO>2.0.CO;2 . ISSN   1520-0493.
  53. 1 2 Chan, J. C. L. (April 1985). "Tropical Cyclone Activity in the Northwest Pacific in Relation to the El Niño/Southern Oscillation Phenomenon". Monthly Weather Review . 113 (4): 599–606. Bibcode:1985MWRv..113..599C. doi: 10.1175/1520-0493(1985)113<0599:TCAITN>2.0.CO;2 . hdl:10945/45699. ISSN   1520-0493.
  54. Bureau of Meteorology Research Centre. "ENSO Relationships with Seasonal Tropical Cyclone Activity". Global Guide to Tropical Cyclone Forecasting. Australian Bureau of Meteorology. Archived from the original on November 27, 2012. Retrieved October 20, 2006.
  55. Camargo, Suzana J.; Adam H. Sobel (August 2005). "Western North Pacific Tropical Cyclone Intensity and ENSO". Journal of Climate . 18 (15): 2996. Bibcode:2005JCli...18.2996C. doi: 10.1175/JCLI3457.1 . S2CID   14609267.
  56. John Molinari & David Vollaro (September 2000). "Planetary- and Synoptic-Scale Influences on Eastern Pacific Tropical Cyclogenesis". Monthly Weather Review . 128 (9): 3296–307. Bibcode:2000MWRv..128.3296M. doi: 10.1175/1520-0493(2000)128<3296:PASSIO>2.0.CO;2 . ISSN   1520-0493. S2CID   9278279.
  57. Maloney, E. D. & D. L. Hartmann (September 2001). "The Madden–Julian Oscillation, Barotropic Dynamics, and North Pacific Tropical Cyclone Formation. Part I: Observations". Journal of the Atmospheric Sciences . 58 (17): 2545–2558. Bibcode:2001JAtS...58.2545M. CiteSeerX   10.1.1.583.3789 . doi:10.1175/1520-0469(2001)058<2545:TMJOBD>2.0.CO;2. ISSN   1520-0469. S2CID   35852730.
  58. Kelly Lombardo. "Influence of Equatorial Rossby Waves on Tropical Cyclogenesis in the Western Pacific" (PDF). State University of New York at Albany. Retrieved October 20, 2006.
  59. 1 2 Philip J. Klotzbach; Willam Gray & Bill Thornson (October 3, 2006). "Extended Range Forecast of Atlantic Seasonal Hurricane Activity and U.S. Landfall Strike Probability for 2006". Colorado State University. Retrieved October 20, 2006.
  60. Mark Saunders & Peter Yuen. "Tropical Storm Risk Group Seasonal Predictions". Tropical Storm Risk. Archived from the original on May 4, 2006. Retrieved October 20, 2006.