In meteorology, a cyclone is a large air mass that rotates around a strong center of low atmospheric pressure, counterclockwise in the Northern Hemisphere and clockwise in the Southern Hemisphere as viewed from above. Cyclones are characterized by inward-spiraling winds that rotate about a zone of low pressure. The largest low-pressure systems are polar vortices and extratropical cyclones of the largest scale. Warm-core cyclones such as tropical cyclones and subtropical cyclones also lie within the synoptic scale. Mesocyclones, tornadoes, and dust devils lie within the smaller mesoscale.
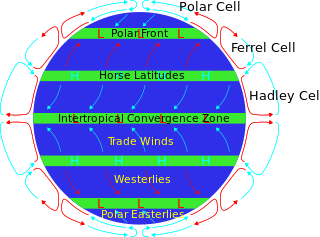
The horse latitudes are the latitudes about 30 degrees north and south of the Equator. They are characterized by sunny skies, calm winds, and very little precipitation. They are also known as subtropical ridges or highs. It is a high-pressure area at the divergence of trade winds and the westerlies.

An anticyclone is a weather phenomenon defined as a large-scale circulation of winds around a central region of high atmospheric pressure, clockwise in the Northern Hemisphere and counterclockwise in the Southern Hemisphere as viewed from above. Effects of surface-based anticyclones include clearing skies as well as cooler, drier air. Fog can also form overnight within a region of higher pressure.

The Intertropical Convergence Zone, known by sailors as the doldrums or the calms because of its monotonous windless weather, is the area where the northeast and the southeast trade winds converge. It encircles Earth near the thermal equator though its specific position varies seasonally. When it lies near the geographic Equator, it is called the near-equatorial trough. Where the ITCZ is drawn into and merges with a monsoonal circulation, it is sometimes referred to as a monsoon trough.

In meteorology, a low-pressure area, low area or low is a region where the atmospheric pressure is lower than that of surrounding locations. Low-pressure areas are commonly associated with inclement weather, while high-pressure areas are associated with lighter winds and clear skies. Winds circle anti-clockwise around lows in the northern hemisphere, and clockwise in the southern hemisphere, due to opposing Coriolis forces. Low-pressure systems form under areas of wind divergence that occur in the upper levels of the atmosphere (aloft). The formation process of a low-pressure area is known as cyclogenesis. In meteorology, atmospheric divergence aloft occurs in two kinds of places:

In meteorology, the synoptic scale is a horizontal length scale of the order of 1,000 km (620 mi) or more. This corresponds to a horizontal scale typical of mid-latitude depressions. Most high- and low-pressure areas seen on weather maps are synoptic-scale systems, driven by the location of Rossby waves in their respective hemisphere. Low-pressure areas and their related frontal zones occur on the leading edge of a trough within the Rossby wave pattern, while high-pressure areas form on the back edge of the trough. Most precipitation areas occur near frontal zones. The word synoptic is derived from the Ancient Greek word συνοπτικός (sunoptikós), meaning "seen together".

The westerlies, anti-trades, or prevailing westerlies, are prevailing winds from the west toward the east in the middle latitudes between 30 and 60 degrees latitude. They originate from the high-pressure areas in the horse latitudes and trend towards the poles and steer extratropical cyclones in this general manner. Tropical cyclones which cross the subtropical ridge axis into the westerlies recurve due to the increased westerly flow. The winds are predominantly from the southwest in the Northern Hemisphere and from the northwest in the Southern Hemisphere.
A pressure system is a peak or lull in the sea level pressure distribution. The surface pressure at sea level varies minimally, with the lowest value measured 87 kilopascals (26 inHg) and the highest recorded 108.57 kilopascals (32.06 inHg). High- and low-pressure systems evolve due to interactions of temperature differentials in the atmosphere, temperature differences between the atmosphere and water within oceans and lakes, the influence of upper-level disturbances, as well as the amount of solar heating or radiationized cooling an area receives. Pressure systems cause weather to be experienced locally. Low-pressure systems are associated with clouds and precipitation that minimize temperature changes throughout the day, whereas high-pressure systems normally associate with dry weather and mostly clear skies with larger diurnal temperature changes due to greater radiation at night and greater sunshine during the day. Pressure systems are analyzed by those in the field of meteorology within surface weather maps.
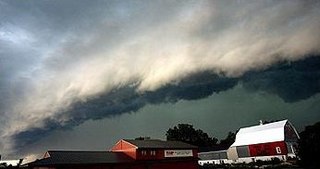
A mesoscale convective system (MCS) is a complex of thunderstorms that becomes organized on a scale larger than the individual thunderstorms but smaller than extratropical cyclones, and normally persists for several hours or more. A mesoscale convective system's overall cloud and precipitation pattern may be round or linear in shape, and include weather systems such as tropical cyclones, squall lines, lake-effect snow events, polar lows, and mesoscale convective complexes (MCCs), and generally forms near weather fronts. The type that forms during the warm season over land has been noted across North and South America, Europe, and Asia, with a maximum in activity noted during the late afternoon and evening hours.

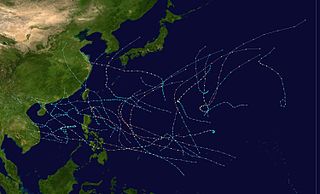
The 1996 Pacific typhoon season was a relatively active season, producing 30 tropical storms, 16 typhoons and six super typhoons. It has no official bounds; it ran year-round in 1996, but most tropical cyclones tend to form in the northwestern Pacific Ocean between May and November. These dates conventionally delimit the period of each year when most tropical cyclones form in the northwestern Pacific Ocean. However the first named storm, Ann, did not develop until April 3. The final named storm, Greg, dissipated on December 27.

The 1994 Pacific typhoon season was an extremely active season in the annual cycle of tropical cyclone formation in the Western North Pacific, being the second most active season in the basin, only behind 1964. With a total of 36 tropical storms, where 20 of them reached typhoon strength and 6 further strengthening into super typhoons, during the course of the season, much like the Pacific hurricane season. The season had no official bounds and it ran year-round in 1994, but most tropical cyclones tend to form in the northwestern Pacific Ocean between May and November. Tropical storms that formed west of the date line were assigned a name by the Joint Typhoon Warning Center. The World Meteorological Organization-designated Regional Specialized Meteorological Centre for tropical cyclones for the region is the Japan Meteorological Agency. Tropical depressions that entered or formed in the Philippine area of responsibility were assigned a name by the Philippine Atmospheric, Geophysical and Astronomical Services Administration or PAGASA. This can result in some storms having two names.

The 1985 Pacific typhoon season was a slightly above average season in terms of named storms, though most storms were weak and short-lived. The season had 28 named storms, 15 typhoons and 1 super typhoon. It ran year-round, thus ending the two-season run which began in 1983 that only had tropical cyclones forming between June and December. These dates conventionally delimit the period of each year when most tropical cyclones form in the northwestern Pacific Ocean. A total of 57 tropical depressions formed this year, of which only 28 became tropical storms and were assigned a name by the Joint Typhoon Warning Center. This made the season well above average. Additionally, tropical depressions that enter or form in the Philippine area of responsibility were assigned a name by the Philippine Atmospheric, Geophysical and Astronomical Services Administration or PAGASA. This can often result in the same storm having two names. This year, a total of 17 storms were named this way.
The 1984 Pacific typhoon season had the second-latest start in the basin on record, only behind the previous year, 1983, by one day. Despite this, it was above average in terms of named storms and featured many intense storms. It ran year-round in 1984, but again all tropical cyclones formed between June and December. These dates conventionally delimit the period of each year when most tropical cyclones form in the northwestern Pacific Ocean. A total of 44 tropical depressions formed this year, of which only 27 became tropical storms and were assigned a name by the Joint Typhoon Warning Center. This made the season above average when compared to the long term mean of 25 storms per season. Additionally, tropical depressions that enter or form in the Philippine area of responsibility are assigned a name by the Philippine Atmospheric, Geophysical and Astronomical Services Administration or PAGASA. This can often result in the same storm having two names. This year, a total of 20 storms were named this way.

The 1982 Pacific typhoon season was an average season in terms of total tropical storms, though it featured a very high amount of typhoons. It ran year-round in 1982, but most tropical cyclones formed between June and December. These dates conventionally delimit the period of each year when most tropical cyclones form in the northwestern Pacific Ocean. A total of 37 tropical depressions formed this year, of which 25 became tropical storms and were assigned a name by the Joint Typhoon Warning Center. Additionally, tropical depressions that enter or form in the Philippine area of responsibility are assigned a name by the Philippine Atmospheric, Geophysical and Astronomical Services Administration or PAGASA. This can often result in the same storm having two names. This year, a total of 23 storms were named this way.

The 1981 Pacific typhoon season was a slightly above average season that produced 29 tropical storms, 13 typhoons and two intense typhoons. The season ran throughout 1981, though most tropical cyclones typically develop between May and October. The season's first named storm, Freda, developed on March 12 while the final storm, Lee, dissipated on December 29. Tropical cyclones only accounted for 12 percent of the rainfall in Hong Kong this season, the lowest percentage for the protectorate since 1972.
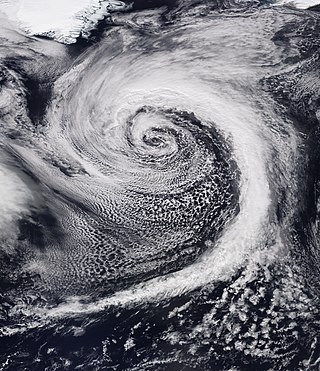
Extratropical cyclones, sometimes called mid-latitude cyclones or wave cyclones, are low-pressure areas which, along with the anticyclones of high-pressure areas, drive the weather over much of the Earth. Extratropical cyclones are capable of producing anything from cloudiness and mild showers to severe gales, thunderstorms, blizzards, and tornadoes. These types of cyclones are defined as large scale (synoptic) low pressure weather systems that occur in the middle latitudes of the Earth. In contrast with tropical cyclones, extratropical cyclones produce rapid changes in temperature and dew point along broad lines, called weather fronts, about the center of the cyclone.

The 2002–03 South Pacific cyclone season was the most active and longest tropical cyclone season since 1997–98, with ten tropical cyclones occurring within the South Pacific basin between 160°E and 120°W. The season started earlier than normal, with two systems developing before the official start of the season on November 1, 2002, while the final system dissipated on June 9, 2003, after the season had officially ended on April 30. During the season, tropical cyclones were officially monitored by the Regional Specialized Meteorological Centre (RSMC) in Nadi, Fiji and the Tropical Cyclone Warning Centres in Brisbane, Australia and Wellington, New Zealand. The United States Armed Forces through the Joint Typhoon Warning Center (JTWC), also monitored the basin and issued unofficial warnings for American interests. RSMC Nadi attaches a number and an F suffix to tropical disturbances that occur within the basin, while the JTWC designates significant tropical cyclones with a number and a P suffix. RSMC Nadi, TCWC Wellington and TCWC Brisbane all use the Australian Tropical Cyclone Intensity Scale and estimate windspeeds over a ten-minute period, while the JTWC estimates sustained winds over a one-minute period, which are subsequently compared to the Saffir–Simpson Hurricane Scale (SSHS).

An upper tropospheric cyclonic vortex is a vortex, or a circulation with a definable center, that usually moves slowly from east-northeast to west-southwest and is prevalent across Northern Hemisphere's warm season. Its circulations generally do not extend below 6,080 metres (19,950 ft) in altitude, as it is an example of a cold-core low. A weak inverted wave in the easterlies is generally found beneath it, and it may also be associated with broad areas of high-level clouds. Downward development results in an increase of cumulus clouds and the appearance of circulation at ground level. In rare cases, a warm-core cyclone can develop in its associated convective activity, resulting in a tropical cyclone and a weakening and southwest movement of the nearby upper tropospheric cyclonic vortex. Symbiotic relationships can exist between tropical cyclones and the upper level lows in their wake, with the two systems occasionally leading to their mutual strengthening. When they move over land during the warm season, an increase in monsoon rains occurs.

Earth rainfall climatology Is the study of rainfall, a sub-field of meteorology. Formally, a wider study includes water falling as ice crystals, i.e. hail, sleet, snow. The aim of rainfall climatology is to measure, understand and predict rain distribution across different regions of planet Earth, a factor of air pressure, humidity, topography, cloud type and raindrop size, via direct measurement and remote sensing data acquisition. Current technologies accurately predict rainfall 3–4 days in advance using numerical weather prediction. Geostationary orbiting satellites gather IR and visual wavelength data to measure realtime localised rainfall by estimating cloud albedo, water content, and the corresponding probability of rain.

The following is a glossary of tropical cyclone terms.