Routine flaring

Last updated

Production flaring at a crude oil extraction sites offshore from Vietnam in the South China Sea. An oil rig offshore Vungtau.jpg
Production flaring at a crude oil extraction sites offshore from Vietnam in the South China Sea.

Routine flaring, also known as production flaring, is a method and current practice of disposing of large unwanted amounts of associated petroleum gas (APG) during crude oil extraction. The gas is first separated from the liquids and solids downstream of the wellhead, then released into a flare stack and combusted into Earth's atmosphere (usually in an open diffusion flame). Where performed, the unwanted gas (mostly natural gas dominated by methane) has been deemed unprofitable, and may be referred to as stranded gas, flare gas, or simply as "waste gas". Routine flaring is not to be confused with safety flaring, maintenance flaring, or other flaring practices characterized by shorter durations or smaller volumes of gas disposal. [1] :1 [2]

Contents

Over 145 billion cubic metres (5 trillion cubic feet) of natural gas is estimated to have been flared worldwide during year 2018. [3] The majority of this was routinely flared APG at thousands of well sites, and is a waste amount equal to the natural gas usage of South and Central America. The largest seven practitioners since 2014 are Russia, Iraq, Iran, the United States, Algeria, Venezuela and Nigeria. [4] Activity in remote regions of Russia is greatest, with political conflict elevating the levels in other countries. The U.S. contributed nearly 10% of the 2018 world total. [5]

Routine flaring, along with intentional gas venting and unintentional fugitive gas emissions, have profound negative consequences. The wasting of a primary resource provides no present economic or future wealth benefits, while creating liabilities through the build up of greenhouse gases and other harmful pollutants in the biosphere. [6] [7] With most forecasts showing oil and gas use increasing into the foreseeable future, the World Bank in 2002 launched the international Global Gas Flaring Reduction Partnership (GGFRP); a public-private partnership with the aim of retiring the wasteful practice. [8] In 2015, it further launched the Zero Routine Flaring by 2030 Initiative; endorsed by 32 countries, 37 companies, and 15 banking institutions by the end of 2019. [9] Endorsers based in the U.S. were the U.S. Federal Government, the State of California, and the World Bank. Global data spanning 1996-2018 indicate that flared gas volumes fell 10%, while oil production rose 40%. [10]

Causes

Production flaring (image centre) at a rural crude oil extraction site in North Dakota. Looking S at gas flare at dawn 002 - near Arnegard North Dakota - 2013-07-07.jpg
Production flaring (image centre) at a rural crude oil extraction site in North Dakota.
A night image from space that captures the widespread practice of routine flaring across southeast Texas. The broad arc of scattered lights extending up and left from the lower centre is defined by hundreds of gas flares from rural oil wells in the Eagle Ford Group south of San Antonio. Image taken from International Space Station, February 2015. ISS-42 Texas and the Gulf Coast at night.jpg
A night image from space that captures the widespread practice of routine flaring across southeast Texas. The broad arc of scattered lights extending up and left from the lower centre is defined by hundreds of gas flares from rural oil wells in the Eagle Ford Group south of San Antonio. Image taken from International Space Station, February 2015.

The routine flaring and venting of APG has been practised since the first oil wells were commercialized in the late 1850s. Although liquid and gas hydrocarbons have similar energy densities by mass, the factor of 1000 greater energy content by volume of liquid fuels makes storage and transport more economical. [11] Widespread means for overcoming this relative disadvantage of petroleum gas have only been realized within the last several decades. For example, transcontinental gas pipelines, linked with regional collection and distribution networks, now spread throughout much of the world. [12] Flare Gas Recovery Systems (FGRS) for processing APG into liquid or compressed fuels at the wellpad have also become increasingly mobile and varied in their capabilities. [1] :50

The decision processes leading to wasting of APG in modern times depend greatly upon regional circumstances. Generally, the near-term financial and risk management objectives of decision makers will determine the outcome. Some form of permitting or other regulation of flaring and venting activity exists in most jurisdictions, but details vary widely. [1] :20 [13] :7 Factors that can increase wasting activity include (not an exhaustive list):

Year 2018 statistics

In 2018, 100 million tonnes (145 billion cubic metres) of associated gas was flared throughout the world, representing about 3-4% of all gas produced from both oil and gas wells. [18] The waste yielded nearly 350 million tons of CO2 equivalent emissions of greenhouse gases, or about 1% of the 33 billion tons of carbon dioxide (CO2) released from all burning of all fossil fuels. [19] The buildup of these gases is substantially disrupting the planetary carbon cycle, and broader international efforts are ongoing to assess the extent of the damage and quantify the accumulating economic costs. [20]

The costs to eliminate flaring are better understood and vary widely between instances. The World Bank estimates the total mitigation cost at US$100 billion. [18] If brought to the natural gas market in a developed economy such as that in the United States, the flared gas could supply about 17% of the 30 trillion cubic feet of U.S. consumption, [21] and potentially be valued at nearly US$20 billion. [18] In less developed nations, the benefits could have a further effect. For example, it could supply all current usage throughout South and Central America. If used to generate 750 billion kWh of electricity, it could supply the entire needs of the African continent. [18]

While flaring is wasteful and produces harmful byproducts like other burning of fossil fuels, it is less disruptive in the near term than venting the associated gas which consists primarily of methane. The buildup of atmospheric methane is responsible for about 25% of the changes in climate forcing, despite its nearly 100x lower abundance compared to CO2. [22] According to the International Energy Agency, at least [23] [24] 75 million tons of methane was released by the oil and gas industry through venting and fugitive emissions, and an estimated 4 million tons was released through flaring inefficiencies. [25] The use of fossil fuels by humans is responsible for about 20% of all methane emissions, [26] and those from the oil and gas industry are responsible for about 25% of all anthropogenic sources. [22] These sources are also in need of more extensive tracking and mitigation efforts since natural gas is projected to continue to be the most rapidly growing supply of global primary energy. [27]

Alternatives

A mobile natural gas-fired power plant in Crimea. Mobile natural gas-fired power plant in Crimea.jpg
A mobile natural gas-fired power plant in Crimea.
A modular, portable GTL plant outside Houston Texas. Design capacity is 100 barrels/day. INFRA M100 GTL Plant.jpg
A modular, portable GTL plant outside Houston Texas. Design capacity is 100 barrels/day.
A Bitcoin mining farm powered by an adjacent upstream gas facility in Alberta Canada. Hut 8 Medicine Hat aerial 1.jpg
A Bitcoin mining farm powered by an adjacent upstream gas facility in Alberta Canada.

Similar to crude oil, APG is a primary energy source of both gaseous fuel and liquid fuel commodities that have high intrinsic value in the modern world economy. [28] After APG is extracted, the remaining logistical barriers to consumption are cost-effective refinement and delivery to consumer markets. Flaring and venting alternatives preferred by the oil companies include those which remove these barriers for associated gas without impeding production of higher value oil. [1] :55

Traditional uses

Global data from year 2012 indicates that 15% of all associated gas was flared or vented, while 85% was utilized or saved for the following economic benefits: [18]

1. re-injection into the oil reservoir for secondary recovery, tertiary recovery, and/or longer-term storage. [29] :542 (58%)
2. transmission to a trading hub for distribution to short-term storage and refinery markets. (27%)

Other uses

The following list includes other existing commercially viable alternatives to routine flaring and venting that can be performed on-site or nearby:

1. liquid fuels production with Flare Gas Recovery Systems (FGRS) and trucking to consumption markets. [29] :542 [1] :50
a. natural gas liquid (NGL) extraction from the flare stream using mobile equipment.
b. portable compressed natural gas (CNG) production.
c. portable liquefied natural gas (LNG) production.
d. small-scale gas to liquids (GTL) conversion.
2. electricity generation with portable engines or microturbines. [29] :548 [1] :51
3. heat generation for water treatment or other industrial processing at the wellpad. [1] :52

A 2019 report from the U.S. Department of Energy states a likely reason oil companies may be slow to embrace either existing or advanced FGRS technologies is "legal, regulated flaring is the least risky option and does not require learning how to apply new technologies or modifying existing contracts and operating practices." [1] :55

Cryptocurrency "miners" have recently identified flare gas as a potential low-cost source for their energy-intensive computing. A number of partnerships have emerged between these two unusually different miners, with the further aim of minimizing each of their substantial carbon footprints. [30] [31]

Effectiveness

Incomplete gas flaring that vents methane and also creates black carbon at a site in Indonesia. Gas flare, PetroChina Jabung field, Jambi, Indonesia.jpg
Incomplete gas flaring that vents methane and also creates black carbon at a site in Indonesia.

Gas flares using diffusion flames depend primarily on thorough air-gas mixing throughout the ejected gas stream to maximize combustion. The velocity and pressure drop of the gas as it exits the tip of the flare stack must be maintained within optimal ranges to ensure adequate turbulent diffusion. Preserving these ranges are key objectives of the engineering design process and accompanying control strategy. Significant amounts of moisture, nitrogen, carbon dioxide, or other non-hydrocarbons accompanying APG can interfere with combustion. On the other hand, properly designed and controlled injections of hot air and steam can improve combustion and effectiveness. [32] [33]

APG consists primarily of methane along with lesser amounts of ethane, propane, butane, and other alkanes. When a flare is operating effectively, the combustion by-products include primarily water and carbon dioxide, and small amounts of carbon monoxide and nitrous oxides (NoX). Such flares thus demonstrate high conversion efficiency, with only about 2% of APG escaping on average. When a flare is not operating effectively, more substantial amounts of APG can escape, sometimes as high 40%. [18] Also volatile organic compounds (VOCs), toxic compounds, and other damaging pollutants can be created. VOCs and NoX can act to produce ground-level ozone at levels that exceed air quality standards. The presence of smoke indicates a poorly operating flare, [29] :534–537 and the resulting short-lived black carbon can accelerate snow and ice melting. [34] [35]

Most other contaminants in the APG stream occur as trace amounts. They can include toxic elements like mercury and radon that are naturally occurring. Enhanced oil recovery efforts such as hydraulic fracturing may introduce others. The common natural contaminant hydrogen sulfide enables the creation of sulfur dioxide and sulfuric acid in gas flares. [36] At elevated concentrations, it can cause corrosion and other air quality challenges, and result in characterizations such as "sour gas" and "acid flare". As a practical matter, gas streams with higher sulfur contamination levels are more likely to be flared - where allowed - than utilized due to their lower economic value. [17]

Monitoring

NASA's Aqua satellite NASA's Aqua Satellite Celebrates 10th Annivesary (7142186923).jpg
NASA's Aqua satellite
Expansion of flaring activity in Permian Basin of west Texas from 2012 to 2016. VIIRS images from NASA Earth Observatory Permian Flaring 2012-2016.jpg
Expansion of flaring activity in Permian Basin of west Texas from 2012 to 2016. VIIRS images from NASA Earth Observatory

Available global data on gas flaring volumes are highly uncertain and unreliable until about year 1995. Following formation of the GGFR in 2002, participating researchers from NOAA and academic institutions harnessed satellite observations to simplify the data collection and improve measurement accuracy. [37] Despite the scientific and technological advancements, amounts reported by industry participants and used by regulatory officials are still sometimes inaccurate. [38] [39] Quantifying and locating methane emissions from improperly operated flares, intentional gas venting activity, and other equipment methane leaks is also a high priority for the GGFR partnership, the Global Methane Initiative, and other groups that embrace both economic and environmental scope. [40]

Satellite surveys

Since most flares are operated as open flames, volumes can be inferred during aerial surveys by measuring the amount of light emitted. The first set of global data extending back to 1995 were generated in 2006 using Defense Meteorological Satellite Program (DMSP) and Google Earth data. [37] After about 2010, the accuracy of individual measurements was further improved to better than +/- 10% using data from the VIIRS instruments on the NOAA-20 and Suomi NPP satellites, and MODIS instruments on the Aqua and Terra satellites of the NASA Earth Observatory. [41] [42] The data analysis continues to be further refined with contributions from other academic and mission-specific groups. [43] [44] Maps of global activity are now automatically generated with advanced methods such as machine learning, and the inferred volumes adjusted for disturbances such as intermittent cloud cover.

Additional satellites and instruments have, and are scheduled to continue to come online with capability to measure methane and other more powerful greenhouse gases with improving resolution. [40] [45] The Tropomi [46] instrument launched in year 2017 by the European Space Agency can measure methane, sulphur dioxide, nitrogen dioxide, carbon monoxide, aerosol, and ozone concentrations in earth's troposphere at resolutions of several kilometres. [47] [48] [49] The CLAIRE satellite launched in year 2016 by the Canadian firm GHGSat can resolve carbon dioxide and methane to as little as 50 metres (160 ft), thus enabling its customers to pinpoint the source of emissions. [40]

Ground and aerial surveys

Portable instruments from suppliers like FLIR Systems [50] and Picarro [51] are also capable of detecting otherwise invisible leaks and emissions from improperly operating flares. They are somewhat less practical for monitoring methane and other VOC concentrations over extended periods, but can enable industry repair technicians, regulatory officials, and other investigators to locate and document sources of emissions in real time. [52]

Researchers for the Environmental Defense Fund have extensively mapped methane emissions from oil and gas operations in the U.S. Permian Basin spanning years 2019–2020. Their results show emissions at least three times larger than those reported by operators and some degree of malfunctioning of more than 10% of flares. [53] [54] About half of the malfunctioning flare stacks were found to be unlit and releasing their gases with no abatement. [55]

Reduction progress

Global gas flaring and oil production trends (1996-2018) [10]
  Gas flared: Billion Cubic Meters/Year (↓10%)
  Oil produced: Million Barrels/Day (↑40%)
  Population: 100 Million People (↑30%)

The United Nations, [9] International Energy Agency, [56] and World Bank recognize routine flaring reduction efforts as low-hanging fruit in consideration of the substantial economic, environmental, and human-health benefits. The effects are especially large in developing countries where flaring intensity (i.e. gas flared per unit of oil produced) is often higher, due mainly to their less-developed infrastructure and markets for natural gas. Some of the key countries targeted for reductions have included Indonesia, Iraq, Kazakhstan, Mexico, Nigeria, Qatar, and the Khanty-Mansi Autonomous Okrug - Yugra region of Russia. [37]

From 1996 through 2018, a 10% reduction in global flaring volume (measured in cubic metres - m3) was realized while global oil production rose 40% (right figure). [10] It was accompanied by a 35% reduction in global flaring intensity (measured in cubic metres per barrel oil produced - m3/bbl). [57] This was due especially in part to earlier reduction efforts in GGFR partner countries such as Russia and Nigeria. [37] As of 2018, Canada, Brazil, and several Middle East nations flared at intensities below 1 m3/bbl, compared to the global average of 4.1 m3/bbl. Several African nations continue to flare at over 10 m3/bbl, including Cameroon at over 40 m3/bbl. [58]

Just four nations are responsible for nearly 50% of all gas flared: Russia, Iraq, Iran, and the United States. [59] Their flaring intensities range from about 3 to 10 m3/bbl, and have not improved substantially in the last few years. [60] Each country has extensive infrastructure and access to advanced technologies, but also complex business and political cultures that may be more resistant to change.

Growth in the United States

Historical chart of the volumes of gas extracted, flared and vented in the United States. Data from U.S. Energy Information Administration U.S. Gas Extraction, Flaring, and Venting Volumes.jpg
Historical chart of the volumes of gas extracted, flared and vented in the United States. Data from U.S. Energy Information Administration

Reported flaring and venting in the U.S. declined in the decades following World War II, based on data from the U.S. Energy Information Administration. [5] Near the end of the 20th century, it reached lows close to 1.5% of APG extracted, and 0.5% of all gas extracted from both oil and gas wells.

However, since about 2005, gas flaring activity has once again been increasing, as shown in the accompanying charts. 32 states host and regulate gas flaring and/or venting. [61] The largest volume changes since about 1990 have been in the Permian Basin of west Texas and New Mexico, the Bakken Formation of North Dakota, and the Eagle Ford Group of southeast Texas. [62]

Historical chart of the percentages of gas flared and vented in the United States. U.S. Gas Flaring and Venting Percentages.jpg
Historical chart of the percentages of gas flared and vented in the United States.

Gas flaring increased in the United States as measured both by volume and by percentage. In 2018, gas flaring reached nearly 50-year highs, with 500 billion cubic feet of gas flared, which represents 10% of APG being flared. Reports of negative producer prices for natural gas, and of a further doubling of activity in the Permian, drove continued growth in this destructive practice in 2019 in the United States. [16] [63] In 2018–2019, the amount of gas wasted daily in the Permian alone was capable of supplying the residential needs of the entire state of Texas. [64] [65] Five new long-distance gas pipelines from the region are under construction, with the first entering service in Q3 2019, [66] and the others scheduled to come online during 2020–2022. [1] :23

A loosening of U.S. federal regulations starting in 2017 enabled further increases to the waste of APG from both public and private lands. [1] :17–19 These are summarized in a June 2019 report from the U.S. Department of Energy, which identifies the most consequential changes as: [1] :17

1) "the rollback of the ... limits on methane leaked, vented, or flared from oil and gas wells on federal lands"; and
2) "removing the requirement that companies seek out and repair leaks, requirements for reducing emissions from a variety or equipment elements, and requirements that companies prepare plans for minimizing waste before getting drilling permits"

See also

Related Research Articles

<span class="mw-page-title-main">Natural gas</span> Gaseous fossil fuel

Natural gas is a naturally occurring mixture of gaseous hydrocarbons consisting primarily of methane (97%) in addition to various smaller amounts of other higher alkanes. Low levels of trace gases like carbon dioxide, nitrogen, hydrogen sulfide, and helium are also usually present. Methane is colorless and odorless, and the second largest greenhouse gas contributor to global climate change after carbon dioxide. Because natural gas is odorless, odorizers such as mercaptan are commonly added to it for safety so that leaks can be readily detected.

<span class="mw-page-title-main">Steam reforming</span> Method for producing hydrogen and carbon monoxide from hydrocarbon fuels

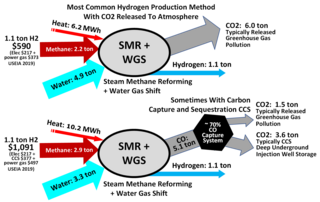
Steam reforming or steam methane reforming (SMR) is a method for producing syngas (hydrogen and carbon monoxide) by reaction of hydrocarbons with water. Commonly natural gas is the feedstock. The main purpose of this technology is hydrogen production. The reaction is represented by this equilibrium:

<span class="mw-page-title-main">Gas stove</span> Type of cooking stove

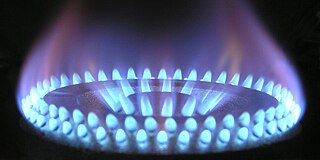
A gas stove is a stove that is fuelled by combustible gas such as natural gas, propane, butane, liquefied petroleum gas, syngas, or other flammable gas. Before the advent of gas, cooking stoves relied on solid fuels such as coal or wood. The first gas stoves were developed in the 1820s and a gas stove factory was established in England in 1836. This new cooking technology had the advantage of being easily adjustable and could be turned off when not in use. The gas stove, however, did not become a commercial success until the 1880s, by which time supplies of piped gas were available in cities and large towns in Britain. The stoves became widespread on the European Continent and in the United States in the early 20th century.

<span class="mw-page-title-main">Fossil fuel power station</span> Facility that burns fossil fuels to produce electricity

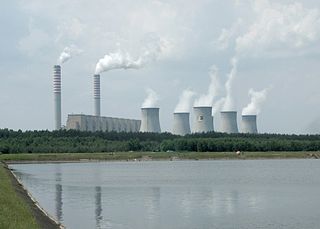
A fossil fuel power station is a thermal power station which burns a fossil fuel, such as coal or natural gas, to produce electricity. Fossil fuel power stations have machinery to convert the heat energy of combustion into mechanical energy, which then operates an electrical generator. The prime mover may be a steam turbine, a gas turbine or, in small plants, a reciprocating gas engine. All plants use the energy extracted from the expansion of a hot gas, either steam or combustion gases. Although different energy conversion methods exist, all thermal power station conversion methods have their efficiency limited by the Carnot efficiency and therefore produce waste heat.

<span class="mw-page-title-main">Landfill gas</span> Gaseous fossil fuel

Landfill gas is a mix of different gases created by the action of microorganisms within a landfill as they decompose organic waste, including for example, food waste and paper waste. Landfill gas is approximately forty to sixty percent methane, with the remainder being mostly carbon dioxide. Trace amounts of other volatile organic compounds (VOCs) comprise the remainder (<1%). These trace gases include a large array of species, mainly simple hydrocarbons.

<span class="mw-page-title-main">Climate change mitigation</span> Actions to reduce net greenhouse gas emissions to limit climate change

Climate change mitigation is action to limit climate change. This action either reduces emissions of greenhouse gases or removes those gases from the atmosphere. The recent rise in global temperature is mostly due to emissions from burning fossil fuels such as coal, oil, and natural gas. There are various ways that mitigation can reduce emissions. These are transitioning to sustainable energy sources, conserving energy, and increasing efficiency. It is possible to remove carbon dioxide from the atmosphere. This can be done by enlarging forests, restoring wetlands and using other natural and technical processes. The name for these processes is carbon sequestration. Governments and companies have pledged to reduce emissions to prevent dangerous climate change. These pledges are in line with international negotiations to limit warming.

<span class="mw-page-title-main">Global Methane Initiative</span>

The Global Methane Initiative (GMI) is a voluntary, international partnership that brings together national governments, private sector entities, development banks, NGOs and other interested stakeholders in a collaborative effort to reduce methane gas emissions and advance methane recovery and use as a clean energy source. National governments are encouraged to join GMI as Partner Countries, while other non-State organizations may join GMI's extensive Project Network. As a public-private initiative, GMI creates an international platform to build capacity, development methane abatement strategies, engage in technology transfer, and remove political and economic barriers to project development for emissions reduction.

<span class="mw-page-title-main">Gas flare</span> Safety device for burning off flammable gas

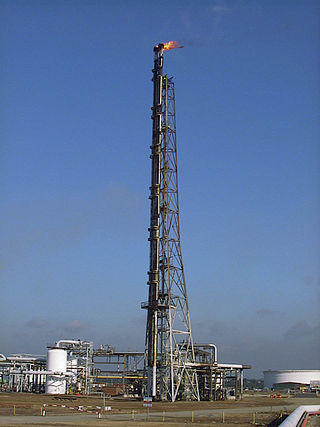
A gas flare, alternatively known as a flare stack, flare boom, ground flare, or flare pit, is a gas combustion device used in places such as petroleum refineries, chemical plants and natural gas processing plants, oil or gas extraction sites having oil wells, gas wells, offshore oil and gas rigs and landfills.

<span class="mw-page-title-main">Gas to liquids</span> Conversion of natural gas to liquid petroleum products

Gas to liquids (GTL) is a refinery process to convert natural gas or other gaseous hydrocarbons into longer-chain hydrocarbons, such as gasoline or diesel fuel. Methane-rich gases are converted into liquid synthetic fuels. Two general strategies exist: (i) direct partial combustion of methane to methanol and (ii) Fischer–Tropsch-like processes that convert carbon monoxide and hydrogen into hydrocarbons. Strategy ii is followed by diverse methods to convert the hydrogen-carbon monoxide mixtures to liquids. Direct partial combustion has been demonstrated in nature but not replicated commercially. Technologies reliant on partial combustion have been commercialized mainly in regions where natural gas is inexpensive.

<span class="mw-page-title-main">Greenhouse gas emissions</span> Sources and amounts of greenhouse gases emitted to the atmosphere from human activities

Greenhouse gas (GHG) emissions from human activities intensify the greenhouse effect. This contributes to climate change. Carbon dioxide, from burning fossil fuels such as coal, oil, and natural gas, is one of the most important factors in causing climate change. The largest emitters are China followed by the United States. The United States has higher emissions per capita. The main producers fueling the emissions globally are large oil and gas companies. Emissions from human activities have increased atmospheric carbon dioxide by about 50% over pre-industrial levels. The growing levels of emissions have varied, but have been consistent among all greenhouse gases. Emissions in the 2010s averaged 56 billion tons a year, higher than any decade before. Total cumulative emissions from 1870 to 2017 were 425±20 GtC from fossil fuels and industry, and 180±60 GtC from land use change. Land-use change, such as deforestation, caused about 31% of cumulative emissions over 1870–2017, coal 32%, oil 25%, and gas 10%.

<span class="mw-page-title-main">Greenhouse gas emissions by the United States</span> Climate changing gases from the North American country

The United States produced 5.2 billion metric tons of carbon dioxide equivalent greenhouse gas (GHG) emissions in 2020, the second largest in the world after greenhouse gas emissions by China and among the countries with the highest greenhouse gas emissions per person. In 2019 China is estimated to have emitted 27% of world GHG, followed by the United States with 11%, then India with 6.6%. In total the United States has emitted a quarter of world GHG, more than any other country. Annual emissions are over 15 tons per person and, amongst the top eight emitters, is the highest country by greenhouse gas emissions per person. However, the IEA estimates that the richest decile in the US emits over 55 tonnes of CO2 per capita each year. Because coal-fired power stations are gradually shutting down, in the 2010s emissions from electricity generation fell to second place behind transportation which is now the largest single source. In 2020, 27% of the GHG emissions of the United States were from transportation, 25% from electricity, 24% from industry, 13% from commercial and residential buildings and 11% from agriculture. In 2021, the electric power sector was the second largest source of U.S. greenhouse gas emissions, accounting for 25% of the U.S. total. These greenhouse gas emissions are contributing to climate change in the United States, as well as worldwide.

Fugitive emissions are leaks and other irregular releases of gases or vapors from a pressurized containment – such as appliances, storage tanks, pipelines, wells, or other pieces of equipment – mostly from industrial activities. In addition to the economic cost of lost commodities, fugitive emissions contribute to local air pollution and may cause further environmental harm. Common industrial gases include refrigerants and natural gas, while less common examples are perfluorocarbons, sulfur hexafluoride, and nitrogen trifluoride.

<span class="mw-page-title-main">Environmental impact of the energy industry</span>

The environmental impact of the energy industry is significant, as energy and natural resource consumption are closely related. Producing, transporting, or consuming energy all have an environmental impact. Energy has been harnessed by human beings for millennia. Initially it was with the use of fire for light, heat, cooking and for safety, and its use can be traced back at least 1.9 million years. In recent years there has been a trend towards the increased commercialization of various renewable energy sources. Scientific consensus on some of the main human activities that contribute to global warming are considered to be increasing concentrations of greenhouse gases, causing a warming effect, global changes to land surface, such as deforestation, for a warming effect, increasing concentrations of aerosols, mainly for a cooling effect.

<span class="mw-page-title-main">Environmental impact of the petroleum industry</span>

The environmental impact of the petroleum industry is extensive and expansive due to petroleum having many uses. Crude oil and natural gas are primary energy and raw material sources that enable numerous aspects of modern daily life and the world economy. Their supply has grown quickly over the last 150 years to meet the demands of the rapidly increasing human population, creativity, knowledge, and consumerism.

<span class="mw-page-title-main">Landfill gas utilization</span>

Landfill gas utilization is a process of gathering, processing, and treating the methane or another gas emitted from decomposing garbage to produce electricity, heat, fuels, and various chemical compounds. After fossil fuel and agriculture, landfill gas is the third largest human generated source of methane. Compared to CO2, methane is 25 times more potent as a greenhouse gas. It is important not only to control its emission but, where conditions allow, use it to generate energy, thus offsetting the contribution of two major sources of greenhouse gases towards climate change. The number of landfill gas projects, which convert the gas into power, went from 399 in 2005 to 519 in 2009 in the United States, according to the US Environmental Protection Agency. These projects are popular because they control energy costs and reduce greenhouse gas emissions. These projects collect the methane gas and treat it, so it can be used for electricity or upgraded to pipeline-grade gas. These projects power homes, buildings, and vehicles.

Associated petroleum gas (APG), or associated gas, is a form of natural gas which is found with deposits of petroleum, either dissolved in the oil or as a free "gas cap" above the oil in the reservoir. The gas can be utilized in a number of ways after processing: sold and included in the natural-gas distribution networks, used for on-site electricity generation with engines or turbines, reinjected for secondary recovery and used in enhanced oil recovery, converted from gas to liquids producing synthetic fuels, or used as feedstock for the petrochemical industry, but much of it worldwide is flared.

Increasing methane emissions are a major contributor to the rising concentration of greenhouse gases in Earth's atmosphere, and are responsible for up to one-third of near-term global heating. During 2019, about 60% of methane released globally was from human activities, while natural sources contributed about 40%. Reducing methane emissions by capturing and utilizing the gas can produce simultaneous environmental and economic benefits.

<span class="mw-page-title-main">Gas venting</span> Disposal of unwanted methane gas from fossil fuels

Gas venting, more specifically known as natural-gas venting or methane venting, is the intentional and controlled release of gases containing alkane hydrocarbons - predominately methane - into Earth's atmosphere. It is a widely used method for disposal of unwanted gases which are produced during the extraction of coal and crude oil. Such gases may lack value when they are not recyclable into the production process, have no export route to consumer markets, or are surplus to near-term demand. In cases where the gases have value to the producer, substantial amounts may also be vented from the equipment used for gas collection, transport, and distribution.

The Oil and Gas Climate Initiative (OGCI), is an international industry-led organization which includes 12 member companies from the oil and gas industry: BP, Chevron, CNPC, Eni, Equinor, ExxonMobil, Occidental, Petrobras, Repsol, Saudi Aramco, Shell and TotalEnergies represent over "30% of global operated oil and gas production." It was established in 2014 and has a mandate to work together to "accelerate the reduction of greenhouse gas emissions" in full support of the Paris Agreement and its aims."

<span class="mw-page-title-main">Environmental effects of bitcoin</span>

The environmental effects of bitcoin are significant. Bitcoin mining, the process by which bitcoins are created and transactions are finalized, is energy-consuming and results in carbon emissions as about half of the electricity used is generated through fossil fuels. As of 2022, bitcoin mining was estimated to be responsible for 0.2% of world greenhouse gas emissions, and to represent 0.4% of global electricity consumption. Moreover, bitcoins are mined on specialized computer hardware with a short lifespan, resulting in electronic waste. The amount of electrical energy required and e-waste generated by bitcoin mining can be compared to countries like Greece or the Netherlands. Bitcoin's environmental impact has attracted the attention of regulators, leading to incentives or restrictions in various jurisdictions.

References

  1. 1 2 3 4 5 6 7 8 9 10 11 12 13 "Natural Gas Flaring and Venting: State and Federal Regulatory Overview, Trends, and Impacts" (PDF). U.S. Department of Energy. 1 June 2019. Retrieved 29 December 2019.
  2. "IPIECA - Resources - Flaring Classification". International Petroleum Industry Environmental Conservation Association (IPIECA). Retrieved 29 December 2019.
  3. 1 2 "Increased Shale Oil Production and Political Conflict Contribute to Increase in Global Gas Flaring". World Bank. 12 June 2019.
  4. "Top 30 Flaring Countries (2014 –2018)" (PDF). World Bank. June 2019.
  5. 1 2 "Natural Gas Gross Withdrawals and Production Data". U.S. Energy Information Administration . Retrieved 28 December 2019.
  6. "Global Gas Flaring Reduction Partnership". World Bank. Retrieved 29 December 2019.
  7. 1 2 Zoheir Ebrahim and Jörg Friedrichs (3 September 2013). "Gas flaring - the burning issue". resilience.org. Retrieved 29 December 2019.
  8. "Global Gas Flaring Reduction Partnership". United Nations . Retrieved 29 December 2019.
  9. 1 2 "UN Climate Initiatives Platform - Zero Routine Flaring by 2030". United Nations . Retrieved 29 December 2019.
  10. 1 2 3 "Global gas flaring and oil production (1996-2018)" (PDF). World Bank. June 2019.
  11. "Fuel energy density". University of Calgary. Retrieved 29 December 2019.
  12. "Global natural gas pipeline network". snam. Retrieved 29 December 2019.
  13. "Regulation of Associate Gas Flaring and Venting: A Global Overview and Lessons from International Experience" (PDF). World Bank. 1 February 2004. Retrieved 31 December 2019.
  14. Linnenluecke, Martina K.; Birt, Jac; Lyon John; Sidhu, Baljit K. (2015), "Planetary boundaries: implications for asset impairment", Accounting & Finance, 55 (4): 911–929, doi: 10.1111/acfi.12173
  15. "US natgas 2020-21 winter futures rise after Kinder delays Permian pipe". Reuters. 17 September 2019. Retrieved 31 December 2019.
  16. 1 2 Scott DiSavino (22 May 2019). "U.S. natural gas prices turn negative in Texas Permian shale again". Reuters. Retrieved 31 December 2019.
  17. 1 2 "Natural gas and the environment". U.S. Energy Information Administration. Retrieved 29 December 2019.
  18. 1 2 3 4 5 6 "Zero Routine Flaring by 2030 Q&A". World Bank. Retrieved 13 March 2020.
  19. "Global Energy & CO2 Status Report 2019: The latest trends in energy and emissions in 2018". International Energy Agency (Paris). 1 March 2019. Retrieved 13 March 2020.
  20. David Cody; et al. (2 May 2019). "Global Fossil Fuel Subsidies Remain Large: An Update Based on Country-Level Estimates". International Monetary Fund. Retrieved 13 March 2020.
  21. "U.S. Natural Gas Total Consumption". U.S. Energy Information Administration . Retrieved 13 March 2020.
  22. 1 2 "Europe Outlines Bold New Climate Vision, While Underscoring Value of Methane Emission Reductions". Environmental Defense Fund. Retrieved 13 March 2020.
  23. Alvarez, R.A.; et al. (13 July 2018). "Assessment of methane emissions from the U.S. oil and gas supply chain". Science. 361 (6398): 186–188. Bibcode:2018Sci...361..186A. doi: 10.1126/science.aar7204 . PMC   6223263 . PMID   29930092.
  24. "Major studies reveal 60% more methane emissions". Environmental Defense Fund. Retrieved 13 March 2020.
  25. "Methane Tracker - Country and regional estimates". International Energy Agency (Paris). 1 November 2019. Retrieved 9 February 2020.
  26. "Methane Tracker - Analysis". International Energy Agency (Paris). 1 November 2019. Retrieved 9 February 2020.
  27. "Tracking Fuel Supply - Methane emissions from oil and gas". International Energy Agency (Paris). 1 November 2019. Retrieved 9 February 2020.
  28. "Natural gas explained". U.S. Energy Information Administration. Retrieved 29 December 2019.
  29. 1 2 3 4 Emam, Eman A. (2015). "Gas Flaring in Industry: An Overview" (PDF). Petroleum and Coal. 57 (5): 532–555.
  30. "How (And Why) Natural Gas Flaring is Being Used to Mine Bitcoin". Oilman Magazine. 15 December 2020.
  31. Naureen S. Malik (16 December 2019). "Why Bitcoin Mining Is Being Touted as a Solution to Gas Flaring". Bloomberg Business News.
  32. John Sorrels, Jeff Coburn, Kevin Bradley, and David Randall (1 August 2019). "EPA - VOC Destruction Controls - Flares" (PDF). U.S. Environmental Protection Agency . Retrieved 31 December 2019.{{cite web}}: CS1 maint: multiple names: authors list (link)
  33. "EPA enforcement targets flaring efficiency violations" (PDF). U.S. Environmental Protection Agency. 1 August 2012. Retrieved 31 December 2019.
  34. Stohl, A.; Klimont, Z.; Eckhardt, S.; Kupiainen, K.; Chevchenko, V.P.; Kopeikin, V.M.; Novigatsky, A.N. (2013), "Black carbon in the Arctic: the underestimated role of gas flaring and residential combustion emissions", Atmos. Chem. Phys., 13 (17): 8833–8855, Bibcode:2013ACP....13.8833S, doi: 10.5194/acp-13-8833-2013 , hdl: 11250/2383886
  35. Michael Stanley (10 December 2018). "Gas flaring: An industry practice faces increasing global attention" (PDF). World Bank. Retrieved 8 February 2020.
  36. "Frequent, routine flaring may cause excessive, uncontrolled sulfur dioxide releases" (PDF). U.S. Environmental Protection Agency. 1 October 2000. Retrieved 31 December 2019.
  37. 1 2 3 4 "GGFR Brochure" (PDF). World Bank. 1 October 2011. Retrieved 18 February 2020.
  38. Colin Leyden (24 January 2019). "Satellite data confirms Permian gas flaring is double what companies report". Environmental Defense Fund. Retrieved 17 February 2020.
  39. Carlos Anchondo (20 February 2019). "Railroad commissioners voice doubts that Permian Basin flaring is more prevalent than reported". Texas Tribune. Retrieved 17 February 2020.
  40. 1 2 3 John Fialka (9 March 2018). "Meet the satellite that can pinpoint methane and carbon dioxide leaks". Scientific American. Retrieved 17 February 2020.
  41. Estimation of Gas Flaring Volumes Using NASA MODIS Fire Detection Products (alternative). Christopher Elvidge et al, NOAA's National Geophysical Data Center (NGDC) annual report, 8 February 2011.
  42. Elvidge, Christopher D.; et al. (2016). "Methods for Global Survey of Natural Gas Flaring from Visible Infrared Imaging Radiometer Suite Data". Energies. 9 (9): 14. doi: 10.3390/en9010014 .
  43. "Earth Observation Group". Colorado School of Mines. Retrieved 18 February 2020.
  44. "Skytruth". skytruth.org . Retrieved 18 February 2020.
  45. "MethaneSAT". methanesat.org. Retrieved 18 February 2020.
  46. "Tropomi". European Space Agency . Retrieved 13 March 2020.
  47. Michelle Lewis (18 December 2019). "New satellite technology reveals Ohio gas leak released 60K tons of methane". Electrek. Retrieved 18 February 2020.
  48. Hiroko Tabuchi (16 December 2019). "A Methane Leak, Seen From Space, Proves to Be Far Larger Than Thought". New York Times. Retrieved 18 February 2020.
  49. Joost A de Gouw; et al. (2020). "Daily Satellite Observations of Methane from Oil and Gas Production Regions in the United States". Scientific Reports. Springer Nature. 10 (10): 1379. Bibcode:2020NatSR..10.1379D. doi: 10.1038/s41598-020-57678-4 . PMC   6987228 . PMID   31992727. S2CID   210938565.
  50. "Infrared Camera for Methane and VOC Detection FLIR GF320". FLIR Systems . Retrieved 18 February 2020.
  51. "G2201-i Isotopic Analyzer". Picaro. Retrieved 13 March 2020.
  52. Matthew Wald (6 August 2013). "New Tools Pinpoint Natural Gas Leaks, Maximizing a Fuel's Green Qualities". New York Times. Retrieved 13 March 2020.
  53. Scott Carpenter (5 May 2020). "Oil Basin in Texas And New Mexico May Be Leaking Much More Methane Than Previously Thought, Findings Show". Forbes. Retrieved 24 August 2020.
  54. Irina Slav (23 July 2020). "1 in 10 gas flares in Permian Malfunction". oilprice.com. Retrieved 24 August 2020.
  55. "Permian Methane Analysis Project". Environmental Defense Fund. Retrieved 24 August 2020.
  56. "Tracking fuel supply - flaring emissions". International Energy Agency. Retrieved 18 February 2020.
  57. "Percentage change in global gas flaring intensity from 1996" (PDF). World Bank. Retrieved 18 February 2020.
  58. "Flaring intensity - top 30 countries - 2014-2018" (PDF). World Bank. Retrieved 18 February 2020.
  59. "Gas flaring volumes 2014-2018" (PDF). World Bank. Retrieved 18 February 2020.
  60. "New ranking - top 30 flaring countries - 2014-2018" (PDF). World Bank. Retrieved 18 February 2020.
  61. "Fact Sheets: Natural Gas Flaring and Venting Regulations by State". USDOE Office of Fossil Energy. Retrieved 5 January 2020.
  62. "Natural gas venting and flaring increased in North Dakota and Texas in 2018". U.S. Energy Information Administration. 6 December 2019. Retrieved 31 December 2019.
  63. Nick Cunningham (14 December 2019). "Emissions Soar As Permian Flaring Frenzy Breaks New Records". Oilprice.com. Retrieved 31 December 2019.
  64. Kevin Crowley and Ryan Collins (10 April 2019). "Oil Producers Are Burning Enough 'Waste' Gas to Power Every Home in Texas". Bloomberg News. Retrieved 31 December 2019.
  65. Hiroko Tabuchi (16 October 2019). "Despite Their Promises, Giant Energy Companies Burn Away Vast Amounts of Natural Gas". New York Times. Retrieved 13 March 2020.
  66. "Gulf Coast Express Pipeline placed in service ahead of schedule". Business Wire. 24 September 2019. Retrieved 31 December 2019.