The climate of Mumbai is tropical, with defined wet and dry seasons. The mean annual temperature is 27.7 °C or 81.9 °F. Average annual rainfall is 2,213.4 millimetres or 87 inches in Colaba, which represents South Mumbai and 2,502.3 millimetres or 99 inches in Santacruz, which represents central and suburban Mumbai. The mean maximum average temperatures is about 32 °C (90 °F) in summer and 30 °C (86 °F) in winter, while the average minimums are 26 °C (79 °F) in summer and 18 °C (64 °F) in winter. The city experiences a lengthy, practically rainless dry season, and a relatively short, but extremely rainy wet season; due to the Southwest Monsoon and orographic influences from the nearby Western Ghats.

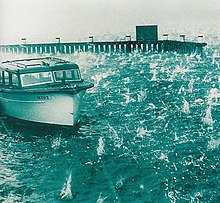
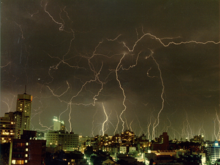
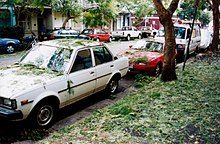
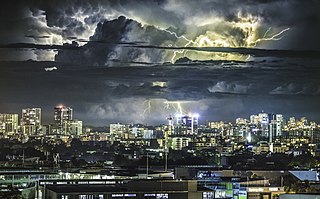
Severe storms in Australia refers to the storms, including cyclones, which have caused severe damage in Australia. For comparison, a comprehensive list of all damaging storms can be found on the Australian Bureau of Meteorology website.
The climate of Sydney, Australia is humid subtropical, shifting from mild and cool in winter to warm and occasionally hot in the summer, with no extreme seasonal differences as the weather is moderated by proximity to the ocean, although more contrasting temperatures are recorded in the inland western suburbs. Despite the fact that there is no distinct dry or wet season, rainfall peaks during summer and autumn months, and is at its lowest just around the middle of the year, though precipitation can be erratic throughout the year. Precipitation varies across the region, with areas adjacent to the coast being the wettest. According to the Bureau of Meteorology, Sydney falls in the temperate climate zone which has warm to hot summers and no dry season. Sydney's plant hardiness zone ranges from zone 11a to 9b throughout the metropolitan area. Under the Holdridge Life Zones classification, eastern Sydney falls in the Subtropical Moist Forest zone and the western suburbs in the Subtropical Dry Forest zone.
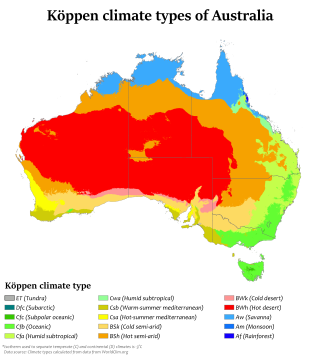
Australia's climate is governed mostly by its size and by the hot, sinking air of the subtropical high pressure belt. This moves north-west and north-east with the seasons. The climate is variable, with frequent droughts lasting several seasons, thought to be caused in part by the El Niño-Southern Oscillation. Australia has a wide variety of climates due to its large geographical size. The largest part of Australia is desert or semi-arid. Only the south-east and south-west corners have a temperate climate and moderately fertile soil. The northern part of the country has a tropical climate, varying between grasslands and desert. Australia holds many heat-related records: the continent has the hottest extended region year-round, the areas with the hottest summer climate, and the highest sunshine duration.
Extreme weather events in Melbourne, Australia have occurred on multiple occasions. The city has experienced a number of highly unusual weather events and extremes of weather. An increase in heat waves and record breaking temperatures in the 21st century has led to much discussion over the effects of climate change in the country.

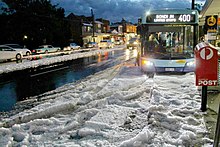
The 2010 Western Australian storms were a series of storms that travelled over southwestern Western Australia on 21 and 22 March 2010. One of the more intense storm cells passed directly over the capital city of Perth between 3:30pm and 5:00pm on Monday 22 March 2010. It is the costliest natural disaster in Western Australian history, with the damage bill estimated at $1.08 billion.

Dubai features a tropical desert, hot arid climate. Dubai has two seasons – winter and summer. Rainfall has been increasing over the past few decades in the city accumulating to more than 130 mm (5.12 in) per year.
Australian rivers have been subject to devastating floods in New South Wales, recorded since colonisation. Flooding in New South Wales has predominately been caused by excessive flows into rivers located in New South Wales and, to a lesser extent, excessive flows into rivers located in Queensland and Victoria. Floods can devastate local communities and impact the entire local economy.

Severe Tropical Cyclone Yasi was a powerful and destructive tropical cyclone that made landfall in northern Queensland, Australia in early 2011, causing major damage to the affected areas. Originating as a tropical low near Fiji on 26 January, the system intensified to tropical cyclone status during the evening of 30 January. Yasi deepened rapidly over the next 24 hours, and was classified as a Category 3 cyclone at about 5 PM AEST on 31 January 2011. Late on 1 February, the cyclone strengthened to a Category 4 system; then, early on 2 February, the cyclone intensified into a Category 5 Severe Tropical Cyclone. The system had a well-defined eye and continued to track west-southwestward, maintaining a central pressure of 930 hPa and a Dvorak intensity of T6.5 into the evening.

Tropical Cyclone Oswald in 2013 was a tropical cyclone that passed over parts of Queensland and New South Wales, Australia over a number of days, causing widespread impact including severe storms, flooding, and water spouts. Coastal regions of Queensland were the most impacted with Mundubbera, Eidsvold, Gayndah and Bundaberg in the Wide Bay–Burnett hit severely. In many places the rainfall total for January set new records. Across the affected region, damage from severe weather and flooding amounted to at least A$2.4 billion.

Australian east coast lows are extratropical cyclones or low-pressure systems on the coast of southeastern Australia that may be caused by both mid-latitude and tropical influences over a variety of levels in the atmosphere.

Severe Tropical Cyclone Christine was the third tropical cyclone and the second severe tropical cyclone of the 2013–14 Australian region cyclone season. It made landfall on Western Australia's Pilbara coast nearly halfway between the major towns of Karratha and Port Hedland as a category 4 cyclone on midnight of 31 December 2013.
Perth, the capital city of the state of Western Australia, has a Mediterranean climate, with hot, dry summers and mild, wet winters. February is the hottest month of the year, with an average high of 31.6 °C (88.9 °F), and July is the coldest month of the year, with an average low of 7.9 °C (46.2 °F). 77% of rain in Perth falls between May and September. Perth has an average of 8.8 hours of sunshine per day, which equates to around 3,200 hours of annual sunshine, and 138.7 clear days annually, making it the sunniest capital city in Australia.

Brisbane has a humid subtropical climate with year-round period with warm to hot temperatures. Brisbane generally experiences 3 months of mild cool winter from June to August.

A black nor'easter is a persistent and potentially violent north-easterly storm that occurs on the east coast of Australia, particularly from southeastern Queensland to southern New South Wales, usually between late spring and early autumn, about two days a year.
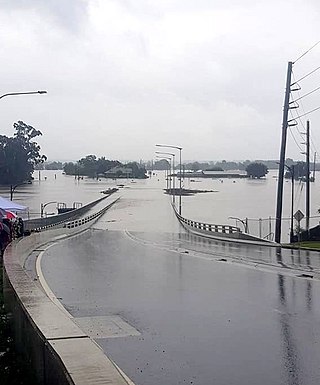
Extreme rainfall on the east coast of Australia beginning on 18 March 2021 led to widespread flooding in New South Wales, affecting regions from the North Coast to the Sydney metropolitan area in the south. Suburbs of Sydney experienced the worst flooding in 60 years, and the events were described by NSW Premier Gladys Berejiklian as "one in 100-year" flooding. Far-southeast communities in Queensland were also affected by flooding and heavy rainfall, though to a lesser extent than those in New South Wales.

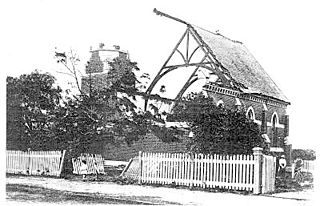
Severe Tropical Cyclone Dinah was an intense tropical cyclone that impacted the southern coasts of Queensland and New South Wales, causing floods and landslides in 1967. It was regarded by an official in the Bureau of Meteorology's Brisbane Tropical Cyclone Warning Centre as the strongest storm to approach the southern coasts of Queensland since reliable records began. Forming on January 22 in the South Pacific basin, nearly 620 kilometers to the southeast of Honiara in the Solomon Islands, the disturbance that would eventually be Dinah remained disorganized until the next day when the system started to organize under the warm waters of the Coral Sea. On January 24, the disturbance was upgraded to a tropical cyclone by the BoM and was named Dinah, being the fifth storm in the records of the meteorology center of Australia in the 1966–67 Australian region cyclone season. Environmental conditions favoured Dinah to further intensify, becoming a severe tropical cyclone on January 27 while recurving south-southwestwards. On the next day, it passed through the Great Barrier Reef as a Category 4 severe tropical cyclone before passing through Fraser Island on January 29, where the Sandy Cape Lighthouse recorded a minimum barometric pressure of 944.8 hPa on Dinah, being the lowest known pressure of the system. It then battered the whole island before turning south-southeastwards, away from the coast of Queensland. Weakening took place while slowing down, passing near Lord Howe Island as a Category 2 tropical cyclone before undergoing extratropical transition on January 31. Dinah became extratropical on the night of that day before accelerating eastward, approaching New Zealand. The system then turned southeastward for the final time before passing through the North Island. It reemerged on the Southern Pacific Ocean on February 3, where it dissipated.

The 2022 eastern Australia floods were one of the nation's worst recorded flood disasters with a series of floods that occurred from late February to early May in South East Queensland, the Wide Bay–Burnett and parts of coastal New South Wales. Brisbane suffered major flooding, along with the cities of Maryborough, Gympie, the Sunshine Coast, Caboolture, Toowoomba, Gatton, Ipswich, Logan City, the Gold Coast, Murwillumbah, Mullumbimby, Grafton, Byron Bay, Ballina, Lismore, the Central Coast and parts of Sydney.

Heavy flooding broke out in the Central Coast and Sydney areas of New South Wales, Australia, beginning in early July 2022. Around 85,000 people were displaced by the flooding or requested to leave their homes by authorities. The floods' damage was significant because rain fell on land that was already saturated after months of previous heavy rainfall. It was the third major flood in 2022 for some areas in the eastern seaboard.

Tropical Cyclone Seth was a strong tropical cyclone whose main impacts came after it degenerated into a remnant low. The eighth tropical low and the fourth tropical cyclone of the 2021–22 Australian region cyclone season, Seth originated from a tropical disturbance in the Timor Sea and caused severe flooding in southeast Queensland and hazardous surf along the southeastern coast of Australia.