Station model

Last updated
Station model as used in the United States plotted on surface weather analyses Station model.gif
Station model as used in the United States plotted on surface weather analyses

In meteorology, station models are symbolic illustrations showing the weather occurring at a given reporting station. Meteorologists created the station model to fit a number of weather elements into a small space on weather maps. This allows map users to analyze patterns in atmospheric pressure, temperature, wind speed and direction, cloud cover, precipitation, and other parameters. [1] The most common station plots depict surface weather observations although upper air plots at various mandatory levels are also frequently depicted.

Contents

Station model plots use an internationally accepted coding convention that has changed little since August 1, 1941. Elements in the plot show the key weather elements, including temperature, dew point, wind, cloud cover, air pressure, pressure tendency, and precipitation. [2] [3]

Measurement location and units

Weather maps primarily use the station model to show surface weather conditions, but the model can also show the weather aloft as reported by a weather balloon's radiosonde or a pilot's report.

Plotted winds

Wind barbs.gif

The station model uses a wind barb to show both wind direction and speed. The wind barb shows the speed using "flags" on the end.

Winds are depicted as blowing from the direction the flags are facing. Therefore, a northeast wind will be depicted with a line extending from the cloud circle to the northeast, with flags indicating wind speed on the northeast end of this line. [5] Once plotted on a map, an analysis of isotachs (lines of equal wind speeds) can be accomplished. Isotachs are particularly useful in diagnosing the location of the jet stream on upper level constant pressure charts, usually at or above the 300 hPa level. [6]

The flags and pennants point to the low pressure, so it is possible to determine at which hemisphere the station is standing. The barbs in the figure at the right are located at the Northern Hemisphere, because the wind is circling counter clock-wise around a low-pressure area at the Northern Hemisphere (the wind is blowing in the opposite direction at the Southern Hemisphere, see also Buys Ballot's law).

More than a century ago, winds were initially plotted as arrows facing downwind, with feathers on both sides of the staff to indicate wind speed. [7] In the United States, the change to the modern convention of flags shown on one side of the staff to indicate wind speed took effect on August 1, 1941. [8] [9]

Cloud cover

Cloud Cover in Oktas.svg

Along with wind direction, cloud cover is one of the oldest atmospheric conditions to be coded on a station model. [7] [8] The circle in the middle of the station model represents cloud cover. In the United Kingdom, when the observation is taken from an automated weather observation site, the shape is a triangle. [10] If the shape is completely filled in, it is overcast. If conditions are completely clear, the circle or triangle is empty. If conditions are partly cloudy, the circle or triangle is partially filled in. [3] The cloud cover shape has different looks depending upon how many oktas (eighths of the sky) are covered by cloud. A sky half full of clouds would have a circle that was half white and half black. Below the shape indicating sky cover, the station model can indicate the coverage of low clouds, in oktas, and the ceiling height in hundreds of feet. The ceiling height is the height at which more than half the sky is covered by clouds.

For pilots, knowledge of the sky cover helps determine if visual flight rules (VFR) are being met. Knowing the degree of cloud cover can help determine whether or not various weather fronts, such as cold fronts or warm fronts, have passed by a location. A nephanalysis, contouring areas that are cloudy with scalloped lines, can be performed to indicate a system's cloud and precipitation pattern. [11] This technique is rarely performed nowadays, due to the prevalence of satellite imagery worldwide. [12]

Cloud types

Cloud classification by altitude of occurrence (towering vertical cumulus congestus not shown) Wolkenstockwerke.png
Cloud classification by altitude of occurrence (towering vertical cumulus congestus not shown)

Above or below the circle for manned stations (automatic stations do not report cloud types) that indicates sky cover can lie one or more symbols indicating cloud types in any of the low, middle, and high-étages for tropospheric clouds. One predominant cloud type may be depicted for each of three étages, if known. The middle and high-étage types are depicted above the sky cover circle of the station model, while the main low-étage cloud type is indicated below the circle. [5] Since the station model has limited room, it makes no special provision for vertical or multi-level clouds that can occupy more than one étage at a particular time. [13] Consequently, cloud genera with significant vertical development may be coded and plotted as low or middle depending on the altitude at which they normally form. Cumulus and cumulonimbus usually form in the low étage of the troposphere and achieve vertical extent by growing upward into the middle or high étage. Conversely, nimbostratus usually forms in the middle étage of the troposphere and becomes vertically developed by growing downward into the low étage. [14] Although the SYNOP code has no separate formal group classification for vertical or multi-level clouds, the observer procedure for selecting numerical codes is designed to give high reporting priority to those genera or species that show significant vertical development.

The symbols used for clouds emulate the cloud shape. Cirrus is indicated by a couple hooks, cumulus are indicated by a mound shape, with cumulonimbus indicated with an upside down trapezoid on top of the cumulus symbol to indicate its anvil. When there is more than one cloud type present per level, the cloud type with the highest priority is included. [15] Knowing the cloud type at various locations can help determine whether or not a weather front has passed by a particular location. A low deck of stratus could indicate a station is still north of a warm front, while thunderstorms can indicate the approach of a squall line or cold front.

Present weather and visibility

Common present weather symbols Weather symbolsNEW2.png
Common present weather symbols

To the left of the cloud shape in the center of the station model is the symbol depicting present weather. The present weather symbol depicts the current weather which normally is obstructing the visibility at the time of observation. The visibility itself is shown as a number, in statute miles in the United States and meters elsewhere, describing how far the observer can see at that time. This number is located to the left of the present weather symbol. [5] For pilots, knowledge of the horizontal visibility helps determine if they are flying through instrument meteorological conditions (IMC), such as foggy or smoky conditions, as well as areas of intense precipitation. Present weather depicted with the station model can include:

Temperature and dew point

To left of center in the station model, the temperature and dew point are plotted. Within the United States on surface weather maps, they are still plotted in degrees Fahrenheit. [5] Otherwise, they will be in units of degrees Celsius. This knowledge is important to meteorologists because when this data is plotted on a map, isotherms and isodrosotherms (lines of equal dew point) are easily analyzed, either by man or machine, which can help determine location of weather fronts.

Sea level pressure and height of pressure surface

On the top right corner of the model for a surface weather map is the pressure, showing the last two integer digits of the pressure in millibars, or hectopascals, along with the first decimal. For instance, if the pressure at a certain location is 999.7 hPa, the pressure portion of the station model will read 997. Although the first digit or two of the pressure is left off, other nearby stations give away whether the pressure starts with a 10 or a 9. Most of the time, choosing first digits that would lead to a value nearest to 1000 works out best. [5] The plotting of this value within the station model allows for the analysis of isobars on weather maps. Within maps which plot data on constant pressure surfaces, the pressure is replaced with the height of the pressure surface. [16]

Pressure tendency

Pressure tendency figures Pressuretrend.gif
Pressure tendency figures

Below the pressure will lie the pressure tendency figure, which indicates the pressure change over the past three hours. The number depicting the pressure change will usually have two digits and indicate the pressure change in 0.1 millibar increments. There are nine different figures which represent the pressure change. A slant angled up and right indicates a steady rise, while a downward slant to the lower right indicates a steady fall. Steady rises can indicate improving conditions and approaching high pressure, and normally occur in the wake of a cold front. Steady falls can indicate deteriorating conditions and an approaching low pressure area, with the largest falls occurring in advance of a surface cyclone and its attendant warm front. [17]

The time of the day must be considered, as there are two natural rises per day (locally around 10 am and 10 pm) and two natural falls per day (locally around 4 am and 4 pm). These daily changes in pressure can mask the movement of pressure systems and fronts past a location. The lowest natural dip in the pressure, in a stagnant weather pattern, occurs around 4 pm while the highest natural peak in pressure occurs around 10 am. [18] Once plotted on a map, the analysis of isallobars (lines of equal pressure change) can be plotted on a map, which can indicate the direction of motion of high and low pressures systems across the map domain. [19]

Past weather symbols Pastweather.gif
Past weather symbols

Past weather

Station models can have past weather plotted within them, which would be located just under the pressure tendency. They indicate the type of weather experienced during the past six hours. The weather types are limited to obstructions of visibility and precipitation. [5]

Animations may depict a time series of station model conditions which is most often used to show recent changes in weather conditions and are useful in nowcasting and forecasting.

See also

Related Research Articles

<span class="mw-page-title-main">Cloud</span> Visible mass of liquid droplets or frozen crystals suspended in the atmosphere

In meteorology, a cloud is an aerosol consisting of a visible mass of miniature liquid droplets, frozen crystals, or other particles suspended in the atmosphere of a planetary body or similar space. Water or various other chemicals may compose the droplets and crystals. On Earth, clouds are formed as a result of saturation of the air when it is cooled to its dew point, or when it gains sufficient moisture from an adjacent source to raise the dew point to the ambient temperature.

<span class="mw-page-title-main">Surface weather analysis</span> Type of weather map

Surface weather analysis is a special type of weather map that provides a view of weather elements over a geographical area at a specified time based on information from ground-based weather stations.

<span class="mw-page-title-main">Air mass</span> Volume of air defined by its temperature and water vapor content

In meteorology, an air mass is a volume of air defined by its temperature and humidity. Air masses cover many hundreds or thousands of square miles, and adapt to the characteristics of the surface below them. They are classified according to latitude and their continental or maritime source regions. Colder air masses are termed polar or arctic, while warmer air masses are deemed tropical. Continental and superior air masses are dry, while maritime and monsoon air masses are moist. Weather fronts separate air masses with different density characteristics. Once an air mass moves away from its source region, underlying vegetation and water bodies can quickly modify its character. Classification schemes tackle an air mass' characteristics, as well as modification.

<span class="mw-page-title-main">Weather map</span> Table of weather elements

A weather map, also known as synoptic weather chart, displays various meteorological features across a particular area at a particular point in time and has various symbols which all have specific meanings. Such maps have been in use since the mid-19th century and are used for research and weather forecasting purposes. Maps using isotherms show temperature gradients, which can help locate weather fronts. Isotach maps, analyzing lines of equal wind speed, on a constant pressure surface of 300 or 250 hPa show where the jet stream is located. Use of constant pressure charts at the 700 and 500 hPa level can indicate tropical cyclone motion. Two-dimensional streamlines based on wind speeds at various levels show areas of convergence and divergence in the wind field, which are helpful in determining the location of features within the wind pattern. A popular type of surface weather map is the surface weather analysis, which plots isobars to depict areas of high pressure and low pressure. Cloud codes are translated into symbols and plotted on these maps along with other meteorological data that are included in synoptic reports sent by professionally trained observers.

<span class="mw-page-title-main">Squall line</span> Line of thunderstorms along or ahead of a cold front

A squall line, or more accurately a quasi-linear convective system (QLCS), is a line of thunderstorms, often forming along or ahead of a cold front. In the early 20th century, the term was used as a synonym for cold front. Linear thunderstorm structures often contain heavy precipitation, hail, frequent lightning, strong straight-line winds, and occasionally tornadoes or waterspouts. Particularly strong straight-line winds can occur where the linear structure forms into the shape of a bow echo. Tornadoes can occur along waves within a line echo wave pattern (LEWP), where mesoscale low-pressure areas are present. Some bow echoes can grow to become derechos as they move swiftly across a large area. On the back edge of the rainband associated with mature squall lines, a wake low can be present, on very rare occasions associated with a heat burst.

<span class="mw-page-title-main">Synoptic scale meteorology</span> 1000-km-order method of measuring weather systems

In meteorology, the synoptic scale is a horizontal length scale of the order of 1000 kilometers or more. This corresponds to a horizontal scale typical of mid-latitude depressions. Most high- and low-pressure areas seen on weather maps are synoptic-scale systems, driven by the location of Rossby waves in their respective hemisphere. Low-pressure areas and their related frontal zones occur on the leading edge of a trough within the Rossby wave pattern, while high-pressure areas form on the back edge of the trough. Most precipitation areas occur near frontal zones. The word synoptic is derived from the Greek word συνοπτικός, meaning seen together.

<span class="mw-page-title-main">Occluded front</span> Meteorological interaction of warm and cool air masses

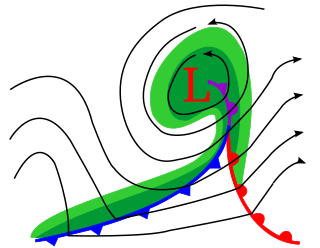
In meteorology, an occluded front is a type of weather front formed during cyclogenesis. The classical and usual view of an occluded front is that it initiates when a cold front overtakes a warm front near a cyclone, such that the warm air is separated (occluded) from the cyclone center at the surface. The point where the warm front becomes the occluded front is the triple point; a new area of low-pressure that develops at this point is called a triple-point low. A more modern view of the formation process suggests that occluded fronts form directly without the influence of other fronts during the wrap-up of the baroclinic zone during cyclogenesis, and then lengthen due to flow deformation and rotation around the cyclone as the cyclone forms.

<span class="mw-page-title-main">Cloud physics</span> Study of the physical processes in atmospheric clouds

Cloud physics is the study of the physical processes that lead to the formation, growth and precipitation of atmospheric clouds. These aerosols are found in the troposphere, stratosphere, and mesosphere, which collectively make up the greatest part of the homosphere. Clouds consist of microscopic droplets of liquid water, tiny crystals of ice, or both. Cloud droplets initially form by the condensation of water vapor onto condensation nuclei when the supersaturation of air exceeds a critical value according to Köhler theory. Cloud condensation nuclei are necessary for cloud droplets formation because of the Kelvin effect, which describes the change in saturation vapor pressure due to a curved surface. At small radii, the amount of supersaturation needed for condensation to occur is so large, that it does not happen naturally. Raoult's law describes how the vapor pressure is dependent on the amount of solute in a solution. At high concentrations, when the cloud droplets are small, the supersaturation required is smaller than without the presence of a nucleus.

<span class="mw-page-title-main">Pressure system</span> Relative peak or lull in the sea level pressure distribution

A pressure system is a peak or lull in the sea level pressure distribution. The surface pressure at sea level varies minimally, with the lowest value measured 87 kilopascals (26 inHg) and the highest recorded 108.57 kilopascals (32.06 inHg). High- and low-pressure systems evolve due to interactions of temperature differentials in the atmosphere, temperature differences between the atmosphere and water within oceans and lakes, the influence of upper-level disturbances, as well as the amount of solar heating or radiationized cooling an area receives. Pressure systems cause weather to be experienced locally. Low-pressure systems are associated with clouds and precipitation that minimize temperature changes throughout the day, whereas high-pressure systems normally associate with dry weather and mostly clear skies with larger diurnal temperature changes due to greater radiation at night and greater sunshine during the day. Pressure systems are analyzed by those in the field of meteorology within surface weather maps.

<span class="mw-page-title-main">Outflow boundary</span> Mesoscale boundary separating outflow from the surrounding air

An outflow boundary, also known as a gust front, is a storm-scale or mesoscale boundary separating thunderstorm-cooled air (outflow) from the surrounding air; similar in effect to a cold front, with passage marked by a wind shift and usually a drop in temperature and a related pressure jump. Outflow boundaries can persist for 24 hours or more after the thunderstorms that generated them dissipate, and can travel hundreds of kilometers from their area of origin. New thunderstorms often develop along outflow boundaries, especially near the point of intersection with another boundary. Outflow boundaries can be seen either as fine lines on weather radar imagery or else as arcs of low clouds on weather satellite imagery. From the ground, outflow boundaries can be co-located with the appearance of roll clouds and shelf clouds.

<span class="mw-page-title-main">Cumulus mediocris cloud</span>

Cumulus mediocris is a low to middle level cloud with some vertical extent of the genus cumulus, larger in vertical development than Cumulus humilis. It also may exhibit small protuberances from the top and may show the cauliflower form characteristic of cumulus clouds. Cumulus mediocris clouds do not generally produce precipitation of more than very light intensity, but can further advance into clouds such as Cumulus congestus or Cumulonimbus, which do produce precipitation and severe storms.

<span class="mw-page-title-main">Weather front</span> Boundary separating two masses of air of different densities

A weather front is a boundary separating air masses for which several characteristics differ, such as air density, wind, temperature, and humidity. Disturbed and unstable weather due to these differences often arises along the boundary. For instance, cold fronts can bring bands of thunderstorms and cumulonimbus precipitation or be preceded by squall lines, while warm fronts are usually preceded by stratiform precipitation and fog. In summer, subtler humidity gradients are known as dry lines can trigger severe weather. Some fronts produce no precipitation and little cloudiness, although there is invariably always a wind shift.

<span class="mw-page-title-main">Trough (meteorology)</span> Elongated region of low atmospheric pressure

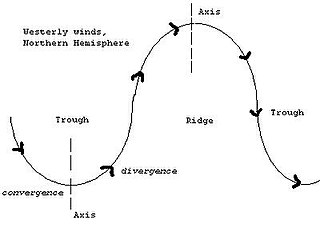
A trough is an elongated region of relatively low atmospheric pressure without a closed isobaric contour that would define it as a low pressure area. Since low pressure implies a low height on a pressure surface, troughs and ridges refer to features in an identical sense as those on a topographic map.

<span class="mw-page-title-main">Okta</span> A unit of measurement for quantifying cloud cover

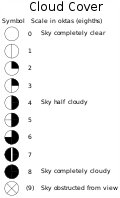
In meteorology, an okta is a unit of measurement used to describe the amount of cloud cover at any given location such as a weather station. Sky conditions are estimated in terms of how many eighths of the sky are covered in cloud, ranging from 0 oktas through to 8 oktas. In addition, in the SYNOP code there is an extra cloud cover indicator '9' indicating that the sky is totally obscured, usually due to dense fog or heavy snow.

<span class="mw-page-title-main">Precipitation types</span>

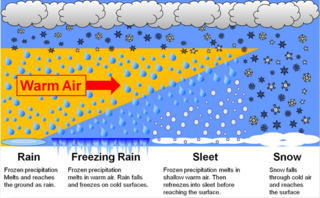
In meteorology, the different types of precipitation often include the character, formation, or phase of the precipitation which is falling to ground level. There are three distinct ways that precipitation can occur. Convective precipitation is generally more intense, and of shorter duration, than stratiform precipitation. Orographic precipitation occurs when moist air is forced upwards over rising terrain and condenses on the slope, such as a mountain.

<span class="mw-page-title-main">Outline of meteorology</span> Overview of and topical guide to meteorology

The following outline is provided as an overview of and topical guide to the field of Meteorology.

<span class="mw-page-title-main">Surface weather observation</span> Fundamental data used for weather forecasts

Surface weather observations are the fundamental data used for safety as well as climatological reasons to forecast weather and issue warnings worldwide. They can be taken manually, by a weather observer, by computer through the use of automated weather stations, or in a hybrid scheme using weather observers to augment the otherwise automated weather station. The ICAO defines the International Standard Atmosphere (ISA), which is the model of the standard variation of pressure, temperature, density, and viscosity with altitude in the Earth's atmosphere, and is used to reduce a station pressure to sea level pressure. Airport observations can be transmitted worldwide through the use of the METAR observing code. Personal weather stations taking automated observations can transmit their data to the United States mesonet through the Citizen Weather Observer Program (CWOP), the UK Met Office through their Weather Observations Website (WOW), or internationally through the Weather Underground Internet site. A thirty-year average of a location's weather observations is traditionally used to determine the station's climate. In the US a network of Cooperative Observers make a daily record of summary weather and sometimes water level information.

<span class="mw-page-title-main">Cold front</span> Leading edge of a cooler mass of air

A cold front is the leading edge of a cooler mass of air at ground level that replaces a warmer mass of air and lies within a pronounced surface trough of low pressure. It often forms behind an extratropical cyclone, at the leading edge of its cold air advection pattern—known as the cyclone's dry "conveyor belt" flow. Temperature differences across the boundary can exceed 30 °C (54 °F) from one side to the other. When enough moisture is present, rain can occur along the boundary. If there is significant instability along the boundary, a narrow line of thunderstorms can form along the frontal zone. If instability is weak, a broad shield of rain can move in behind the front, and evaporative cooling of the rain can increase the temperature difference across the front. Cold fronts are stronger in the fall and spring transition seasons and are weakest during the summer.

A prognostic chart is a map displaying the likely weather forecast for a future time. Such charts generated by atmospheric models as output from numerical weather prediction and contain a variety of information such as temperature, wind, precipitation and weather fronts. They can also indicate derived atmospheric fields such as vorticity, stability indices, or frontogenesis. Forecast errors need to be taken into account and can be determined either via absolute error, or by considering persistence and absolute error combined.

<span class="mw-page-title-main">Glossary of meteorology</span> List of definitions of terms and concepts commonly used in meteorology

This glossary of meteorology is a list of terms and concepts relevant to meteorology and atmospheric science, their sub-disciplines, and related fields.

References

  1. CoCoRAHS (2015).INTRODUCTION TO DRAWING ISOPLETHS. Archived 2007-04-28 at the Wayback Machine Colorado Climate Center. Retrieved on 2007-04-29.
  2. National Weather Service (2003). Station Model Example. Retrieved on 2007-04-29.
  3. 1 2 Dr Elizabeth R. Tuttle (2005). Weather Maps. Archived 2008-07-09 at the Wayback Machine J. B. Calvert. Retrieved on 2007-05-10.
  4. Hydrometeorological Prediction Center (2008). Decoding the station model. National Centers for Environmental Prediction. Retrieved on 2007-05-16.
  5. 1 2 3 4 5 6 JetStream (2008). How to read weather maps. Archived 2012-07-05 at the Wayback Machine National Weather Service. Retrieved on 2007-05-16.
  6. Terry T. Lankford (2000). Aviation Weather Handbook. McGraw-Hill Professional. ISBN   978-0-07-136103-3. Retrieved on 2008-01-22.
  7. 1 2 United States Weather Bureau (1871). Daily Weather Map: January 1, 1871. Retrieved on 2008-01-22.
  8. 1 2 United States Weather Bureau (1941). Daily Weather Map: July 31, 1941. Retrieved on 2008-01-22.
  9. United States Weather Bureau (1941). Daily Weather Map: August 1, 1941. Retrieved on 2008-01-22.
  10. MetOffice (2008). Interpreting weather charts. Archived 2007-05-25 at the Wayback Machine Retrieved on 2007-05-17.
  11. Glossary of Meteorology (2009). Nephanalysis. Archived 2007-08-16 at the Wayback Machine American Meteorological Society. Retrieved on 2008-01-22.
  12. AEROGRAPHER'S MATE 1&C (2008). SHORT-RANGE EXTRAPOLATION. Integrated Publishing. Retrieved on 2008-01-22.
  13. NOAA, ed. (September 3, 2007). Federal Meteorological Handbook (FMH) Number 2 (PDF). NOAA. p. C-17. Retrieved 26 November 2014.
  14. Clouds Online (2012). "Cloud Atlas" . Retrieved 1 February 2012.
  15. JetStream (2003). Cloud type priority via Internet Wayback Machine. National Weather Service Southern Region Headquarters. Retrieved on 2007-05-17.
  16. American Meteorological Society (2006). Map Symbols. Retrieved on 2008-01-22.
  17. University of Wisconsin–Madison Department of Atmospheric and Ocean Sciences (1996). Air Masses and Fronts. Retrieved on 2008-01-22.
  18. Frank Singleton (2000). Tides in the Atmosphere. Retrieved on 2007-05-16.
  19. Dr P. M. Inness. Isobaric analysis and pressure tendency. Archived 2006-12-14 at the Wayback Machine Dr. Giles Harrison. Retrieved on 2008-01-22.