Weather is the state of the atmosphere, describing for example the degree to which it is hot or cold, wet or dry, calm or stormy, clear or cloudy.[1] On Earth, most weather phenomena occur in the lowest layer of the planet's atmosphere, the troposphere,[2][3] just below the stratosphere. Weather refers to day-to-day temperature, precipitation, and other atmospheric conditions, whereas climate is the term for the averaging of atmospheric conditions over longer periods of time.[4] When used without qualification, "weather" is generally understood to mean the weather of Earth.
Surface temperature differences in turn cause pressure differences. Higher altitudes are cooler than lower altitudes, as most atmospheric heating is due to contact with the Earth's surface while radiative losses to space are mostly constant. Weather forecasting is the application of science and technology to predict the state of the atmosphere for a future time and a given location. Earth's weather system is a chaotic system; as a result, small changes to one part of the system can grow to have large effects on the system as a whole. Human attempts to control the weather have occurred throughout history, and there is evidence that human activities such as agriculture and industry have modified weather patterns.
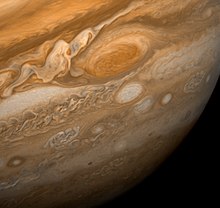
Studying how the weather works on other planets has been helpful in understanding how weather works on Earth. A famous landmark in the Solar System, Jupiter's Great Red Spot, is an anticyclonic storm known to have existed for at least 300 years. However, the weather is not limited to planetary bodies. A star's corona is constantly being lost to space, creating what is essentially a very thin atmosphere throughout the Solar System. The movement of mass ejected from the Sun is known as the solar wind.
On Earth, the common weather phenomena include wind, cloud, rain, snow, fog and dust storms. Less common events include natural disasters such as tornadoes, hurricanes, typhoons and ice storms. Almost all familiar weather phenomena occur in the troposphere (the lower part of the atmosphere).[3] Weather does occur in the stratosphere and can affect weather lower down in the troposphere, but the exact mechanisms are poorly understood.[5]
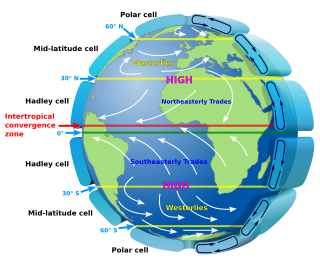
Weather occurs primarily due to air pressure, temperature and moisture differences from one place to another. These differences can occur due to the sun angle at any particular spot, which varies by latitude in the tropics. In other words, the farther from the tropics one lies, the lower the sun angle is, which causes those locations to be cooler due to the spread of the sunlight over a greater surface.[6] The strong temperature contrast between polar and tropical air gives rise to the large scale atmospheric circulation cells and the jet stream.[7] Weather systems in the mid-latitudes, such as extratropical cyclones, are caused by instabilities of the jet stream flow (see baroclinity).[8] Weather systems in the tropics, such as monsoons or organized thunderstorm systems, are caused by different processes.
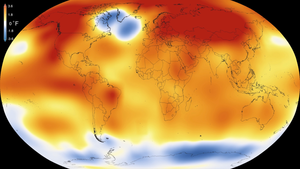
2015 – 5th Warmest Global Year on Record (since 1880) as of 2021 – Colors indicate temperature anomalies (NASA/NOAA; 20 January 2016).
Because the Earth's axis is tilted relative to its orbital plane, sunlight is incident at different angles at different times of the year. In June the Northern Hemisphere is tilted towards the Sun, so at any given Northern Hemisphere latitude sunlight falls more directly on that spot than in December (see Effect of sun angle on climate).[10] This effect causes seasons. Over thousands to hundreds of thousands of years, changes in Earth's orbital parameters affect the amount and distribution of solar energy received by the Earth and influence long-term climate. (See Milankovitch cycles).[11]
The uneven solar heating (the formation of zones of temperature and moisture gradients, or frontogenesis) can also be due to the weather itself in the form of cloudiness and precipitation.[12] Higher altitudes are typically cooler than lower altitudes, which is the result of higher surface temperature and radiational heating, which produces the adiabaticlapse rate.[13][14] In some situations, the temperature actually increases with height. This phenomenon is known as an inversion and can cause mountaintops to be warmer than the valleys below. Inversions can lead to the formation of fog and often act as a cap that suppresses thunderstorm development. On local scales, temperature differences can occur because different surfaces (such as oceans, forests, ice sheets, or human-made objects) have differing physical characteristics such as reflectivity, roughness, or moisture content.
Surface temperature differences in turn cause pressure differences. A hot surface warms the air above it causing it to expand and lower the density and the resulting surface air pressure.[15] The resulting horizontal pressure gradient moves the air from higher to lower pressure regions, creating a wind, and the Earth's rotation then causes deflection of this airflow due to the Coriolis effect.[16] The simple systems thus formed can then display emergent behaviour to produce more complex systems and thus other weather phenomena. Large scale examples include the Hadley cell while a smaller scale example would be coastal breezes.
The atmosphere is a chaotic system. As a result, small changes to one part of the system can accumulate and magnify to cause large effects on the system as a whole.[17] This atmospheric instability makes weather forecasting less predictable than tidal waves or eclipses.[18] Although it is difficult to accurately predict weather more than a few days in advance, weather forecasters are continually working to extend this limit through meteorological research and refining current methodologies in weather prediction. However, it is theoretically impossible to make useful day-to-day predictions more than about two weeks ahead, imposing an upper limit to potential for improved prediction skill.[19]
Weather is one of the fundamental processes that shape the Earth. The process of weathering breaks down the rocks and soils into smaller fragments and then into their constituent substances.[20] During rains precipitation, the water droplets absorb and dissolve carbon dioxide from the surrounding air. This causes the rainwater to be slightly acidic, which aids the erosive properties of water. The released sediment and chemicals are then free to take part in chemical reactions that can affect the surface further (such as acid rain), and sodium and chloride ions (salt) deposited in the seas/oceans. The sediment may reform in time and by geological forces into other rocks and soils. In this way, weather plays a major role in erosion of the surface.[21]
Weather, seen from an anthropological perspective, is something all humans in the world constantly experience through their senses, at least while being outside. There are socially and scientifically constructed understandings of what weather is, what makes it change, the effect it has on humans in different situations, etc.[22] Therefore, weather is something people often communicate about. The National Weather Service has an annual report for fatalities, injury, and total damage costs which include crop and property. They gather this data via National Weather Service offices located throughout the 50 states in the United States as well as Puerto Rico, Guam, and the Virgin Islands. As of 2019, tornadoes have had the greatest impact on humans with 42 fatalities while costing crop and property damage over 3 billion dollars.[23]
Effects on populations
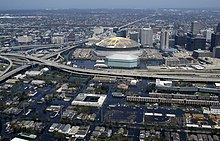
New Orleans, Louisiana, after being struck by Hurricane Katrina. Katrina was a Category 3 hurricane when it struck although it had been a category 5 hurricane in the Gulf of Mexico.
The weather has played a large and sometimes direct part in human history. Aside from climatic changes that have caused the gradual drift of populations (for example the desertification of the Middle East, and the formation of land bridges during glacial periods), extreme weather events have caused smaller scale population movements and intruded directly in historical events. One such event is the saving of Japan from invasion by the Mongol fleet of Kublai Khan by the Kamikaze winds in 1281.[24] French claims to Florida came to an end in 1565 when a hurricane destroyed the French fleet, allowing Spain to conquer Fort Caroline.[25] More recently, Hurricane Katrina redistributed over one million people from the central Gulf coast elsewhere across the United States, becoming the largest diaspora in the history of the United States.[26]
The Little Ice Age caused crop failures and famines in Europe. During the period known as the Grindelwald Fluctuation (1560–1630), volcanic forcing events[27] seem to have led to more extreme weather events.[28] These included droughts, storms and unseasonal blizzards, as well as causing the Swiss Grindelwald Glacier to expand. The 1690s saw the worst famine in France since the Middle Ages. Finland suffered a severe famine in 1696–1697, during which about one-third of the Finnish population died.[29]
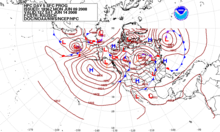
Forecast of surface pressures five days into the future for the north Pacific, North America, and the north Atlantic Ocean as on 9 June 2008
Weather forecasting is the application of science and technology to predict the state of the atmosphere for a future time and a given location. Human beings have attempted to predict the weather informally for millennia, and formally since at least the nineteenth century.[30] Weather forecasts are made by collecting quantitative data about the current state of the atmosphere and using scientific understanding of atmospheric processes to project how the atmosphere will evolve.[31]
Once an all-human endeavor based mainly upon changes in barometric pressure, current weather conditions, and sky condition,[32][33]forecast models are now used to determine future conditions. On the other hand, human input is still required to pick the best possible forecast model to base the forecast upon, which involves many disciplines such as pattern recognition skills, teleconnections, knowledge of model performance, and knowledge of model biases.
The chaotic nature of the atmosphere, the massive computational power required to solve the equations that describe the atmosphere, the error involved in measuring the initial conditions, and an incomplete understanding of atmospheric processes mean that forecasts become less accurate as of the difference in current time and the time for which the forecast is being made (the range of the forecast) increases. The use of ensembles and model consensus helps to narrow the error and pick the most likely outcome.[34][35][36]
There are a variety of end users to weather forecasts. Weather warnings are important forecasts because they are used to protect life and property.[37][38] Forecasts based on temperature and precipitation are important to agriculture,[39][40][41][42] and therefore to commodity traders within stock markets. Temperature forecasts are used by utility companies to estimate demand over coming days.[43][44][45]
In some areas, people use weather forecasts to determine what to wear on a given day. Since outdoor activities are severely curtailed by heavy rain, snow and the wind chill, forecasts can be used to plan activities around these events and to plan ahead to survive through them.
Tropical weather forecasting is different from that at higher latitudes. The sun shines more directly on the tropics than on higher latitudes (at least on average over a year), which makes the tropics warm (Stevens 2011). And, the vertical direction (up, as one stands on the Earth's surface) is perpendicular to the Earth's axis of rotation at the equator, while the axis of rotation and the vertical are the same at the pole; this causes the Earth's rotation to influence the atmospheric circulation more strongly at high latitudes than low latitudes. Because of these two factors, clouds and rainstorms in the tropics can occur more spontaneously compared to those at higher latitudes, where they are more tightly controlled by larger-scale forces in the atmosphere. Because of these differences, clouds and rain are more difficult to forecast in the tropics than at higher latitudes. On the other hand, the temperature is easily forecast in the tropics, because it does not change much.[46]
Modification
The aspiration to control the weather is evident throughout human history: from ancient rituals intended to bring rain for crops to the U.S. Military Operation Popeye, an attempt to disrupt supply lines by lengthening the North Vietnamese monsoon. The most successful attempts at influencing weather involve cloud seeding; they include the fog- and low stratus dispersion techniques employed by major airports, techniques used to increase winter precipitation over mountains, and techniques to suppress hail.[47] A recent example of weather control was China's preparation for the 2008 Summer Olympic Games. China shot 1,104 rain dispersal rockets from 21 sites in the city of Beijing in an effort to keep rain away from the opening ceremony of the games on 8 August 2008. Guo Hu, head of the Beijing Municipal Meteorological Bureau (BMB), confirmed the success of the operation with 100 millimeters falling in Baoding City of Hebei Province, to the southwest and Beijing's Fangshan District recording a rainfall of 25 millimeters.[48]
Whereas there is inconclusive evidence for these techniques' efficacy, there is extensive evidence that human activity such as agriculture and industry results in inadvertent weather modification:[47]
Heat, generated by large metropolitan areas have been shown to minutely affect nearby weather, even at distances as far as 1,600 kilometres (990mi).[50]
The effects of inadvertent weather modification may pose serious threats to many aspects of civilization, including ecosystems, natural resources, food and fiber production, economic development, and human health.[51]
Microscale meteorology
Microscale meteorology is the study of short-lived atmospheric phenomena smaller than mesoscale, about 1km or less. These two branches of meteorology are sometimes grouped together as "mesoscale and microscale meteorology" (MMM) and together study all phenomena smaller than synoptic scale; that is they study features generally too small to be depicted on a weather map. These include small and generally fleeting cloud "puffs" and other small cloud features.[52]
Extremes on Earth
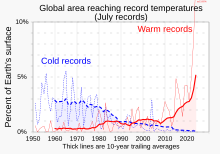
In recent decades, new high temperature records have substantially outpaced new low temperature records on a growing portion of Earth's surface
On Earth, temperatures usually range ±40°C (100°F to −40°F) annually. The range of climates and latitudes across the planet can offer extremes of temperature outside this range. The coldest air temperature ever recorded on Earth is −89.2°C (−128.6°F), at Vostok Station, Antarctica on 21 July 1983. The hottest air temperature ever recorded was 57.7°C (135.9°F) at 'Aziziya, Libya, on 13 September 1922,[54] but that reading is queried. The highest recorded average annual temperature was 34.4°C (93.9°F) at Dallol, Ethiopia.[55] The coldest recorded average annual temperature was −55.1°C (−67.2°F) at Vostok Station, Antarctica.[56]
The coldest average annual temperature in a permanently inhabited location is at Eureka, Nunavut, in Canada, where the annual average temperature is −19.7°C (−3.5°F).[57]
The windiest place ever recorded is in Antarctica, Commonwealth Bay (George V Coast). Here the gales reach 199mph (320km/h).[58] Furthermore, the greatest snowfall in a period of twelve months occurred in Mount Rainier, Washington, US. It was recorded as 31,102mm (102.04ft) of snow.[59]
Extraterrestrial within the Solar System
Jupiter's Great Red Spot in February 1979, photographed by the uncrewed Voyager 1 NASA space probe.
Studying how the weather works on other planets has been seen as helpful in understanding how it works on Earth.[60] Weather on other planets follows many of the same physical principles as weather on Earth, but occurs on different scales and in atmospheres having different chemical composition. The Cassini–Huygens mission to Titan discovered clouds formed from methane or ethane which deposit rain composed of liquid methane and other organic compounds.[61] Earth's atmosphere includes six latitudinal circulation zones, three in each hemisphere.[62] In contrast, Jupiter's banded appearance shows many such zones,[63] Titan has a single jet stream near the 50th parallel north latitude,[64] and Venus has a single jet near the equator.[65]
One of the most famous landmarks in the Solar System, Jupiter's Great Red Spot, is an anticyclonic storm known to have existed for at least 300 years.[66] On other gas giants, the lack of a surface allows the wind to reach enormous speeds: gusts of up to 600metres per second (about 2,100km/h or 1,300mph) have been measured on the planet Neptune.[67] This has created a puzzle for planetary scientists. The weather is ultimately created by solar energy and the amount of energy received by Neptune is only about 1⁄900 of that received by Earth, yet the intensity of weather phenomena on Neptune is far greater than on Earth.[68] The strongest planetary winds discovered so far are on the extrasolar planetHD 189733 b, which is thought to have easterly winds moving at more than 9,600 kilometres per hour (6,000mph).[69]
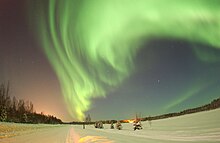
Weather is not limited to planetary bodies. Like all stars, the Sun's corona is constantly being lost to space, creating what is essentially a very thin atmosphere throughout the Solar System.The movement of mass ejected from the Sun is known as the solar wind. Inconsistencies in this wind and larger events on the surface of the star, such as coronal mass ejections, form a system that has features analogous to conventional weather systems (such as pressure and wind) and is generally known as space weather. Coronal mass ejections have been tracked as far out in the Solar System as Saturn.[70] The activity of this system can affect planetary atmospheres and occasionally surfaces. The interaction of the solar wind with the terrestrial atmosphere can produce spectacular aurorae,[71] and can play havoc with electrically sensitive systems such as electricity grids and radio signals.[72]
Climate is the long-term weather pattern in a region, typically averaged over 30 years. More rigorously, it is the mean and variability of meteorological variables over a time spanning from months to millions of years. Some of the meteorological variables that are commonly measured are temperature, humidity, atmospheric pressure, wind, and precipitation. In a broader sense, climate is the state of the components of the climate system, including the atmosphere, hydrosphere, cryosphere, lithosphere and biosphere and the interactions between them. The climate of a location is affected by its latitude, longitude, terrain, altitude, land use and nearby water bodies and their currents.
Jet streams are fast flowing, narrow, meandering air currents in the atmospheres of the Earth, Venus, Jupiter, Saturn, Uranus, and Neptune. On Earth, the main jet streams are located near the altitude of the tropopause and are westerly winds. Jet streams may start, stop, split into two or more parts, combine into one stream, or flow in various directions including opposite to the direction of the remainder of the jet.
Meteorology is a branch of the atmospheric sciences with a major focus on weather forecasting. The study of meteorology dates back millennia, though significant progress in meteorology did not begin until the 18th century. The 19th century saw modest progress in the field after weather observation networks were formed across broad regions. Prior attempts at prediction of weather depended on historical data. It was not until after the elucidation of the laws of physics, and more particularly in the latter half of the 20th century, the development of the computer that significant breakthroughs in weather forecasting were achieved. An important branch of weather forecasting is marine weather forecasting as it relates to maritime and coastal safety, in which weather effects also include atmospheric interactions with large bodies of water.
The troposphere is the lowest layer of the atmosphere of Earth. It contains 80% of the total mass of the planetary atmosphere and 99% of the total mass of water vapor and aerosols, and is where most weather phenomena occur. From the planetary surface of the Earth, the average height of the troposphere is 18 km in the tropics; 17 km in the middle latitudes; and 6 km in the high latitudes of the polar regions in winter; thus the average height of the troposphere is 13 km.
Climatology or climate science is the scientific study of Earth's climate, typically defined as weather conditions averaged over a period of at least 30 years. Climate concerns the atmospheric condition during an extended to indefinite period of time; weather is the condition of the atmosphere during a relative brief period of time. The main topics of research are the study of climate variability, mechanisms of climate changes and modern climate change. This topic of study is regarded as part of the atmospheric sciences and a subdivision of physical geography, which is one of the Earth sciences. Climatology includes some aspects of oceanography and biogeochemistry.
An anticyclone is a weather phenomenon defined as a large-scale circulation of winds around a central region of high atmospheric pressure, clockwise in the Northern Hemisphere and counterclockwise in the Southern Hemisphere as viewed from above. Effects of surface-based anticyclones include clearing skies as well as cooler, drier air. Fog can also form overnight within a region of higher pressure.
In meteorology, precipitation is any product of the condensation of atmospheric water vapor that falls from clouds due to gravitational pull. The main forms of precipitation include drizzle, rain, sleet, snow, ice pellets, graupel and hail. Precipitation occurs when a portion of the atmosphere becomes saturated with water vapor, so that the water condenses and "precipitates" or falls. Thus, fog and mist are not precipitation but colloids, because the water vapor does not condense sufficiently to precipitate. Two processes, possibly acting together, can lead to air becoming saturated: cooling the air or adding water vapor to the air. Precipitation forms as smaller droplets coalesce via collision with other rain drops or ice crystals within a cloud. Short, intense periods of rain in scattered locations are called showers.
Atmospheric circulation is the large-scale movement of air and together with ocean circulation is the means by which thermal energy is redistributed on the surface of the Earth. The Earth's atmospheric circulation varies from year to year, but the large-scale structure of its circulation remains fairly constant. The smaller-scale weather systems – mid-latitude depressions, or tropical convective cells – occur chaotically, and long-range weather predictions of those cannot be made beyond ten days in practice, or a month in theory.
A high-pressure area, high, or anticyclone, is an area near the surface of a planet where the atmospheric pressure is greater than the pressure in the surrounding regions. Highs are middle-scale meteorological features that result from interplays between the relatively larger-scale dynamics of an entire planet's atmospheric circulation.
In meteorology, a low-pressure area, low area or low is a region where the atmospheric pressure is lower than that of surrounding locations. Low-pressure areas are commonly associated with inclement weather, while high-pressure areas are associated with lighter winds and clear skies. Winds circle anti-clockwise around lows in the northern hemisphere, and clockwise in the southern hemisphere, due to opposing Coriolis forces. Low-pressure systems form under areas of wind divergence that occur in the upper levels of the atmosphere (aloft). The formation process of a low-pressure area is known as cyclogenesis. In meteorology, atmospheric divergence aloft occurs in two kinds of places:
In meteorology, the synoptic scale is a horizontal length scale of the order of 1,000 km (620 mi) or more. This corresponds to a horizontal scale typical of mid-latitude depressions. Most high- and low-pressure areas seen on weather maps are synoptic-scale systems, driven by the location of Rossby waves in their respective hemisphere. Low-pressure areas and their related frontal zones occur on the leading edge of a trough within the Rossby wave pattern, while high-pressure areas form on the back edge of the trough. Most precipitation areas occur near frontal zones. The word synoptic is derived from the Ancient Greek word συνοπτικός (sunoptikós), meaning "seen together".
A pressure system is a peak or lull in the sea level pressure distribution. The surface pressure at sea level varies minimally, with the lowest value measured 87 kilopascals (26 inHg) and the highest recorded 108.57 kilopascals (32.06 inHg). High- and low-pressure systems evolve due to interactions of temperature differentials in the atmosphere, temperature differences between the atmosphere and water within oceans and lakes, the influence of upper-level disturbances, as well as the amount of solar heating or radiationized cooling an area receives. Pressure systems cause weather to be experienced locally. Low-pressure systems are associated with clouds and precipitation that minimize temperature changes throughout the day, whereas high-pressure systems normally associate with dry weather and mostly clear skies with larger diurnal temperature changes due to greater radiation at night and greater sunshine during the day. Pressure systems are analyzed by those in the field of meteorology within surface weather maps.
This is a list of meteorology topics. The terms relate to meteorology, the interdisciplinary scientific study of the atmosphere that focuses on weather processes and forecasting.
Meteorological instruments, including meteorological sensors, are the equipment used to find the state of the atmosphere at a given time. Each science has its own unique sets of laboratory equipment. Meteorology, however, is a science which does not use much laboratory equipment but relies more on on-site observation and remote sensing equipment. In science, an observation, or observable, is an abstract idea that can be measured and for which data can be taken. Rain was one of the first quantities to be measured historically. Two other accurately measured weather-related variables are wind and humidity. Many attempts had been made prior to the 15th century to construct adequate equipment to measure atmospheric variables.
The following outline is provided as an overview of and topical guide to the field of Meteorology.
Surface weather observations are the fundamental data used for safety as well as climatological reasons to forecast weather and issue warnings worldwide. They can be taken manually, by a weather observer, by computer through the use of automated weather stations, or in a hybrid scheme using weather observers to augment the otherwise automated weather station. The ICAO defines the International Standard Atmosphere (ISA), which is the model of the standard variation of pressure, temperature, density, and viscosity with altitude in the Earth's atmosphere, and is used to reduce a station pressure to sea level pressure. Airport observations can be transmitted worldwide through the use of the METAR observing code. Personal weather stations taking automated observations can transmit their data to the United States mesonet through the Citizen Weather Observer Program (CWOP), the UK Met Office through their Weather Observations Website (WOW), or internationally through the Weather Underground Internet site. A thirty-year average of a location's weather observations is traditionally used to determine the station's climate. In the US a network of Cooperative Observers make a daily record of summary weather and sometimes water level information.
Wind is the natural movement of air or other gases relative to a planet's surface. Winds occur on a range of scales, from thunderstorm flows lasting tens of minutes, to local breezes generated by heating of land surfaces and lasting a few hours, to global winds resulting from the difference in absorption of solar energy between the climate zones on Earth. The two main causes of large-scale atmospheric circulation are the differential heating between the equator and the poles, and the rotation of the planet. Within the tropics and subtropics, thermal low circulations over terrain and high plateaus can drive monsoon circulations. In coastal areas the sea breeze/land breeze cycle can define local winds; in areas that have variable terrain, mountain and valley breezes can prevail.
Rain is water droplets that have condensed from atmospheric water vapor and then fall under gravity. Rain is a major component of the water cycle and is responsible for depositing most of the fresh water on the Earth. It provides water for hydroelectric power plants, crop irrigation, and suitable conditions for many types of ecosystems.
A cold-core low, also known as an upper level low or cold-core cyclone, is a cyclone aloft which has an associated cold pool of air residing at high altitude within the Earth's troposphere, without a frontal structure. It is a low pressure system that strengthens with height in accordance with the thermal wind relationship. If a weak surface circulation forms in response to such a feature at subtropical latitudes of the eastern north Pacific or north Indian oceans, it is called a subtropical cyclone. Cloud cover and rainfall mainly occurs with these systems during the day.
This glossary of meteorology is a list of terms and concepts relevant to meteorology and atmospheric science, their sub-disciplines, and related fields.
↑ Crate, Susan A; Nuttall, Mark, eds. (2009). Anthropology and Climate Change: From Encounters to Actions(PDF). Walnut Creek, CA: Left Coast Press. pp.70–86, i.e. the chapter 'Climate and weather discourse in anthropology: from determinism to uncertain futures' by Nicholas Peterson & Kenneth Broad. Archived(PDF) from the original on 27 February 2021. Retrieved 21 May 2014.
↑ United States. National Weather Service. Office of Climate, Water, Weather Services, & National Climatic Data Center. (2000). Weather Related Fatality and Injury Statistics.
↑ M. Fulchignoni; F. Ferri; F. Angrilli; A. Bar-Nun; M.A. Barucci; G. Bianchini; etal. (2002). "The Characterisation of Titan's Atmospheric Physical Properties by the Huygens Atmospheric Structure Instrument (Hasi)". Space Science Reviews. 104 (1): 395–431. Bibcode:2002SSRv..104..395F. doi:10.1023/A:1023688607077. S2CID189778612.
This page is based on this Wikipedia article Text is available under the CC BY-SA 4.0 license; additional terms may apply. Images, videos and audio are available under their respective licenses.