Trillion dollar club (macroeconomics)

Last updated

The Trillion dollar club is an unofficial classification of the world's major economies with a gross domestic product (nominal GDP) of more than US$1 trillion per year. [1] [2] As of 2023, it included 19 countries. This does not include purchasing power parity, which increases the GDP of many countries with an undervalued currency, which are usually poorer countries.

Contents

Since currency valuations can be subject to rapid change, a country could achieve the US$1 trillion nominal GDP mark one year and then produce less than that in total goods and services the following year(s). The 2010 data used here are compiled according to the International Monetary Fund (IMF) values. As for the former Soviet Union, the last statistics about its economy stated that it had an over US$2.5 trillion economy in the 1990 fiscal year, before its collapse.

US$1 trillion – US$10 trillion

US$1 trillion economy

YearCountrySource
1969Flag of the United States.svg  United States [3]
1972Flag of Europe.svg  European Union [3]
1979Flag of Japan.svg  Japan [3]
1987Flag of Germany.svg  West Germany [3]
1988Flag of France.svg  France [3]
1989Flag of the United Kingdom.svg  United Kingdom [3]
1990Flag of Italy.svg  Italy [3]
1998Flag of the People's Republic of China.svg  China [3]
2004Flag of Spain.svg  Spain [3]
2004Flag of Canada (Pantone).svg  Canada [3]
2006Flag of Brazil.svg  Brazil [3]
2006Flag of South Korea.svg  South Korea [3]
2007Flag of India.svg  India [3]
2007Flag of Mexico.svg  Mexico [3]
2007Flag of Russia.svg  Russia [3]
2008Flag of Australia (converted).svg  Australia [3]
2017Flag of Indonesia.svg  Indonesia [3]
2021Flag of the Netherlands.svg  Netherlands [4]
2022Flag of Saudi Arabia.svg  Saudi Arabia [5]
2023Flag of Turkey.svg  Turkey [6]

US$2 trillion economy

YearCountrySource
1977Flag of Europe.svg  European Union [3]
1977Flag of the United States.svg  United States [3]
1986Flag of Japan.svg  Japan [3]
1992Flag of Germany.svg  Germany [3]
2004Flag of France.svg  France [3]
2004Flag of the United Kingdom.svg  United Kingdom [3]
2005Flag of the People's Republic of China.svg  China [3]
2007Flag of Italy.svg  Italy [3]
2010Flag of Brazil.svg  Brazil [3]
2011Flag of Russia.svg  Russia [3]
2014Flag of India.svg  India [3]
2021Flag of Canada (Pantone).svg  Canada [3]

US$3 trillion economy

YearCountrySource
1979Flag of Europe.svg  European Union [3]
1981Flag of the United States.svg  United States [3]
1988Flag of Japan.svg  Japan [3]
2006Flag of Germany.svg  Germany [3]
2007Flag of the People's Republic of China.svg  China [3]
2007Flag of the United Kingdom.svg  United Kingdom [4]
2021Flag of India.svg  India [4]
2022Flag of France.svg  France [7]

US$4 trillion economy

YearCountrySource
1984Flag of the United States.svg  United States [3]
1986Flag of Europe.svg  European Union [3]
1993Flag of Japan.svg  Japan [3]
2008Flag of the People's Republic of China.svg  China [3]
2018Flag of Germany.svg  Germany [3]
2024Flag of India.svg  India [3]

US$5 trillion economy

YearCountrySource
1987Flag of Europe.svg  European Union [3]
1988Flag of the United States.svg  United States [3]
1995Flag of Japan.svg  Japan [3]
2009Flag of the People's Republic of China.svg  China [3]

US$6 trillion economy

YearCountrySource
1989Flag of Europe.svg  European Union [3]
1992Flag of the United States.svg  United States [3]
2010Flag of the People's Republic of China.svg  China [3]
2011Flag of Japan.svg  Japan [3]

US$7 trillion economy

YearCountrySource
1990Flag of Europe.svg  European Union [3]
1994Flag of the United States.svg  United States [3]
2011Flag of the People's Republic of China.svg  China [3]

US$8 trillion economy

YearCountrySource
1992Flag of Europe.svg  European Union [3]
1996Flag of the United States.svg  United States [3]
2012Flag of the People's Republic of China.svg  China [3]

US$9 trillion economy

YearCountrySource
1995Flag of Europe.svg  European Union [3]
1998Flag of the United States.svg  United States [3]
2013Flag of the People's Republic of China.svg  China [3]

US$10 trillion economy

YearCountrySource
2000Flag of the United States.svg  United States [3]
2004Flag of Europe.svg  European Union [3]
2014Flag of the People's Republic of China.svg  China [3]

US$11 trillion – US$20 trillion

US$11 trillion economy

YearCountrySource
2003Flag of the United States.svg  United States [3]
2004Flag of Europe.svg  European Union [3]
2015Flag of the People's Republic of China.svg  China [3]

US$12 trillion economy

YearCountrySource
2004Flag of Europe.svg  European Union [3]
2004Flag of the United States.svg  United States [3]
2017Flag of the People's Republic of China.svg  China [3]

US$13 trillion economy

YearCountrySource
2004Flag of Europe.svg  European Union [3]
2005Flag of the United States.svg  United States [3]
2018Flag of the People's Republic of China.svg  China [3]

US$14 trillion economy

YearCountrySource
2005Flag of Europe.svg  European Union [3]
2007Flag of the United States.svg  United States [3]
2019Flag of the People's Republic of China.svg  China [3]

US$15 trillion economy

YearCountrySource
2006Flag of Europe.svg  European Union [3]
2011Flag of the United States.svg  United States [3]
2021Flag of the People's Republic of China.svg  China [4]

US$16 trillion economy

YearCountrySource
2007Flag of Europe.svg  European Union [3]
2012Flag of the United States.svg  United States [3]
2021Flag of the People's Republic of China.svg  China [4]

US$17 trillion economy

YearCountrySource
2007Flag of Europe.svg  European Union [3]
2014Flag of the United States.svg  United States [3]
2021Flag of the People's Republic of China.svg  China [3]

US$18 trillion economy

YearCountrySource
2008Flag of Europe.svg  European Union [3]
2015Flag of the United States.svg  United States [3]
2023Flag of the People's Republic of China.svg  China [4]

US$19 trillion economy

YearCountrySource
2008Flag of Europe.svg  European Union [3]
2018Flag of the United States.svg  United States [3]
2023Flag of the People's Republic of China.svg  China [4]

US$20 trillion economy

YearCountrySource
2018Flag of the United States.svg  United States [3]

US$21 trillion – US$30 trillion

US$21 trillion economy

YearCountrySource
2019Flag of the United States.svg  United States [3]

US$22 trillion economy

YearCountrySource
2021Flag of the United States.svg  United States [3]

US$23 trillion economy

YearCountrySource
2023Flag of the United States.svg  United States [8]

US$24 trillion economy

YearCountrySource
2023Flag of the United States.svg  United States [9]

US$25 trillion economy

YearCountrySource
2023Flag of the United States.svg  United States [10]

See also

Related Research Articles

The gross world product (GWP), also known as gross world income (GWI), is the combined gross national income of all the countries in the world. Because imports and exports balance exactly when considering the whole world, this also equals the total global gross domestic product (GDP). According to the World Bank, the 2013 nominal GWP was approximately 75.59 trillion United States dollars. In 2017, according to the CIA's World Factbook, the GWP was around $80.27 trillion in nominal terms and totaled approximately 127.8 trillion international dollars in terms of purchasing power parity (PPP). The per capita PPP GWP in 2017 was approximately 17,500 international dollars according to the World Factbook. According to the World Bank, the 2020 GWP in current dollars was approximately $84.705 trillion.

<span class="mw-page-title-main">World economy</span> Economy of the world

The world economy or global economy is the economy of all humans in the world, referring to the global economic system, which includes all economic activities conducted both within and between nations, including production, consumption, economic management, work in general, financial transactions and trade of goods and services. In some contexts, the two terms are distinct: the "international" or "global economy" is measured separately and distinguished from national economies, while the "world economy" is simply an aggregate of the separate countries' measurements. Beyond the minimum standard concerning value in production, use and exchange, the definitions, representations, models and valuations of the world economy vary widely. It is inseparable from the geography and ecology of planet Earth.

<span class="mw-page-title-main">National debt of the United States</span> Worlds largest national debt

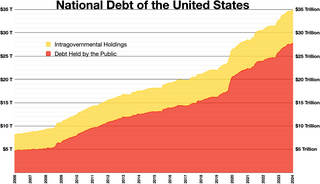
The national debt of the United States is the total national debt owed by the federal government of the United States to Treasury security holders. The national debt at any point in time is the face value of the then-outstanding Treasury securities that have been issued by the Treasury and other federal agencies. The terms "national deficit" and "national surplus" usually refer to the federal government budget balance from year to year, not the cumulative amount of debt. In a deficit year the national debt increases as the government needs to borrow funds to finance the deficit, while in a surplus year the debt decreases as more money is received than spent, enabling the government to reduce the debt by buying back some Treasury securities. In general, government debt increases as a result of government spending and decreases from tax or other receipts, both of which fluctuate during the course of a fiscal year. There are two components of gross national debt:

<span class="mw-page-title-main">Gross national income</span> Total domestic and foreign economic output claimed by residents of a country

The gross national income (GNI), previously known as gross national product (GNP), is the total domestic and foreign output claimed by residents of a country, consisting of gross domestic product (GDP), plus factor incomes earned by foreign residents, minus income earned in the domestic economy by nonresidents.

In economics, gross output (GO) is the measure of total economic activity in the production of new goods and services in an accounting period. It is a much broader measure of the economy than gross domestic product (GDP), which is limited mainly to final output. As of first-quarter 2019, the Bureau of Economic Analysis estimated gross output in the United States to be $37.2 trillion, compared to $21.1 trillion for GDP.

<span class="mw-page-title-main">Net international investment position</span> Concept in economics

The net international investment position (NIIP) is the difference in the external financial assets and liabilities of a country. External debt of a country includes government debt and private debt. External assets publicly and privately held by a country's legal residents are also taken into account when calculating NIIP. Commodities and currencies tend to follow a cyclical pattern of significant valuation changes, which is also reflected in NIIP.

<span class="mw-page-title-main">Historical GDP of China</span> Overview of economic growth and decline in the East Asian country

This article includes a list of China's historical gross domestic product (GDP) values, the market value of all final goods and services produced by a nation in a given year. The GDP dollar estimates presented here are either calculated at market or government official exchange rates (nominal), or derived from purchasing power parity (PPP) calculations. This article also includes historical GDP growth.

References

  1. Welcome to the Trillion Dollar Club - Forbes.com 26 April 2007
  2. Indian joins the Trillion Dollar Club - The Hindu 27 April 2007
  3. 1 2 3 4 5 6 7 8 9 10 11 12 13 14 15 16 17 18 19 20 21 22 23 24 25 26 27 28 29 30 31 32 33 34 35 36 37 38 39 40 41 42 43 44 45 46 47 48 49 50 51 52 53 54 55 56 57 58 59 60 61 62 63 64 65 66 67 68 69 70 71 72 73 74 75 76 77 78 79 80 81 82 83 84 85 86 "World Bank". Data.worldbank.org. Retrieved 6 May 2019.
  4. 1 2 3 4 5 6 7 "Report for Selected Countries and Subjects". IMF.org. Retrieved 3 March 2022.
  5. "Saudi GDP Exceeds $1 Tln, Shows Kingdom's Economy Is on Right Track".
  6. "April 2023".
  7. "GDP from 2020 through 2024, April 2021 estimate | World Economic Outlook Database".
  8. "Gross Domestic Product, Fourth Quarter and Year 2022 (Second Estimate) | U.S. Bureau of Economic Analysis (BEA)". www.bea.gov. Retrieved 25 April 2023.
  9. "Gross Domestic Product, Fourth Quarter and Year 2022 (Second Estimate) | U.S. Bureau of Economic Analysis (BEA)". www.bea.gov. Retrieved 25 April 2023.
  10. "Gross Domestic Product, Fourth Quarter and Year 2022 (Second Estimate) | U.S. Bureau of Economic Analysis (BEA)". www.bea.gov. Retrieved 25 April 2023.