Woolton ward was an electoral division of Liverpool City Council between 1953 and 1973, and 1980 and 2023. It and was centred on the Woolton district of Liverpool.
The ward was first formed in 1953. It was split up in 1973, reformed in 1980 and its boundaries were changed in 2004 before being dissolved in 2023.
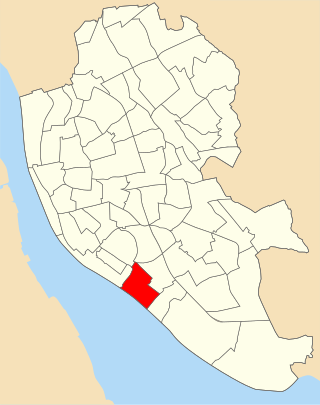
1953 boundaries
1953 boundaries
The ward was formed from the former Little Woolton and Much Woolton wards.
The ward was part of the Liverpool Garston Parliamentary constituency.
1973 election
Following the Local Government Act 1972 the ward boundaries of the council were altered. The number of wards was reduced from 40 to 33 and the aldermanic system was abolished. Woolton was split into the Woolton East and Woolton West wards.[1]
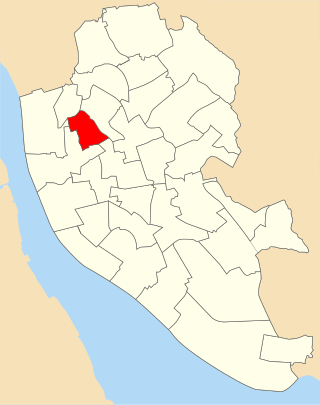
1980 boundaries
1980 boundaries
A report of the Local Government Boundary Commission for England published in November 1978 set out proposals for changes to the wards of Liverpool City Council, maintaining the number of councillors at 99 representing 33 wards. Woolton ward was reestablished to be represented by three councillors.[2]
The report describes the boundaries of Woolton ward as "Commencing at a point where Allerton Road (northern carriageway) meets Menlove Avenue, thence northwestwards along said avenue to the southern boundary of Church Ward, thence northeastwards along said boundary and northwestwards along the eastern boundary of said ward to the southern boundary of Childwall Ward, thence southeastwards along said boundary and generally northeastwards, northwestwards and northeastwards along the southeastern boundary of said ward to the southwestern boundary of Valley Ward, thence southeastwards along said boundary and the southwestern boundary of Netherley Ward to the eastern boundary of the City, thence southwestwards and southwards along said boundary to a point opposite Manor Way, thence westwards to and along said Way to North Manor Way, thence northwards and generally southwestwards along said way to Manor Way thence southwestwarde along said way to Manor Road, thence northwestwards along said road and Speke Road to High Street (Northern carriageway), thence southwestwards along said street and Allerton Road (northern carriageway) to the point of commencement".[3]
A review by the Boundary Committee for England recommended that the council was formed of a reduced number of 90 members elected from 30 wards. Woolton ward was changed to gain small parts of the former Allerton and Church wards, and losing a small part to the new Allerton and Hunts Cross (ward).[5]
The ward boundaries follow the North Liverpool Extension Line, Out Lane, Kings Drive, Speke Road, School Lane, the southern boundary of Woolton Woods, Hillfoot Road, Menlove Avenue, Druid's Cross Road, Hornby Lane, Woolton Road, the southern boundary of Childwall Woods, Childwall Lane, the northern property line of Well Lane and Viewpark Close.[5]
Tuebrook ward was an electoral district of Liverpool City Council centred on the Tuebrook district of Liverpool.
Old Swan ward was an electoral division of Liverpool City Council, centred on the Old Swan district of Liverpool.
Fazakerley ward was an electoral division of Liverpool City Council between 1953 and 2022.
Everton ward was an electoral division of Liverpool City Council in the Liverpool Walton Parliamentary constituency.
Croxteth ward is an electoral division of Liverpool City Council. Ward in the Liverpool West Derby Parliamentary constituency.
Clubmoor ward was an electoral division of Liverpool City Council in the Liverpool Walton Parliamentary constituency.
Anfield ward is an electoral district of Liverpool City Council centred on the Anfield district of Liverpool. The ward is within the Liverpool Walton Parliamentary constituency.
Aigburth ward is an electoral district of Liverpool City Council within the Liverpool Riverside Parliamentary constituency.
Breckfield ward was an electoral district of Liverpool City Council from 1895 until 2004. It was part of the Everton and Anfield districts of Liverpool.
Allerton ward is an electoral district of Liverpool City Council. within the Liverpool Wavertree and Garston and Halewood Parliamentary constituencies.
Gillmoss ward was an electoral division of Liverpool City Council between 1953 and 2004. It and was centred on the Croxteth district of Liverpool.
Valley ward was an electoral division of Liverpool City Council between 1980 and 2004. It and was centred on the Netherley district of Liverpool.
References
↑ The County of Merseyside (Electoral Divisions and Wards) Order 1973
↑ The City of Liverpool (Electoral Arrangements) Order 1979
↑ "Report No.319"(PDF). Local Government Boundary Commission For England. Archived from the original(PDF) on 20 March 2022.
1 2 Craig, F.W.S., ed. (1972). Boundaries of parliamentary constituencies 1885-1972. Chichester, Sussex: Political Reference Publications. ISBN0-900178-09-4.
This page is based on this Wikipedia article Text is available under the CC BY-SA 4.0 license; additional terms may apply. Images, videos and audio are available under their respective licenses.