Elections to Liverpool City Council were held on 1 May 2003. One third of the council was up for election and the Liberal Democrat party kept overall control of the council. [1] Overall turnout was 21.7%.
After the election, the composition of the council was
Party | Seats | ± | |
---|---|---|---|
Liberal Democrats | 63 | ||
Labour | 31 | ||
Liberal | 3 | 0 | |
Independent | 2 | ||
Party | Seats | Gains | Losses | Net gain/loss | Seats % | Votes % | Votes | +/− | |
---|---|---|---|---|---|---|---|---|---|
Liberal Democrats | 22 | -2 | 64.7 | 49.8 | 37,194 | -0.5% | |||
Labour | 11 | +4 | 29.4 | 34.2 | 25,514 | -1.2% | |||
Liberal | 1 | +1 | 2.9 | 6.8 | 5,066 | +1.3% | |||
Liverpool Labour Community Party | 1 | -1 | 2.9 | 1.4 | 1,034 | +1.4% | |||
Conservative | 0 | 0 | 0 | 4.1 | 3,050 | -0.1% | |||
Green | 0 | 0 | 0 | 2.8 | 2,093 | +0.8% | |||
Socialist Alliance | 0 | 0 | 0 | 0.6 | 461 | +0.2% | |||
BNP | 0 | 0 | 0 | 0.3 | 242 | +0.1% | |||
Independent | 0 | -2 | 0 | 0 | 0 | -1.7% |
Party | Candidate | Votes | % | ±% | |
---|---|---|---|---|---|
Labour | Paul Brant * | 953 | 61.3% | -4.5% | |
Liberal Democrats | Linda-Jane Buckle | 288 | 18.5 | +3.2 | |
Green | Peter Cranie | 230 | 14.8 | +4.0 | |
Conservative | John Creagh | 55 | 3.5 | -1.3 | |
Liberal | Arthur Carroll | 29 | 1.9 | -1.4 | |
Majority | 665 | ||||
Registered electors | |||||
Turnout | |||||
Rejected ballots | |||||
Labour hold | Swing | ||||
Party | Candidate | Votes | % | ±% | |
---|---|---|---|---|---|
Liberal Democrats | David Antrobus * | 1,394 | 47.3% | -3.4% | |
Labour | Barbara Murray | 654 | 22.2 | -4.9 | |
Liberal | Catherine Hancox | 315 | 10.7 | +10.7 | |
Green | Alexander Rudkin | 239 | 8.1 | -0.1 | |
Conservative | Michael Bunter | 235 | 8.0 | +0.0 | |
Socialist Alliance | Mark Henzel | 111 | 3.8 | +3.8 | |
Majority | 740 | 25.1 | +1.5 | ||
Registered electors | |||||
Turnout | 2,948 | 21.1 | |||
Rejected ballots | |||||
Liberal Democrats hold | Swing | ||||
Party | Candidate | Votes | % | ±% | |
---|---|---|---|---|---|
Liberal Democrats | Veronica Best * | 1,599 | 52.3% | -2.9% | |
Labour | Laurence Freeman | 603 | 19.7 | +0.4 | |
Conservative | Mark Bill | 536 | 17.5 | +3.1 | |
Liberal | Christopher Hulme | 185 | 6.1 | -2.0 | |
Green | Andrew Hoban | 134 | 4.4 | +1.4 | |
Majority | 996 | 32.6 | -3.3 | ||
Registered electors | |||||
Turnout | 3,057 | 25.2 | |||
Rejected ballots | |||||
Liberal Democrats hold | Swing | ||||
Party | Candidate | Votes | % | ±% | |
---|---|---|---|---|---|
Liberal Democrats | Robert Quinn | 1,162 | 47.0% | -8.5% | |
Liberal | Michael Butler | 666 | 27.0 | +27.0 | |
Labour | Sheila Murphy | 416 | 16.8 | -8.1 | |
BNP | Joseph Owens | 150 | 6.1 | +6.1 | |
Socialist Alliance | Lesley Mahmood | 47 | 1.9 | +0.0 | |
Conservative | Alistair Furze | 30 | 1.2 | +1.2 | |
Majority | 496 | 20.0 | -10.6 | ||
Registered electors | |||||
Turnout | 2,471 | 24.4 | |||
Rejected ballots | |||||
Liberal Democrats hold | Swing | ||||
Party | Candidate | Votes | % | ±% | |
---|---|---|---|---|---|
Liberal Democrats | Mirna Juarez * | 1,141 | 61.2% | +7.5% | |
Labour | Anthony Murphy | 401 | 21.5 | -7.9 | |
Green | Donald Ross | 144 | 7.7 | +0.1 | |
Socialist Alliance | Ian Foulkes | 125 | 6.7 | +1.0 | |
Conservative | Ann Nugent | 53 | 2.8 | -0.6 | |
Majority | 740 | 39.7 | +15.4 | ||
Registered electors | |||||
Turnout | 1,864 | 16.7 | |||
Rejected ballots | |||||
Liberal Democrats hold | Swing | ||||
Party | Candidate | Votes | % | ±% | |
---|---|---|---|---|---|
Labour | John McIntosh | 972 | 66.4% | +2.9% | |
Liberal Democrats | James Gaskell | 314 | 21.4 | -5.0 | |
Liberal | Daniel Wood | 178 | 12.2 | +2.1 | |
Majority | 658 | 45.0 | +7.9 | ||
Registered electors | |||||
Turnout | 1,464 | 18.1 | |||
Rejected ballots | |||||
Labour hold | Swing | ||||
Party | Candidate | Votes | % | ±% | |
---|---|---|---|---|---|
Liberal Democrats | Christopher Newby | 1,244 | 54.9% | -5.3% | |
Labour | Peter Davidson | 796 | 35.1 | +4.9 | |
Socialist Alliance | John Ralph | 79 | 3.5 | +0.3 | |
Conservative | Keith Sutton | 77 | 3.4 | +0.8 | |
Liberal | Deborah Tilston | 71 | 3.1 | -0.8 | |
Majority | 448 | 19.8% | -10.2% | ||
Registered electors | |||||
Turnout | 2,267 | 19.8% | |||
Rejected ballots | |||||
Liberal Democrats hold | Swing | ||||
Party | Candidate | Votes | % | ±% | |
---|---|---|---|---|---|
Liberal Democrats | Trevor Jones | 2,344 | 68.8% | ||
Labour | Janet Kent | 623 | 18.3 | ||
Conservative | George Powell | 213 | 6.3 | ||
Green | Anne Saunders | 137 | 4.0 | ||
Liberal | Francis Porter | 88 | 2.6 | ||
Majority | 1,721 | 50.5 | |||
Registered electors | |||||
Turnout | 3,405 | 25.9 | |||
Rejected ballots | |||||
Liberal Democrats hold | Swing | ||||
Party | Candidate | Votes | % | ±% | |
---|---|---|---|---|---|
Liberal Democrats | Warren Bradley * | 3,135 | 80.1% | +6.8% | |
Labour | Robert Carney | 525 | 13.4 | -2.8 | |
Green | Eleanor Martin | 254 | 6.5 | +1.5 | |
Majority | 2,610 | 66.7 | +8.6 | ||
Registered electors | |||||
Turnout | 3,914 | 26.4% | |||
Rejected ballots | |||||
Liberal Democrats hold | Swing | ||||
Party | Candidate | Votes | % | ±% | |
---|---|---|---|---|---|
Labour | Rochne Gladden | 1,155 | 55.0% | +9.9% | |
Liberal Democrats | George Smith | 713 | 33.9 | +9.7 | |
Liberal | Paul Jones | 192 | 9.1 | -21.5 | |
Green | Eric Cartmel | 41 | 2.0 | +2.0 | |
Majority | 442 | 21.1 | +6.6 | ||
Registered electors | |||||
Turnout | 2,101 | 23.8 | |||
Rejected ballots | |||||
Labour hold | Swing | ||||
Party | Candidate | Votes | % | ±% | |
---|---|---|---|---|---|
Liberal Democrats | Marilyn Fielding | 1,642 | 64.4% | +7.3% | |
Labour | Patrick Delahunty | 856 | 33.6 | -6.1 | |
Liberal | Roger Webb | 51 | 2.0 | -1.2 | |
Majority | 786 | 28.8 | +11.4 | ||
Registered electors | |||||
Turnout | 2,549 | 23.7% | |||
Rejected ballots | |||||
Liberal Democrats hold | Swing | ||||
Party | Candidate | Votes | % | ±% | |
---|---|---|---|---|---|
Liberal Democrats | Norman Mills * | 2,070 | 66.2% | -2.7% | |
Labour | Peter Tuffley | 650 | 20.8 | -1.6 | |
Conservative | Geoffrey Brandwood | 237 | 7.6 | +1.8 | |
Green | Ian Graham | 89 | 2.8 | +2.8 | |
Liberal | Barbara Pickstock | 79 | 2.5 | -0.5 | |
Majority | 1,420 | 45.4 | -1.1 | ||
Registered electors | |||||
Turnout | 3,125 | 23.6% | |||
Rejected ballots | |||||
Liberal Democrats hold | Swing | ||||
Party | Candidate | Votes | % | ±% | |
---|---|---|---|---|---|
Liberal Democrats | John Coyne | 1,489 | 59.9% | ||
Labour | Jack Johhnson | 880 | 35.4 | ||
Conservative | David Patmore | 74 | 3.0 | ||
Liberal | David O'Brien | 42 | 1.7 | ||
Majority | 609 | 24.5 | |||
Registered electors | |||||
Turnout | 2,485 | 24.4% | |||
Rejected ballots | |||||
Liberal Democrats hold | Swing | ||||
Party | Candidate | Votes | % | ±% | |
---|---|---|---|---|---|
Liberal Democrats | Robert Ousby | 1,175 | 50.0% | +8.0% | |
Labour | Nicholas Small | 967 | 41.1 | -7.5 | |
Liberal | Tracey Hawksford | 134 | 5.7 | -0.8 | |
Conservative | Audrey Bowness | 75 | 3.2 | +0.2 | |
Majority | 208 | 8.9 | |||
Registered electors | |||||
Turnout | 2,351 | 25.2% | |||
Rejected ballots | |||||
Liberal Democrats hold | Swing | ||||
Party | Candidate | Votes | % | ±% | |
---|---|---|---|---|---|
Labour | Sharon Sullivan | 442 | 54.6% | -0.8% | |
Liverpool Labour Community Party | Alfred Hincks | 229 | 28.3% | +5.4% | |
Liberal Democrats | Eleanore Clein | 81 | 10.0% | -2.0% | |
Green | Justine Williams | 31 | 3.8% | +0.3% | |
Conservative | Catherine Hirst | 14 | 1.7% | -2.8% | |
Liberal | Beryl Ackers | 13 | 1.6% | -0.1% | |
Majority | 213 | 26.3% | -6.2% | ||
Registered electors | |||||
Turnout | 810 | 11.8% | |||
Rejected ballots | |||||
Labour hold | Swing | ||||
Party | Candidate | Votes | % | ±% | |
---|---|---|---|---|---|
Labour | Jack Spriggs | 1,432 | 70.5% | +2.1% | |
Liberal Democrats | Graham Seddon | 463 | 22.8 | -3.0 | |
Liberal | George roberts | 136 | 6.7 | +0.9 | |
Majority | 969 | 47.7 | +5.1 | ||
Registered electors | |||||
Turnout | 2,031 | 18.8% | |||
Rejected ballots | |||||
Labour hold | Swing | ||||
Party | Candidate | Votes | % | ±% | |
---|---|---|---|---|---|
Labour | Martin Cummins | 1,444 | 46.8% | -5.1% | |
Liberal Democrats | Patrick Moloney * | 1,418 | 45.9% | +7.6% | |
Conservative | Brian Jones | 103 | 3.3% | +0.7% | |
Liberal | Frances Fall | 83 | 2.7% | -2.3% | |
Green | Anne Graham | 38 | 1.2% | +1.2% | |
Majority | 26 | 0.9% | -12.7% | ||
Registered electors | |||||
Turnout | 3,086 | 22.8% | |||
Rejected ballots | |||||
Labour gain from Liberal Democrats | Swing | ||||
Party | Candidate | Votes | % | ±% | |
---|---|---|---|---|---|
Labour | Alan Dean | 694 | 56.9% | -15.1% | |
Liberal Democrats | Annette Butler | 264 | 21.7 | +6.0 | |
Socialist Alliance | Madeline Heneghan | 99 | 8.1 | +8.1 | |
Green | Jean Hill | 62 | 5.1 | -2.6 | |
Conservative | Kenneth Watkin | 53 | 4.3 | +1.6 | |
Liberal | Susan O'Brien | 47 | 3.9 | +2.0 | |
Majority | 430 | 35.2 | -21.1 | ||
Registered electors | |||||
Turnout | 1,219 | 15.3% | |||
Rejected ballots | |||||
Labour hold | Swing | ||||
Party | Candidate | Votes | % | ±% | |
---|---|---|---|---|---|
Liberal Democrats | Gerard Scott | 2,270 | 68.3% | +0.4% | |
Labour | Catherine Dooley | 526 | 15.8 | -2.3 | |
Conservative | Carl Cross | 251 | 7.6 | -1.5 | |
Green | Jennifer Brown | 185 | 5.6 | +1.8 | |
Liberal | Karen Williams | 92 | 2.8 | +1.7 | |
Majority | 1,744 | 52.5 | +2.7 | ||
Registered electors | |||||
Turnout | 3,324 | 27.7 | |||
Rejected ballots | |||||
Liberal Democrats hold | Swing | ||||
Party | Candidate | Votes | % | ±% | |
---|---|---|---|---|---|
Liberal Democrats | Frank Doran * | 1,220 | 56.7% | +5.7% | |
Labour | Michael Fox | 742 | 34.5 | -9.6 | |
BNP | Michael Shell | 92 | 4.3 | +4.3 | |
Green | Faye Griffiths | 45 | 2.1 | +2.1 | |
Conservative | Francis Dunne | 30 | 1.4 | -1.4 | |
Liberal | James Richardson | 23 | 1.1 | -1.0 | |
Majority | 478 | 22.2 | +15.3 | ||
Registered electors | |||||
Turnout | 2,152 | 21.5% | |||
Rejected ballots | |||||
Liberal Democrats hold | Swing | ||||
Party | Candidate | Votes | % | ±% | |
---|---|---|---|---|---|
Labour | Gary Booth | 1,340 | 85.2% | +25.2 | |
Liberal Democrats | Daniel Clein | 180 | 11.4 | -1.9 | |
Liberal | Vivienne Woodward | 53 | 3.4 | -2.4 | |
Majority | 1,160 | 73.8 | +34.8 | ||
Registered electors | |||||
Turnout | 1,573 | 17.1 | |||
Rejected ballots | |||||
Labour hold | Swing | ||||
Party | Candidate | Votes | % | ±% | |
---|---|---|---|---|---|
Liberal Democrats | Thomas Marshall | 837 | 51.7% | +13.9% | |
Labour | Oliver Martins | 747 | 46.3 | -9.6 | |
Conservative | Joyce Larrosa | 22 | 1.4 | -0.2 | |
Liberal | Jean Worrall | 9 | 0.6 | +0.6 | |
Majority | 87 | 5.4 | |||
Registered electors | |||||
Turnout | 1,612 | 28.5% | |||
Rejected ballots | |||||
Liberal Democrats hold | Swing | ||||
Party | Candidate | Votes | % | ±% | |
---|---|---|---|---|---|
Liberal Democrats | Keith Turner | 1,404 | 68% | ||
Labour | John McCabe | 476 | 23.2 | -3.4 | |
Liberal | Edith Bamford | 100 | 4.9 | +1.3 | |
Conservative | Francis Stevens | 75 | 3.6 | -0.5 | |
Majority | 928 | 45.1 | +6.0 | ||
Registered electors | |||||
Turnout | 2,055 | 20.9% | |||
Rejected ballots | |||||
Liberal Democrats hold | Swing | ||||
Party | Candidate | Votes | % | ±% | |
---|---|---|---|---|---|
Liberal Democrats | Erica Kemp * | 1,465 | 72.0% | +8.7% | |
Labour | Angela Glanville | 413 | 20.3 | -9.6 | |
Green | Jennifer Andrew | 113 | 5.6 | +0.9 | |
Conservative | Ann Temple | 43 | 2.1 | -0.1 | |
Majority | 1,052 | 51.7 | +18.3 | ||
Registered electors | |||||
Turnout | 2,034 | 19.0% | |||
Rejected ballots | |||||
Liberal Democrats hold | Swing | ||||
Party | Candidate | Votes | % | ±% | |
---|---|---|---|---|---|
Labour | Francis Cooke | 1,038 | 65% | ||
Labour | Alan Walker | 932 | 58% | ||
Liberal Democrats | Susan Lye | 210 | 13% | ||
Liberal Democrats | Kelly Woods | 177 | 11% | -18.2 | |
Conservative | Mark Cotterell | 157 | 11% | +5.3 | |
Liberal | Charles Mayes | 123 | 8% | ||
Conservative | Natalie Linnane | 113 | 7% | ||
Liberal | Irene Mayes | 109 | 7% | ||
Green | Laura Jackson | 61 | 4% | ||
Green | Gerard Quayle | 37 | 2% | ||
Majority | 828 | ||||
Registered electors | |||||
Turnout | 2,957 | 16.2% | |||
Rejected ballots | |||||
Labour hold | Swing | ||||
Party | Candidate | Votes | % | ±% | |
---|---|---|---|---|---|
Liberal Democrats | Richard Oglethorpe | 1,280 | 65.5% | +6.4% | |
Labour | Rodger Lafferty | 464 | 23.8 | -5.9 | |
BNP | Raymond Malone | 120 | 6.1 | +0.3 | |
Liberal | Michael Williams | 49 | 2.5 | -1.0 | |
Conservative | Derek Nuttall | 40 | 2.0 | +0.2 | |
Majority | 816 | 41.7 | +12.3 | ||
Registered electors | |||||
Turnout | 1,953 | 22.0% | |||
Rejected ballots | |||||
Liberal Democrats hold | Swing | ||||
Party | Candidate | Votes | % | ±% | |
---|---|---|---|---|---|
Liberal Democrats | Andrew Makinson | 893 | 57.7% | +21.6% | |
Labour | Richard Keenan | 495 | 32.0 | -17.6 | |
Green | Simon Holgate | 89 | 5.7 | +3.7 | |
Liberal | John Moore | 40 | 2.6 | +0.2 | |
Conservative | Grahame Harden | 32 | 2.1 | +0.8 | |
Majority | 398 | 25.7 | |||
Registered electors | |||||
Turnout | 1,549 | 18.5 | |||
Rejected ballots | |||||
Liberal Democrats hold | Swing | ||||
Party | Candidate | Votes | % | ±% | |
---|---|---|---|---|---|
Labour | Doreen Knight | 651 | '51.3% | +2.1% | |
Liberal Democrats | George Smith | 600 | 47.3 | -1.3 | |
Conservative | Denise Nuttall | 18 | 1.4 | -0.8 | |
Majority | 51 | 4.0 | +3.4 | ||
Registered electors | |||||
Turnout | 1,269 | 20.6% | |||
Rejected ballots | |||||
Liberal Democrats hold | Swing | ||||
Party | Candidate | Votes | % | ±% | |
---|---|---|---|---|---|
Liberal | Christopher Lenton | 1,667 | 71.9% | +0.4% | |
Labour | Pamela Thomas | 405 | 17.5 | +2.0 | |
Liberal Democrats | James Woods | 188 | 8.1 | -1.1 | |
Conservative | June Brandwood | 60 | 2.6 | +0.5 | |
Majority | 1,262 | 54.4 | -1.6 | ||
Registered electors | |||||
Turnout | 2,320 | 21.0% | |||
Rejected ballots | |||||
Liberal hold | Swing | ||||
Party | Candidate | Votes | % | ±% | |
---|---|---|---|---|---|
Liberal Democrats | Francis O'Donoghue | 936 | 50.8% | -5.6% | |
Labour | Christopher Nezianya | 768 | 41.7 | +5.7 | |
Green | Vera Jones | 56 | 3.0 | +3.0 | |
Liberal | Deborah Mayes | 50 | 2.7 | +1.4 | |
Conservative | Norman Coppell | 31 | 1.7 | -0.8 | |
Majority | 168 | 9.1 | -11.3 | ||
Registered electors | |||||
Turnout | 1,841 | 26.0% | |||
Rejected ballots | |||||
Liberal Democrats hold | Swing | ||||
Party | Candidate | Votes | % | ±% | |
---|---|---|---|---|---|
Liverpool Labour Community Party | Pauline Connolly * | 805 | 53.0% | +53.0% | |
Labour | Christine Norris | 633 | 41.7% | -45.8% | |
Liberal Democrats | Sean McHugh | 34 | 2.2% | -6.6% | |
Liberal | Damien Daly | 23 | 1.5% | +1.5% | |
Conservative | Alma McGing | 12 | 0.8% | -1.0% | |
Green | Anja Ploger | 12 | 0.8% | -1.0% | |
Majority | 172 | 11.3% | |||
Registered electors | |||||
Turnout | 1,519 | 29.3% | |||
Rejected ballots | |||||
Liverpool Labour Community Party gain from Labour | |||||
Party | Candidate | Votes | % | ±% | |
---|---|---|---|---|---|
Liberal Democrats | Jean Seddon | 1,317 | 49.6% | -12.6% | |
Labour | James Gabriel | 1,029 | 38.8 | +4.0 | |
Liberal | Linda Roberts | 307 | 11.6 | +8.6 | |
Majority | 288 | 10.8 | -16.6 | ||
Registered electors | |||||
Turnout | 2,653 | 19.4% | |||
Rejected ballots | |||||
Liberal Democrats hold | Swing | ||||
Party | Candidate | Votes | % | ±% | |
---|---|---|---|---|---|
Liberal Democrats | Barbara Mace | 2,186 | 68.4% | +1.8% | |
Conservative | Stephen Fitzsimmons | 411 | 12.9 | -3.9 | |
Labour | Francis Steer | 392 | 12.3 | -0.4 | |
Liberal | Maria Langley | 112 | 3.5 | +2.4 | |
Green | Naomi Rose | 96 | 3.0 | +0.3 | |
Majority | 1,775 | 55.5 | +5.7 | ||
Registered electors | |||||
Turnout | 3,197 | 26.6 | |||
Rejected ballots | |||||
Liberal Democrats hold | Swing | ||||
In the context of local authorities in the United Kingdom, the term no overall control refers to a situation in which no single political group achieves a majority of seats, analogous to a hung parliament. Of the 248 councils who had members up for election in the 2019 local elections, 73 resulted in a NOC administration. In the 2021 election, 14 resulted in no overall control.
The 1998 Barnet Council election took place on 7 May 1998 to elect members of Barnet London Borough Council in London, England. The whole council was up for election and the council stayed under no overall control.
Oxfordshire County Council is elected every four years.
Elections to Bolton Metropolitan Borough Council were held on 1 May 2003. One third of the council was up for election and the Labour party lost overall control of the council to no overall control, for the first time since 1980. The Labour party continued to run the council in a minority administration.
Elections to Trafford Council were held on 1 May 2003. One third of the council was up for election, with each successful candidate to serve a one-year term of office, expiring in 2004 due to the boundary changes and 'all-out' elections due to take place that year. The Labour Party lost overall control of the council, to no overall control. Overall turnout was 52.3%.
Elections to Bromley Council in England were held on 7 May 1998. The whole council was up for election and the Conservative party lost overall control of the council to no overall control.
The 2002 Harlow District Council election took place on 2 May 2002 to elect members of Harlow District Council in Essex, England. The whole council was up for election with boundary changes since the last election in 2000 reducing the number of seats by 9. The Labour party lost overall control of the council to no overall control.
Elections to Stockport Metropolitan Borough Council were held on 3 May 2007. One third of the council was up for election. The Liberal Democrats retained overall control of the council with a majority of 9 councillors. The overall turnout was 36.7%.
The 2007 Thurrock Council election took place on 3 May 2007 to elect members of Thurrock Council in Essex, England. One third of the council was up for election and the Conservative party lost overall control of the council to no overall control.
Elections to Calderdale Metropolitan Borough Council were held on 6 May 1999. One third of the council was up for election and the Labour party lost overall control of the council to no overall control. The overall turnout of the election was 30.09%. The winning candidate in each ward is highlighted in bold.
Elections to Dacorum Borough Council in Hertfordshire, England were held on 6 May 1999. The election in Highfield St Paul was delayed after the death of a Conservative candidate until a by-election was held on 3 June. The whole council was up for election with boundary changes since the Dacorum Council election, 1995|last election in 1995 reducing the number of seats by 6. The Conservative party gained overall control of the council from no overall control, although it would fall back to no overall control after the by-election in June.
The 2007 Salford City Council election took place on 3 May 2007 to elect members of Salford City Council in England. One third of the council was up for election and the Labour party kept overall control of the council. Overall turnout was 29.36%.
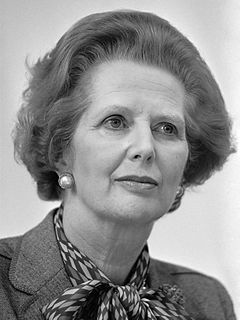
Local elections were held in the United Kingdom on 3 May 1979. The results provided some source of comfort to the Labour Party, who recovered some lost ground from local election reversals in previous years, despite losing the general election to the Conservative Party on the same day. The Liberals also gained councillors and a council.
The 1964 Croydon Council election took place on 7 May 1964 to elect members of Croydon London Borough Council in London, England. The whole council was up for election and the council went into no overall control.
The 1964 Havering Council election took place on 7 May 1964 to elect members of Havering London Borough Council in London, England. The whole council was up for election and the council went into no overall control.
The 1964 Merton Council election took place on 7 May 1964 to elect members of Merton London Borough Council in London, England. The whole council was up for election and the council went into no overall control.
The 1994 Hammersmith and Fulham Council election took place on 5 May 1994 to elect members of Hammersmith and Fulham London Borough Council in London, England. The whole council was up for election and the Labour party regained overall control of the council, which it had lost during the previous council term.
Elections for the London Borough of Merton were held on 3 May 1990 to elect members of Merton London Borough Council in London, England. This was on the same day as other local elections in England and Scotland.
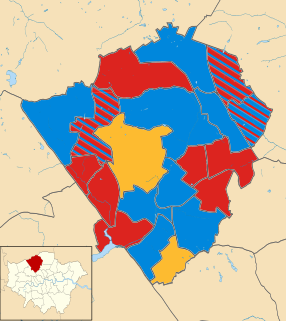
The 2018 Trafford Metropolitan Borough Council election to elect members of Trafford Metropolitan Borough Council in England took place on 3 May 2018. This was on the same day as other local elections.
Local elections in the United Kingdom will be held on 5 May 2022. These will include elections for all London borough councils, and for all local authorities in Wales and Scotland. Most seats in England were last up for election in 2018 and in Scotland and Wales in 2017. The elections are likely to coincide with the 2022 Northern Ireland Assembly election.