2003 Stevenage Borough Council election

Last updated

2003 Stevenage Borough Council election
Flag of England.svg
  2002 1 May 2003 2004  

13 of the 39 seats to Stevenage Borough Council
20 seats needed for a majority
 First partySecond partyThird party
 
Party Labour Conservative Liberal Democrats
Seats before3333
Seats won1111
Seats after3333
Seat changeSteady2.svgSteady2.svgSteady2.svg
Popular vote14,5427,7337,659
Percentage47.7%25.4%25.1%

Stevenage UK local election 2012 map.svg
Map showing the results of contested wards in the 2003 Stevenage Borough Council elections.

Council control before election

Labour

Council control after election

Labour

Elections to Stevenage Council in Hertfordshire, England were held on 1 May 2003. One third of the council was up for election; the seats of the candidates who finished first in each ward in the all-out election of 1999. The Labour Party stayed in overall control of the council, [1] as had been predicted before the election. [2] Overall turnout was 52.2%. [3]

Contents

After the election, the composition of the council was:

Election result

Stevenage Local Election Result 2003
PartySeatsGainsLossesNet gain/lossSeats %Votes %Votes+/−
  Labour 11084.647.714,542-5.5%
  Liberal Democrats 107.725.47,733+6.7%
  Conservative 107.725.17,659-1.0%
  Green 0001.4431-0.3%
  Socialist Alternative 0000.4112+0.0%

Ward results

Bandley Hill

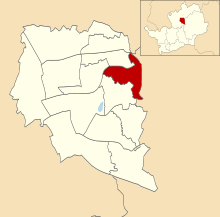
Location of Bandley Hill ward Bandley Hill ward in Stevenage 1999.svg
Location of Bandley Hill ward
Bandley Hill
PartyCandidateVotes%±%
Labour Jacqueline Hollywell 1,174 52.2 -13.8
Conservative Freda Warner65028.9-5.1
Liberal Democrats Sean McManus42518.9+18.9
Majority52423.3-8.7
Turnout 2,24947.0

Bedwell

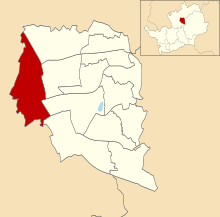
Location of Bedwell ward Bedwell ward in Stevenage 1999.svg
Location of Bedwell ward
Bedwell
PartyCandidateVotes%±%
Labour Elizabeth Harrington 1,398 59.5 -4.7
Conservative Galina Dimelow44018.7+0.9
Liberal Democrats John Meacham39917.0+3.6
Socialist Alternative Stephen Glennon1124.8+0.2
Majority95840.8-5.6
Turnout 2,34950.3

Chells

Location of Chells ward Chells ward in Stevenage 1999.svg
Location of Chells ward
Chells
PartyCandidateVotes%±%
Labour Kenneth Vale 1,307 51.9 -0.7
Liberal Democrats Leonard Lambert82232.7+3.2
Conservative Ralph Dimelow38715.4-2.6
Majority48519.2-3.9
Turnout 2,51655.6

Longmeadow

Location of Longmeadow ward Longmeadow ward in Stevenage 1999.svg
Location of Longmeadow ward
Longmeadow
PartyCandidateVotes%±%
Labour Patricia Webb 1,072 46.6 -2.8
Conservative Matthew Hurst64628.1+3.3
Liberal Democrats Ralph Baskerville58225.3+6.6
Majority42618.5-6.1
Turnout 2,30051.8

Manor

Location of Manor ward Manor ward in Stevenage 1999.svg
Location of Manor ward
Manor
PartyCandidateVotes%±%
Liberal Democrats Robin Parker 1,859 66.3 +12.3
Labour Gordana Bjelic-Rados47216.8-9.1
Conservative Dilys Clark47216.8-3.3
Majority1,38749.5+21.4
Turnout 2,80358.0

Martins Wood

Location of Martins Wood ward Martins Wood ward in Stevenage 1999.svg
Location of Martins Wood ward
Martins Wood
PartyCandidateVotes%±%
Labour Michael Patston 958 42.8 -7.8
Conservative Matthew Wyatt66429.6+1.8
Liberal Democrats Barbara Segadelli40418.0+3.3
Green Ian Murrill2149.6+2.6
Majority29413.2-9.6
Turnout 2,24049.0

Old Town

Location of Old Town ward Old Town ward in Stevenage 1999.svg
Location of Old Town ward
Old Town
PartyCandidateVotes%±%
Labour Michael Downing 1,256 46.4 -4.3
Conservative Jody Hanafin74927.7-1.3
Liberal Democrats Jennifer Moorcroft48417.9+4.3
Green Bernard Chapman2178.0+1.3
Majority50718.7-3.0
Turnout 2,70657.3

Pin Green

Location of Pin Green ward Pin Green ward in Stevenage 1999.svg
Location of Pin Green ward
Pin Green
PartyCandidateVotes%±%
Labour Reginald Smith 1,237 54.0 -5.3
Conservative Mollie Cawthorn56424.6+1.0
Liberal Democrats Mary Griffith48821.3+4.2
Majority67329.4-6.3
Turnout 2,28952.2

Roebuck

Location of Roebuck ward Roebuck ward in Stevenage 1999.svg
Location of Roebuck ward
Roebuck
PartyCandidateVotes%±%
Labour John Gardner 1,094 49.7 -4.2
Conservative Anita Speight56325.6-0.2
Liberal Democrats Gordon Knight54424.7+4.5
Majority43124.1-4.0
Turnout 2,20149.0

St Nicholas

Location of St Nicholas ward St Nicholas ward in Stevenage 1999.svg
Location of St Nicholas ward
St Nicholas
PartyCandidateVotes%±%
Labour John Raynor 989 48.5 -5.8
Liberal Democrats Heather Snell54026.5+3.8
Conservative Claire Halling51225.1+2.1
Majority44922.0-9.3
Turnout 2,04147.0

Shephall

Location of Shephall ward Shephall ward in Stevenage 1999.svg
Location of Shephall ward
Shephall
PartyCandidateVotes%±%
Labour Brian Hall 1,389 61.2 -2.0
Liberal Democrats Nicholas Baskerville44119.4+1.6
Conservative Leslie Clark44019.4+0.4
Majority94841.8-2.4
Turnout 2,27051.7

Symonds Green

Location of Symonds Green ward Symonds Green ward in Stevenage 1999.svg
Location of Symonds Green ward
Symonds Green
PartyCandidateVotes%±%
Labour Patrick Kissane 1,436 60.5 -4.1
Conservative Louisa Notley58224.5-10.9
Liberal Democrats Katherine Lloyd35414.9+14.9
Majority85436.0+6.8
Turnout 2,37253.7

Woodfield

Location of Woodfield ward Woodfield ward in Stevenage 1999.svg
Location of Woodfield ward
Woodfield
PartyCandidateVotes%±%
Conservative Graham Clark 990 46.2 +1.0
Labour John Lloyd76035.5-3.4
Liberal Democrats Audrey Griffith39118.3+2.4
Majority23010.7+4.4
Turnout 2,14156.3

Related Research Articles

<span class="mw-page-title-main">East Hertfordshire</span> Non-metropolitan district in England

East Hertfordshire is a local government district in Hertfordshire, England. Its council is based in Hertford, the county town of Hertfordshire. The largest town in the district is Bishop's Stortford, and the other main towns are Ware, Buntingford and Sawbridgeworth. At the 2011 Census, the population of the district was 137,687.

<span class="mw-page-title-main">Stevenage (UK Parliament constituency)</span> Parliamentary constituency in the United Kingdom, 1983 onwards

Stevenage is a constituency represented in the House of Commons of the UK Parliament since 2010 by Stephen McPartland, a Conservative.

Dacorum Borough Council in Hertfordshire, England is elected every four years. Since the last boundary changes in 2007, 51 councillors have been elected from 25 wards.

Hertfordshire County Council in England is elected every four years. Since the last boundary changes, that took effect for the 2001 election, 77 councillors are elected for single member districts.

One third of Stevenage Borough Council in Hertfordshire, England is elected each year, followed by one year when there is an election to Hertfordshire County Council instead.
<span class="mw-page-title-main">2000 Stevenage Borough Council election</span>

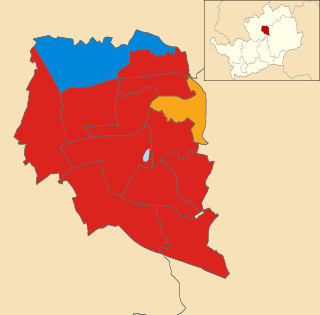
Elections to Stevenage Council in Hertfordshire, England were held on 4 May 2000. One third of the council was up for election; the seats of the candidates who finished third in each ward in the all-out election of 1999. The Labour Party stayed in overall control of the council, which it had held continuously since its creation in 1973.
<span class="mw-page-title-main">2008 Tamworth Borough Council election</span>

The 2008 Tamworth Borough Council election took place on 1 May 2008 to elect members of Tamworth Borough Council in Staffordshire, England. One third of the council was up for election and the Conservative Party stayed in overall control of the council.

<span class="mw-page-title-main">Stevenage Borough Council</span>

Stevenage Borough Council (SBC) is the local authority for the Stevenage non-metropolitan district of England, the United Kingdom. Stevenage is located in the north-east of Hertfordshire, in the East of England region.

Hertsmere Borough Council elects all its councillors on a four-year cycle, with the next elections in 2023. Since the last boundary changes in 1999, 39 councillors have been elected from 15 wards.
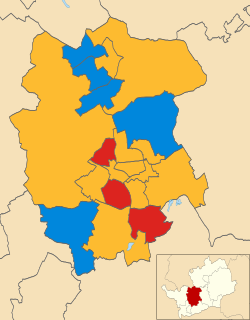
<span class="mw-page-title-main">2003 St Albans City and District Council election</span>

The 2003 St Albans City and District Council election took place on 1 May 2003 to elect members of St Albans District Council in Hertfordshire, England. One third of the council was up for election and the council stayed under no overall control.

<span class="mw-page-title-main">2004 St Albans City and District Council election</span>

The 2004 St Albans City and District Council election took place on 10 June 2004 to elect members of St Albans District Council in Hertfordshire, England. One third of the council was up for election and the council stayed under no overall control.
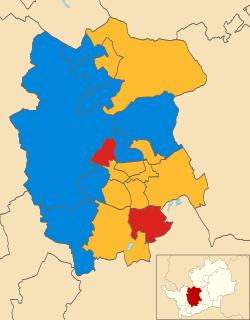
<span class="mw-page-title-main">2006 St Albans City and District Council election</span>

The 2006 St Albans City and District Council election took place on 4 May 2006 to elect members of St Albans District Council in Hertfordshire, England. One third of the council was up for election and the Liberal Democrats gained overall control of the council from no overall control.

<span class="mw-page-title-main">2003 Woking Borough Council election</span>

The 2003 Woking Council election took place on 1 May 2003 to elect members of Woking Borough Council in Surrey, England. One third of the council was up for election and the council stayed under no overall control.

The 2004 Welwyn Hatfield District Council election took place on 10 June 2004 to elect members of Welwyn Hatfield District Council in Hertfordshire, England. One third of the council was up for election and the Conservative Party stayed in overall control of the council.

The 2006 Welwyn Hatfield District Council election took place on 4 May 2006 to elect members of Welwyn Hatfield District Council in Hertfordshire, England. One third of the council was up for election and the Conservative Party stayed in overall control of the council.

The 2007 Welwyn Hatfield Borough Council election took place on 3 May 2007 to elect members of Welwyn Hatfield Borough Council in Hertfordshire, England. One third of the council was up for election and the Conservative Party stayed in overall control of the council.

<span class="mw-page-title-main">2011 Broxtowe Borough Council election</span>

Elections to Broxtowe Borough Council were held on 5 May 2011 to elect all 44 members to the Council.

<span class="mw-page-title-main">2002 Hertsmere Borough Council election</span>

The 2002 Hertsmere Borough Council election took place on 2 May 2002 to elect members of Hertsmere Borough Council in Hertfordshire, England. One third of the council was up for election and the Conservative Party stayed in overall control of the council.

<span class="mw-page-title-main">2003 Hertsmere Borough Council election</span>

The 2003 Hertsmere Borough Council election took place on 1 May 2003 to elect members of Hertsmere Borough Council in Hertfordshire, England. One third of the council was up for election and the Conservative Party stayed in overall control of the council.

References

  1. "Luton upset for Labour". BBC Online . 2 May 2003. Retrieved 8 July 2008.
  2. "Stage set for eastern drama". BBC Online . 7 April 2003. Retrieved 8 July 2008.
  3. "Borough Council Elections - 1st May 2003: Election Results". Stevenage Borough Council. Retrieved 8 July 2008.