2007 Welwyn Hatfield Borough Council election

Last updated

The 2007 Welwyn Hatfield Borough Council election took place on 3 May 2007 to elect members of Welwyn Hatfield Borough Council in Hertfordshire, England. One third of the council was up for election and the Conservative Party stayed in overall control of the council. [1]

Contents

After the election, the composition of the council was:

Election result

The results saw the Conservatives increase their majority after gaining 3 seats, which they described as an endorsement of their record in control of the council. [3] They gained 2 seats from Labour in Haldens and Hatfield South wards, while the Liberal Democrats failed to pick up any seats. [3] The third Conservative gain came in Howlands ward, where they defeated Green councillor Jill Weston, [3] who had defected from Labour in 2004. [4] Overall turnout in the election was 33.03%, [5] while dropping as low as 24% in some wards. [3]

Among the Conservative winners in the election were Hannah Berry and Paul Smith, who became the youngest councillors in the council's history at the ages of 18 and 20 respectively, after a recent change in the law had permitted under 21s to stand for election. [6]

Welwyn Hatfield Local Election Result 2007 [5] [7]
PartySeatsGainsLossesNet gain/lossSeats %Votes %Votes+/−
  Conservative 1330+381.354.612,161-1.2%
  Labour 302-218.825.15,592+2.6%
  Liberal Democrats 0000016.73,729-4.4%
  Green 001-103.6805+3.0%

One Conservative candidate was unopposed in the election. [5]

Ward results

Brookmans Park & Little Heath [5]
PartyCandidateVotes%±%
Conservative Stephen Boulton1,47181.4+1.0
Liberal Democrats Jenny Blumsom1256.9-7.2
Green Kevin Pressland1146.3+6.3
Labour Cathy Watson985.4-0.1
Majority1,34674.5+8.2
Turnout 1,80840.4-5.1
Conservative hold Swing
Haldens [5]
PartyCandidateVotes%±%
Conservative Jon Beckerman69346.4+4.7
Labour Mike Larkins57838.7+4.9
Liberal Democrats Louise Lotz22415.0-9.5
Majority1157.7-0.2
Turnout 1,49533.9-1.6
Conservative gain from Labour Swing
Handside [5]
PartyCandidateVotes%±%
Conservative Helen Bromley1,19448.7+4.6
Liberal Democrats Malcolm Cowan1,04442.6-2.4
Labour Sheila Jones2138.7-2.2
Majority1506.1
Turnout 2,45149.0-1.0
Conservative hold Swing
Hatfield Central [5]
PartyCandidateVotes%±%
Labour Maureen Cook47738.7-2.4
Conservative Doug Berry46137.4+3.9
Liberal Democrats Simon Archer29423.9-1.5
Majority161.3-6.3
Turnout 1,23229.4-2.0
Labour hold Swing
Hatfield East [5]
PartyCandidateVotes%±%
Conservative Mick Long72557.0+0.9
Labour Constance Elliott32225.3+3.4
Liberal Democrats Lis Meyland-Smith22517.7-4.3
Majority40331.7-2.4
Turnout 1,27228.8-8.3
Conservative hold Swing
Hatfield North [5]
PartyCandidateVotes%±%
Conservative Howard Morgan92056.2+1.1
Labour Margaret White45427.7+0.4
Liberal Democrats Neil Ross26316.1-1.5
Majority46628.5+0.7
Turnout 1,63724.1-8.3
Conservative hold Swing
Hatfield South [5]
PartyCandidateVotes%±%
Conservative Paul Smith29643.2+12.5
Labour Tony Wilder29442.9-7.2
Liberal Democrats Nigel Bain9513.9-5.4
Majority20.3
Turnout 68524.5-5.2
Conservative gain from Labour Swing
Hatfield West [5]
PartyCandidateVotes%±%
Conservative Kim Morris60854.0+4.3
Labour Sheila Wilder34130.3-4.6
Liberal Democrats Sheila Archer17715.7+0.3
Majority26723.7+8.9
Turnout 1,12625.8-11.9
Conservative hold Swing
Hollybush [5]
PartyCandidateVotes%±%
Labour Lynn Chesterman73350.5+5.7
Conservative Peter Knell71849.5+11.7
Majority151.0-6.0
Turnout 1,45129.7-1.0
Labour hold Swing
Howlands [5]
PartyCandidateVotes%±%
Conservative Hannah Berry78846.6+0.9
Green Jill Weston46627.6+17.9
Labour Alan Chesterman43725.8-9.5
Majority32219.0+8.6
Turnout 1,69136.8-4.3
Conservative gain from Green Swing
Northaw [5]
PartyCandidateVotes%±%
Conservative John Mansfieldunopposed
Conservative hold Swing
Panshanger [5]
PartyCandidateVotes%±%
Conservative Darren Bennett82955.3-1.5
Labour Dean Milliken41627.7+2.0
Liberal Democrats Shirley Shaw17511.7-5.8
Green Liz Verlander805.3+5.3
Majority41327.6-3.5
Turnout 1,50031.4-2.1
Conservative hold Swing
Peartree [5]
PartyCandidateVotes%±%
Labour Steve Roberts45939.9+3.4
Liberal Democrats Frank Marsh36131.4-4.6
Conservative Christopher Hay33128.8+1.3
Majority988.5+8.0
Turnout 1,15124.1-3.2
Labour hold Swing
Sherrards [5]
PartyCandidateVotes%±%
Conservative John Burnapp1,01455.3+0.8
Labour Tony Crump42723.3-5.0
Liberal Democrats Jonathan Arch24913.6-3.6
Green Berenice Dowlen1457.9+7.9
Majority58732.0+5.8
Turnout 1,83543.1-4.2
Conservative hold Swing
Welwyn North [5]
PartyCandidateVotes%±%
Conservative Julie Cragg97476.5+4.2
Liberal Democrats John Blackburn18514.5-3.1
Labour Bridgit Croft1149.0-1.1
Majority78962.0+7.3
Turnout 1,27336.8-2.7
Conservative hold Swing
Welwyn South [5]
PartyCandidateVotes%±%
Conservative Andrew Canter1,13967.8
Liberal Democrats Ian Skidmore31218.6
Labour Julia Henderson22913.6
Majority82749.2
Turnout 1,68039.4-2.6
Conservative hold Swing

Related Research Articles

<span class="mw-page-title-main">Welwyn Hatfield</span> District in Hertfordshire, England

Welwyn Hatfield is a local government district with borough status in the county of Hertfordshire, England. Its council is based in Welwyn Garden City. The borough borders Hertsmere, St Albans, North Hertfordshire, East Hertfordshire, Broxbourne, and the London Borough of Enfield.

<span class="mw-page-title-main">St Albans (UK Parliament constituency)</span> Parliamentary constituency in the United Kingdom, 1801-1852 & 1885 onwards

St Albans is a constituency represented in the House of Commons of the UK Parliament since 2019 by Daisy Cooper, a Liberal Democrat.

One third of Welwyn Hatfield Borough Council in Hertfordshire, England is elected each year, followed by one year without election. Since the last boundary changes in 2016 the council has comprised 48 councillors representing 16 wards, each of which elects three councillors.

<span class="mw-page-title-main">2008 St Albans City and District Council election</span>

The 2008 St Albans City and District Council election took place on 1 May 2008 to elect members of St Albans District Council in Hertfordshire, England. One third of the council was up for election and the Liberal Democrats gained overall control of the council from no overall control.

The 1998 St Albans City and District Council election took place on 7 May 1998 to elect members of St Albans City and District Council in Hertfordshire, England. One third of the council was up for election and the Liberal Democrats stayed in overall control of the council.

<span class="mw-page-title-main">2004 St Albans City and District Council election</span>

The 2004 St Albans City and District Council election took place on 10 June 2004 to elect members of St Albans District Council in Hertfordshire, England. One third of the council was up for election and the council stayed under no overall control.

<span class="mw-page-title-main">2006 St Albans City and District Council election</span>

The 2006 St Albans City and District Council election took place on 4 May 2006 to elect members of St Albans District Council in Hertfordshire, England. One third of the council was up for election and the Liberal Democrats gained overall control of the council from no overall control.

<span class="mw-page-title-main">2007 St Albans City and District Council election</span>

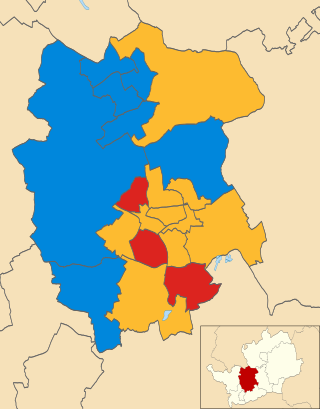
The 2007 St Albans City and District Council election took place on 3 May 2007 to elect members of St Albans District Council in Hertfordshire, England. One third of the council was up for election and the Liberal Democrats lost overall control of the council to no overall control.

The 2002 Welwyn Hatfield District Council election took place on 2 May 2002 to elect members of Welwyn Hatfield District Council in Hertfordshire, England. One third of the council was up for election and the Conservative Party gained overall control of the council from the Labour Party.

The 2004 Welwyn Hatfield District Council election took place on 10 June 2004 to elect members of Welwyn Hatfield District Council in Hertfordshire, England. One third of the council was up for election and the Conservative Party stayed in overall control of the council.

The 2006 Welwyn Hatfield District Council election took place on 4 May 2006 to elect members of Welwyn Hatfield District Council in Hertfordshire, England. One third of the council was up for election and the Conservative Party stayed in overall control of the council.

The 2008 Welwyn Hatfield Borough Council election took place on 1 May 2008 to elect members of Welwyn Hatfield Borough Council in Hertfordshire, England. The whole council was up for election with boundary changes since the last election in 2007. The Conservative Party stayed in overall control of the council.

<span class="mw-page-title-main">2010 St Albans City and District Council election</span>

The 2010 St Albans City and District Council election took place on 6 May 2010 to elect members of St Albans District Council in Hertfordshire, England. One third of the council was up for election and the Liberal Democrats stayed in overall control of the council.

<span class="mw-page-title-main">2012 St Albans City and District Council election</span> 2012 UK local government election

The 2012 St Albans City and District Council election took place on 3 May 2012 to elect members of St Albans District Council in Hertfordshire, England. One third of the council was up for election and the council stayed under no overall control.

<span class="mw-page-title-main">2011 St Albans City and District Council election</span>

The 2011 St Albans City and District Council election took place on 5 May 2011 to elect members of St Albans District Council in Hertfordshire, England. One third of the council was up for election and the Liberal Democrats lost overall control of the council to no overall control.

<span class="mw-page-title-main">2014 St Albans City and District Council election</span>

The 2014 St Albans City and District Council election took place on 22 May 2014 to elect members of St Albans District Council in Hertfordshire, England. One third of the council was up for election and the council stayed under no overall control.

<span class="mw-page-title-main">2010 Brent London Borough Council election</span> 2010 local election in England

The 2010 Brent London Borough Council election took place on 6 May 2010 to elect members of Brent London Borough Council in London, England. The whole council was up for election and the Labour Party gained overall control of the council from no overall control.

<span class="mw-page-title-main">2014 Brent London Borough Council election</span> 2014 local election in England

The 2014 Brent London Borough Council election took place on 22 May 2014 to elect members of Brent London Borough Council in London, England. The whole council was up for election and the Labour Party stayed in overall control of the council.

<span class="mw-page-title-main">2021 Hertfordshire County Council election</span>

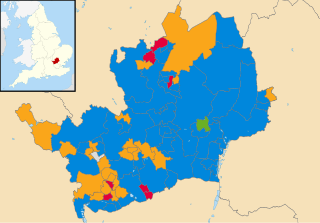
Elections to Hertfordshire County Council took place on 6 May 2021 alongside other local elections in the United Kingdom. All 78 seats to the council were elected.

References

  1. "Welwyn Hatfield". BBC News Online . Retrieved 9 March 2010.
  2. "National: Elections 2007: Town and country go to the polls". The Guardian . 4 May 2007. p. 6.
  3. 1 2 3 4 "Tories tighten grip in borough". St Albans & Harpenden Review. 4 May 2007. Retrieved 10 March 2010.
  4. "Councillor defects to Green Party". Watford Observer . 14 December 2004. Retrieved 10 March 2010.
  5. 1 2 3 4 5 6 7 8 9 10 11 12 13 14 15 16 17 18 19 "Election Results - 3 May 2007". Welwyn Hatfield Borough Council. Retrieved 9 March 2010.
  6. "Record breaking councillors". St Albans & Harpenden Review. 14 May 2007. Retrieved 10 March 2010.
  7. "Results". The Times . 5 May 2007. p. 83.