2007 Manchester City Council election

Last updated

Map of the results of the 2007 Manchester council election. Labour in red and the Liberal Democrats in yellow. Manchester UK local election 2007 map.svg
Map of the results of the 2007 Manchester council election. Labour in red and the Liberal Democrats in yellow.

Elections to Manchester City Council took place on 3 May 2007. One third of the council was up for election, with each successful candidate to serve a four-year term of office, expiring in 2011. The council stayed under Labour Party control, on a reduced turnout of 28.3%. [1] [2]

Contents

Election result

Changes compared to the 2006 election.

Manchester Council Election Result [2]
PartyThis electionFull councilThis election
SeatsNetSeats %OtherTotalTotal %VotesVotes %+/−
  Labour 19Decrease2.svg159.4416062.541,21345.4Increase2.svg0.6%
  Liberal Democrats 13Increase2.svg140.6223536.428,89831.8Increase2.svg0.2%
  Conservative 0Steady2.svg0.0000.09,97511.0Increase2.svg0.5%
  Green 0Steady2.svg0.0111.17,6238.4Decrease2.svg0.9%
  UKIP 0Steady2.svg0.0000.01,0411.1Decrease2.svg0.1%
  BNP 0Steady2.svg0.0000.09721.1Increase2.svg0.4%
  Respect 0Steady2.svg0.0000.05350.6Decrease2.svg0.1%
  Socialist Alternative 0Steady2.svg0.0000.02510.3Increase2.svg0.1%
  Independent 0Steady2.svg0.0000.01900.2Decrease2.svg0.7%
  United Socialist 0Steady2.svg0.0000.0560.1n/a

Ward results

Below is a list of the 32 individual wards with the candidates standing in those wards and the number of votes the candidates acquired. The winning candidate per ward is in bold.

Ancoats and Clayton

Ancoats and Clayton [1] [2]
PartyCandidateVotes%±%
Labour Mick Loughman* 1,518 64.6 +16.3
Liberal Democrats Daniel Valentine47320.1-20.6
Green Victoria Album1486.3+2.1
Conservative David Hopps1355.7+1.2
Independent John Hulse763.2+0.9
Majority1,04544.5+37.0
Turnout 2,35024.4-8.5
Labour hold Swing +18.4

Ardwick

Ardwick [1] [2]
PartyCandidateVotes%±%
Labour Bernard Priest* 1,219 57.4 -4.0
Liberal Democrats Jawaid Chaudhry52624.8+4.9
Green Justine Hall22410.60
Conservative Kashif Ali1557.3-0.7
Majority69332.6-8.8
Turnout 2,12421.5-0.2
Labour hold Swing -4.4

Baguley

Baguley [1] [2]
PartyCandidateVotes%±%
Labour Co-op Paul Andrews* 1,268 52.6 +3.6
Conservative John Leaning48120.0-0.2
Socialist Alternative Lynn Worthington25110.4+1.7
Liberal Democrats William Fisher2339.7-3.4
Green Karen Duffy1767.3-1.6
Majority78732.7+4.0
Turnout 2,40923.0-0.9
Labour hold Swing +1.9

Bradford

Bradford [1] [2]
PartyCandidateVotes%±%
Labour Rosa Battle 1,476 70.8 +1.0
Liberal Democrats James Guise28813.8-0.7
Conservative Rodney Keller1909.1+0.5
Green Christopher Waldon1316.3-0.8
Majority1,18857.0+1.7
Turnout 2,08522.3-3.0
Labour hold Swing +0.8

Brooklands

Brooklands [1] [2]
PartyCandidateVotes%±%
Labour Sue Cooley* 1,460 50.3 +8.2
Conservative Marie Raynor95833.0+3.8
Liberal Democrats David Kierman34211.8-12.3
Green Tamisin MacCarthy-Morrogh1404.8+0.2
Majority50217.3+4.3
Turnout 2,90029.1-4.3
Labour hold Swing +2.2

Burnage

Burnage [1] [2]
PartyCandidateVotes%±%
Liberal Democrats Iain Donaldson* 1,825 54.3 +6.8
Labour Frank Duffy1,20936.0-2.0
Conservative Peter Schofield1945.8-2.4
Green Joseph Gair1323.9-0.9
Majority61618.3+8.8
Turnout 3,36032.0+2.2
Liberal Democrats hold Swing +4.4

Charlestown

Charlestown [1] [2]
PartyCandidateVotes%±%
Labour Basil Curley* 1,542 59.0 +4.7
Conservative Kim Glasspole41916.0+1.3
Liberal Democrats Ann Rodgers26810.3-2.9
UKIP Andrea Ritchie2389.1-2.7
Green Helen Dolan1485.7-0.3
Majority1,12342.9+3.3
Turnout 2,61527.8-1.4
Labour hold Swing +1.7

Cheetham

Cheetham [1] [2]
PartyCandidateVotes%±%
Labour Mohammed Khan* 2,340 64.6 +19.0
Liberal Democrats Sham Raja57115.8-27.2
Conservative Wajid Ali38010.5+5.4
Green Jackie Smith3329.2+2.9
Majority1,76948.8+46.2
Turnout 3,62331.5-4.7
Labour hold Swing +23.1

Chorlton

Chorlton [1] [2]
PartyCandidateVotes%±%
Liberal Democrats Paul Ankers 1,823 41.3 +1.9
Labour Angela Gallagher*1,78140.4-1.6
Green Brian Candeland54412.3-1.7
Conservative Claire McLauchlin2646.0+1.4
Majority421.0-1.6
Turnout 4,41243.3+0.3
Liberal Democrats gain from Labour Swing +1.7

Chorlton Park

Chorlton Park [1] [2]
PartyCandidateVotes%±%
Liberal Democrats Tony Bethell* 1,751 55.4 +0.7
Labour Co-op John Hacking73923.4-1.9
Green Kathryn Brownbridge39412.5-0.2
Conservative Robert Chilton2798.8+1.5
Majority1,01232.0+2.6
Turnout 3,16331.0-1.1
Liberal Democrats hold Swing +1.3

City Centre

City Centre [1] [2]
PartyCandidateVotes%±%
Liberal Democrats Kenneth Dobson* 498 32.8 -5.2
Labour Kathy Crotty39125.8-1.0
Conservative Rob Adlard34322.6+0.3
Green Birgit Vollm17111.3-1.7
Independent Kin Cheng1147.5+7.5
Majority1077.1-4.1
Turnout 1,51716.0-0.4
Liberal Democrats hold Swing -2.1

Crumpsall

Crumpsall [1] [2]
PartyCandidateVotes%±%
Labour Con Keegan* 1,832 60.1 +10.5
Conservative Adrian Glasspole56418.5+4.3
Liberal Democrats Muhammad Shahbaz39813.1-8.8
Green John Cummings2548.3+1.7
Majority1,26841.6+14.0
Turnout 3,04829.9-3.9
Labour hold Swing +3.1

Didsbury East

Didsbury East [1] [2]
PartyCandidateVotes%±%
Liberal Democrats Helen Fisher* 1,856 45.9 +0.6
Labour Geoff Bridson1,30132.2-2.1
Conservative David Fairclough52613.0+4.0
Green Gerry Gee3598.9-2.6
Majority55513.7+2.7
Turnout 4,04239.10
Liberal Democrats hold Swing +1.3

Didsbury West

Didsbury West [1] [2]
PartyCandidateVotes%±%
Liberal Democrats Neil Trafford* 1,328 45.7 +2.8
Labour David Ellison71224.5-0.5
Conservative Peter Caddick41414.3-3.2
Green James Alden38913.4+1.5
UKIP Robert Gutfreund-Walmsley612.1-0.6
Majority61621.2+3.3
Turnout 2,90429.2+1.2
Liberal Democrats hold Swing +1.6

Fallowfield

Fallowfield [1] [2]
PartyCandidateVotes%±%
Labour Peter Morrison* 1,215 55.9 +9.5
Liberal Democrats John-Paul Wilkins47822.0-15.2
Green Rachel Sills25111.6+5.9
Conservative Ashton Cull23010.6+4.7
Majority73733.9+24.6
Turnout 2,17420.0-8.1
Labour hold Swing +12.3

Gorton North

Gorton North [1] [2]
PartyCandidateVotes%±%
Liberal Democrats Wendy Helsby* 1,753 52.3 +16.2
Labour John Hughes1,36540.7+1.0
Conservative Joyce Kaye1263.8-0.8
Green Rachel Wilson1073.2+0.7
Majority38811.6+8.0
Turnout 3,35131.6+0.2
Liberal Democrats hold Swing +7.6

Gorton South

Gorton South [1] [2]
PartyCandidateVotes%±%
Liberal Democrats Simon Ashley* 1,600 52.1 +4.3
Labour Julie Reid1,15037.5+1.7
Green Barnaby Wolfram1344.4-4.1
Conservative Lawrie Clapham1304.2-3.7
United Socialist Sabrina Jones561.8+1.8
Majority45014.7+2.7
Turnout 3,07026.90
Liberal Democrats hold Swing +1.3

Harpurhey

Harpurhey [1] [2]
PartyCandidateVotes%±%
Labour Joanne Green* 1,497 58.9 +3.6
Liberal Democrats Robert Brettle35514.0+1.5
Conservative Harriet Holder29411.6-0.2
UKIP Roger P Bullock26410.4-1.7
Green Katherine Smith1335.2-3.2
Majority1,14244.9+2.1
Turnout 2,54320.8-1.3
Labour hold Swing +1.0

Higher Blackley

Higher Blackley [1] [2]
PartyCandidateVotes%±%
Labour Harold Lyons* 1,449 48.4 -8.6
BNP Joseph Finnon71623.9+23.9
Conservative Vivienne Clarke37212.4-7.1
Liberal Democrats Brian Newton2689.0-5.8
Green Michael Shaw1083.6-5.1
UKIP Shirley Reeve822.7+2.7
Majority73324.5-13.0
Turnout 2,99529.7+3.2
Labour hold Swing -16.2

Hulme

Hulme [1] [2]
PartyCandidateVotes%±%
Labour Mary Murphy* 969 50.1 +12.2
Green Steven Durrant63032.6+7.6
Liberal Democrats Oliver West21311.0-15.7
Conservative Andrew Binns1226.3+1.7
Majority33917.5+6.4
Turnout 1,93420.9-3.2
Labour hold Swing +2.3

Levenshulme

Levenshulme [1] [2]
PartyCandidateVotes%±%
Liberal Democrats John Commons* 1,388 51.2 +1.1
Labour Dermot Zafar74227.4-0.5
Green Peter Thompson33412.3-2.0
Conservative Anne Carroll2489.1+1.3
Majority64623.8+1.5
Turnout 2,71227.0-1.4
Liberal Democrats hold Swing +0.8

Longsight

Longsight [1] [2]
PartyCandidateVotes%±%
Liberal Democrats Abid Latif Chohan* 1,506 47.5 +22.4
Labour Sajjid Hussain1,18837.5-17.1
Green Spencer Fitzgibbon32010.1-4.3
Conservative Jane L'Anson1575.0-0.9
Majority31810.0-20.0
Turnout 3,17131.4-0.9
Liberal Democrats hold Swing +19.7

Miles Platting and Newton Heath

Miles Platting and Newton Heath [1] [2]
PartyCandidateVotes%±%
Labour June Hitchin* 1,331 42.6 -0.9
Liberal Democrats Damien O'Connor1,27040.6+13.8
BNP Derek Adams2568.2-8.7
Conservative Heather Grant1244.0-0.5
Green Anthony Quinn752.4-0.8
UKIP Lisa Duffy692.2-2.8
Majority612.0-14.7
Turnout 3,12530.6+1.5
Labour hold Swing -7.3

Moss Side

Moss Side [1] [2]
PartyCandidateVotes%±%
Labour Sameem Ali 1,660 67.2 +3.5
Liberal Democrats Zeke Ukairo38415.6-3.1
Green George Czernuszka2229.0+0.4
Conservative Peter Young2048.3+4.0
Majority1,27651.7+6.7
Turnout 2,47024.4-3.4
Labour hold Swing +3.3

Moston

Moston [1] [2]
PartyCandidateVotes%±%
Labour Henry Cooper* 1,760 55.5 +2.4
Conservative Tony Pinder63720.1-2.5
UKIP Peter Reeve32710.3+10.3
Liberal Democrats Timothy Hartley3149.9-5.3
Green Robin Goater1324.2-4.8
Majority1,12335.4+4.9
Turnout 3,17029.2-2.0
Labour hold Swing +2.4

Northenden

Northenden [1] [2]
PartyCandidateVotes%±%
Labour Sandra Bracegirdle 1,458 44.6 -2.3
Liberal Democrats Martin Eakins1,35241.3+5.5
Conservative Nathan Cruddas2798.5-4.3
Green Lance Crookes1825.6+1.1
Majority1063.2-7.9
Turnout 3,27131.3+2.0
Labour hold Swing -3.9

Old Moat

Old Moat [1] [2]
PartyCandidateVotes%±%
Labour Jeffrey Smith* 1,382 53.7 -0.7
Liberal Democrats Richard Wilson74829.1+2.2
Green Alice Coren2308.9-2.1
Conservative Andrew Perfect2158.4+0.7
Majority63424.63.0
Turnout 2,57525.5-3.7
Labour hold Swing -1.4

Rusholme

Rusholme [1] [2]
PartyCandidateVotes%±%
Liberal Democrats Abu Chowdhury* 1,241 42.3 +2.4
Labour Atiha Chaudry74625.4-2.3
Respect Nahella Ashraf53518.2-3.0
Green Penny Collins2247.6+1.1
Conservative Daniel Valentine1906.5+1.8
Majority49516.9+4.7
Turnout 2,93630.7-0.8
Liberal Democrats hold Swing +2.3

Sharston

Sharston [1] [2]
PartyCandidateVotes%±%
Labour Co-op Joyce Keller* 1,242 52.5 -2.5
Conservative Jimmy McCullough60425.5+7.8
Liberal Democrats Tina Dunican29012.3-3.3
Green Amanda Collins2299.7-1.8
Majority63827.0-10.3
Turnout 2,36521.8+0.4
Labour hold Swing -5.1

Whalley Range

Whalley Range [1] [2]
PartyCandidateVotes%±%
Liberal Democrats Faraz Bhatti* 2,030 50.2 +17.6
Labour Kath Fry1,41835.0-11.1
Green Mary Candeland3939.7-3.4
Conservative Tim Langley2065.1-3.0
Majority61215.1+1.6
Turnout 4,04739.0+4.5
Liberal Democrats hold Swing +14.3

Withington

Withington [1] [2]
PartyCandidateVotes%±%
Liberal Democrats Alison Firth* 1,346 60.7 +12.9
Labour Andrew Simcock49922.5-5.1
Green Felicity Paris2169.7-5.6
Conservative Adele Douglas1577.1-2.2
Majority84738.2+17.9
Turnout 2,21821.5-0.8
Liberal Democrats hold Swing +9.0

Woodhouse Park

Woodhouse Park [1] [2]
PartyCandidateVotes%±%
Labour Barbara O'Neil* 1,354 65.3 +3.8
Conservative Stephen Heath37818.2+2.4
Liberal Democrats Joseph Podbylski1828.8-5.2
Green Jody Bradford1617.8-0.9
Majority97647.0+1.3
Turnout 2,07521.2-0.6
Labour hold Swing +0.7

Changes between 2007 and 2008

Charlestown By-Election 14 June 2007

Charlestown By-Election 14 June 2007 [3]
PartyCandidateVotes%±%
Labour Veronica Kirkpatrick 1,373 54.7 -4.3
BNP Joseph G M Finnon62825.0+25.0
Liberal Democrats Carol Connell2399.5-0.8
Conservative Kim E Glasspole1887.5-8.5
Green Jackie Smith813.2-2.5
Majority74529.6-13.3
Turnout 2,50926.5-1.3
Labour hold Swing -14.6

Related Research Articles

<span class="mw-page-title-main">City of Salford</span> Borough and City in Greater Manchester, England

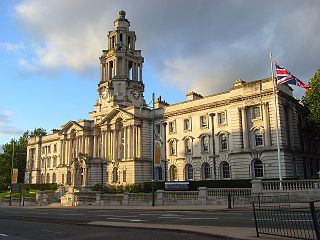
Salford, commonly known as the City of Salford, is a metropolitan borough with city status in Greater Manchester, England. The borough is named after its main settlement, Salford, but covers a larger area which includes the towns of Eccles, Swinton, Walkden and Pendlebury. The borough has a population of 270,000, and is administered from the Salford Civic Centre in Swinton.

<span class="mw-page-title-main">Manchester Central (UK Parliament constituency)</span> Parliamentary constituency in the United Kingdom, 1974 onwards

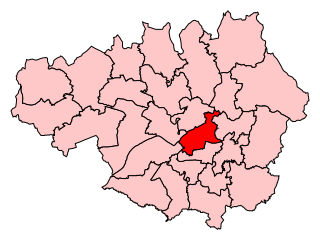
Manchester Central is a parliamentary constituency in Greater Manchester created in 1974 represented in the House of Commons of the UK Parliament since 2012 by Lucy Powell of the Labour Party and Co-operative Party.

<span class="mw-page-title-main">Manchester Withington (UK Parliament constituency)</span> Parliamentary constituency in the United Kingdom, 1918 onwards

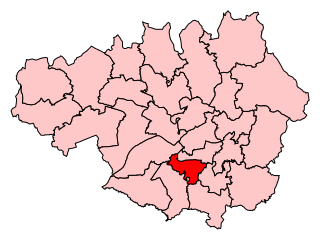
Manchester Withington is a constituency represented in the House of Commons of the UK Parliament since 2015 by Jeff Smith of Labour. Of the 30 seats with the highest percentage of winning majority in 2017, the seat ranks 25th with a 55.7% margin, and is the only one of the twenty nine of these seats won by the Labour Party in which the second-placed candidate was a Liberal Democrat, rather than Conservative. This is despite being a Conservative seat right up to 1987, then becoming relatively safely Labour, then Liberal Democrat from 2005 to 2015 before they lost on a large swing in 2015, after which Smith substantially increased his majority.

<span class="mw-page-title-main">Charlestown, Manchester</span> Electoral ward in England

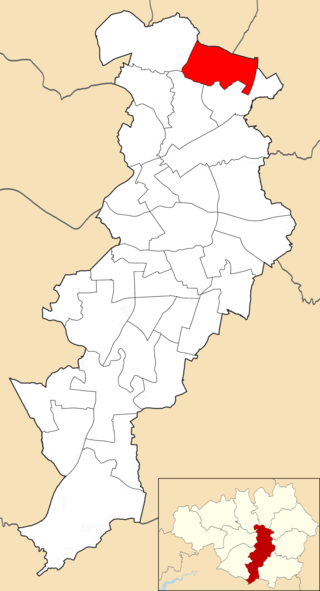
Charlestown is a ward in the suburban north of the city of Manchester, England. The population of the ward at the 2011 census was 14,332. Voters from this ward elect three councillors to Manchester City Council.

<span class="mw-page-title-main">Metropolitan Borough of Stockport</span> Borough of Greater Manchester, England

The Metropolitan Borough of Stockport is a metropolitan borough of Greater Manchester in England. It is south-east of central Manchester and south of Tameside. As well as the towns of Stockport, Bredbury and Marple, it includes the outlying villages and suburbs of Hazel Grove, Bramhall, Cheadle, Cheadle Hulme, Gatley, Reddish, Woodley and Romiley. In 2021, it had a population of 295,243. The borough is third-most populous of Greater Manchester.

<span class="mw-page-title-main">Chorlton Park (ward)</span> Electoral ward in England

Chorlton Park is an area and electoral ward of Manchester, England. Different parts of this ward are represented by different MPs following boundary changes in 2018; the majority of the ward is part of the Manchester Withington constituency but a portion is part of the Manchester Gorton constituency. The 2011 Census recorded a population of 15,147.

<span class="mw-page-title-main">Brooklands (Manchester ward)</span> Electoral ward in England

Brooklands is an area and electoral ward of Manchester, England. It is represented in Westminster by Mike Kane, MP for Wythenshawe and Sale East. The 2011 Census recorded a population of 14,362.

<span class="mw-page-title-main">2006 Manchester City Council election</span>

Elections to Manchester City Council were held on 4 May 2006. One third of the council was up for election, with each successful candidate to serve a four-year term of office, expiring in 2010. The council stayed under Labour Party control, strengthened by four gains from the Liberal Democrats.

<span class="mw-page-title-main">2008 Manchester City Council election</span>

Elections to Manchester City Council took place on 1 May 2008. One third of the council was up for election - every ward of the city returned one councillor at this election out of the three councillors a ward in the city has.

<span class="mw-page-title-main">2010 Manchester City Council election</span>

Elections to Manchester City Council were held on 6 May 2010, on the same day as the 2010 UK General Election. One-third of the council was up for election, with each successful candidate to serve a four-year term of office, expiring in 2014. Since the election there had been a further defection from the Liberal Democrats to Labour. Labour held overall control of the council, on a high turnout - owing to the general election on the same day - of 50.9%.

In United Kingdom election law, an election court is a special court convened to hear a petition against the result of a local government or parliamentary election. The court is created to hear the individual case, and ceases to exist when it has made its decision.

<span class="mw-page-title-main">2010 Redbridge London Borough Council election</span> 2010 local election in England, UK

Elections for Redbridge London Borough Council were held on 6 May 2010. The 2010 General Election and other local elections took place on the same day.

<span class="mw-page-title-main">Pendlebury (ward)</span> Electoral ward in England

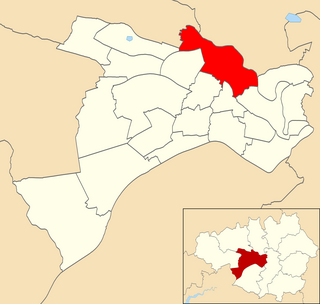
Pendlebury is an electoral ward of Salford, England. It is represented in Westminster by Rebecca Long-Bailey MP for Salford and Eccles. A profile of the ward conducted by Salford City Council in 2014 recorded a population of 13,434.

<span class="mw-page-title-main">Burnage (ward)</span> Electoral ward in England

Burnage is an area and electoral ward of Manchester, England. Different parts of this ward are represented by different MPs following boundary changes in 2018; the majority of the ward is part of the Manchester Withington constituency but a portion is part of the Manchester Gorton constituency. The 2011 Census recorded a population of 15,227.

<span class="mw-page-title-main">Chorlton (ward)</span> Electoral ward in England

Chorlton is an electoral ward of Manchester, England. Different parts of this ward are represented by different MPs following boundary changes in 2018; the majority of the ward is part of the Manchester Withington constituency but a portion is part of the Manchester Gorton constituency. The 2011 Census recorded a population of 14,138.

<span class="mw-page-title-main">Didsbury East (ward)</span> Electoral ward in England

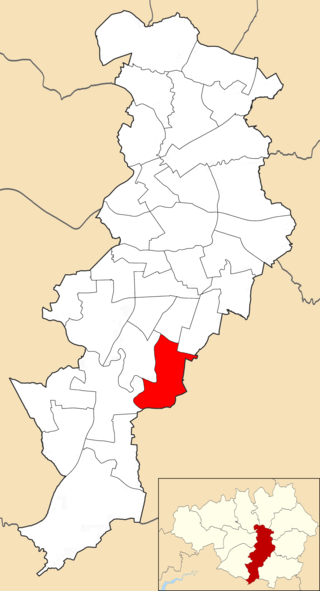
Didsbury East is an area and electoral ward of Manchester, England. It is represented in Westminster by Jeff Smith MP for Manchester Withington. The 2011 Census recorded a population of 14,333.

<span class="mw-page-title-main">Didsbury West (ward)</span> Electoral ward in England

Didsbury West is a suburb and electoral ward of Manchester, England. It is represented in Westminster by Jeff Smith MP for Manchester Withington. The 2011 Census recorded a population of 12,455.

<span class="mw-page-title-main">Old Moat (ward)</span> Electoral ward in England

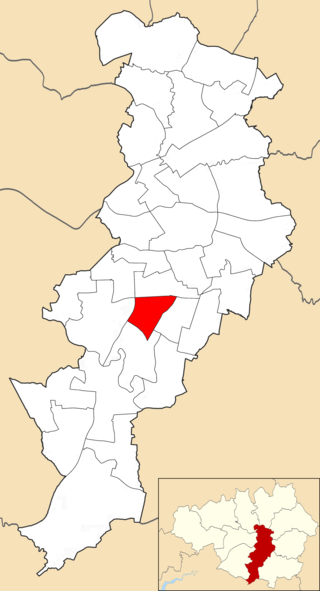
Old Moat is an area and electoral ward in Manchester, England. It is represented in Westminster by Jeff Smith MP for Manchester Withington. The 2011 Census recorded a population of 14,490.

<span class="mw-page-title-main">Withington (ward)</span> Electoral ward in England

Withington is an area and electoral ward of Manchester, England. It is represented in Westminster by Jeff Smith MP for Manchester Withington. The 2011 Census recorded a population of 13,422.

<span class="mw-page-title-main">City Centre (ward)</span> Electoral ward in England

City Centre ward was a ward of the local authority Manchester City Council from 2004 to 2018. The population of the city centre grew significantly in the 21st century. Therefore as recommended by the Local Government Boundary Commission for England (LGBCE), the ward was replaced in May 2018 with two new electoral wards, Deansgate and Piccadilly.

References

  1. 1 2 3 4 5 6 7 8 9 10 11 12 13 14 15 16 17 18 19 20 21 22 23 24 25 26 27 28 29 30 31 32 33 "Local Election Results 2007". manchester.gov.uk. Archived from the original on 11 May 2010. Retrieved 18 January 2012.
  2. 1 2 3 4 5 6 7 8 9 10 11 12 13 14 15 16 17 18 19 20 21 22 23 24 25 26 27 28 29 30 31 32 33 34 "Local Election Archive: 2007 - Manchester". andrewteale.me.uk. Retrieved 18 January 2012.
  3. "By-election results: 2006–2011". manchester.gov.uk. Archived from the original on 11 May 2010. Retrieved 19 January 2012.