2007 Brighton and Hove City Council election

Last updated

2007 Brighton and Hove City Council election
  2003 3 May 2007 2011  

All 54 council seats
28 seats needed for a majority
 First partySecond party
 
Party Conservative Labour
Last election2023
Seats won2613
Seat changeIncrease2.svg6Decrease2.svg10
Popular vote28,44420,331
Percentage34.58%24.72%
SwingIncrease2.svg0.09%Decrease2.svg7.64%

 Third partyFourth party
 
Party Green Liberal Democrats
Last election63
Seats won122
Seat changeIncrease2.svg6Decrease2.svg1
Popular vote17,0468,686
Percentage20.72%10.56%
SwingIncrease2.svg4.14%Decrease2.svg4.57%

Brighton and Hove City Council election 2007 map.svg
Map of results of 2007 election

Previous Largest Party before election


Labour

Subsequent Largest Party


Conservative

Elections to Brighton and Hove City Council on the south coast of England were held on 3 May 2007. The whole council (a unitary authority) was up for election and all 54 councillors were elected.

Contents

The Conservative Party won 26 out of 54 seats on the council, replacing the Labour Party as the largest party and formed a minority administration. This result was to some extent in line with the general pattern of results throughout England that day, with Conservatives gaining seats at the expense of Labour and the Liberal Democrats. The Green Party increased its number of seats from 6 to 12.

Following the election, the composition of the council was as follows:

PartySeats  ±  
Conservative 26+6
Labour 13-10
Green Party 12+6
Liberal Democrat 2–1
Independent 1–1

Election result

Brighton & Hove Election Result 2007
PartySeatsGainsLossesNet gain/lossSeats %Votes %Votes+/−
  Conservative 2660648.1534.5828,444+0.09
  Labour 13010-1024.0724.7220,331-7.64
  Green 1260622.2220.7217,046+4.14
  Liberal Democrats 201-13.7010.568,686-4.57
  Independent 101-11.855.324,378+3.84
 Brighton and Hove Independents000001.881,545N/A
  Respect 000000.78643N/A
 Protest Vote000000.41338N/A
  UKIP 000000.35291+0.26
 Alliance for Green Socialism000000.28232N/A
  Socialist Alternative 000000.19159N/A
  Socialist Labour 000000.13109-0.03
  English Democrat 000000.0756N/A

Ward results

Brunswick and Adelaide

Brunswick & Adelaide (2)
PartyCandidateVotes%±%
Liberal Democrats Paul Elgood94223.18-6.22
Liberal Democrats David Watkins72917.94-8.90
Green Phelim MacCafferty48211.86+4.86
Green Hazel Ellison43110.61+10.61
Conservative Joanne Heard3689.06+2.59
Conservative Roz Rawcliffe3578.78+2.38
Labour David Boyle2846.99-7.98
Labour Simon Gulliver2636.47-6.57
Independent Brian Ralfe1523.74N/A
English Democrat Ben Potter561.38N/A
Turnout 3,33528.0-4.9
Liberal Democrats hold Swing

Central Hove

Central Hove (2)
PartyCandidateVotes%±%
Conservative Averil Older96420.48+0.84
Conservative Jan Young90119.14+0.04
Liberal Democrats Simon Doyle69214.70-1.20
Liberal Democrats Benjamin Herbert66714.17-1.06
Green Dave Walsh4208.92+3.04
Green Jacqueline Da Costa3337.07+1.84
Labour Rachel Lyons3176.73-3.05
Labour Bernie Katz3046.46-2.77
Protest VoteChristopher Kilburn1092.32N/A
Turnout 4,70734.0-7.6
Conservative hold Swing

East Brighton

East Brighton (3)
PartyCandidateVotes%±%
Labour Gill Mitchell1,53915.78+1.66
Labour Warren Morgan1,40113.73+0.47
Labour Craig Turton1,26212.36+1.18
Conservative Simon Hackett1,0009.80+0.09
Conservative Victor Mower9979.77+0.47
Conservative David Van Day 9319.12+0.20
Green Nigel Tart6216.08+0.39
Green Eliza Fakhr4674.58+0.24
Green Hugh Miller4454.36+0.74
Liberal Democrats James Ledward4013.93-3.11
Liberal Democrats Tim Hodlin4003.92-2.31
Liberal Democrats Trefor Hunter3773.69-1.36
Brighton and Hove IndependentsVicki Davies2572.52N/A
Socialist Labour John McLeod1091.07-0.46
Turnout 10,20735.4-3.2
Labour hold Swing
Labour hold Swing
Labour hold Swing

Goldsmid

Goldsmid (3)
PartyCandidateVotes%±%
Conservative Paul Lainchbury1,33010.67-0.25
Conservative Ayas Fallon-Khan1,2389.93-0.52
Labour Melanie Davis1,2319.87-0.86
Labour Vince Meegan1,2019.63-1.07
Conservative Stephen Wade1,1899.54-0.88
Labour Alun Jones1,0988.81-1.69
Green Rob Jarrett1,0108.10+1.77
Green Martin Grimshaw8336.68+2.13
Green Sue Baumgardt7606.10+2.22
Liberal Democrats Bob Bailey7205.77-2.13
Liberal Democrats Andrew Mailing6094.88-2.44
Liberal Democrats Stephen Potts5064.06-2.24
Brighton and Hove IndependentsAnne Giebeler3142.52N/A
Independent Gemma Furness1341.07N/A
Independent Nigel Furness1140.91N/A
Brighton and Hove IndependentsDavid Jeal1090.87N/A
Independent Peter Poole730.59N/A
Turnout 12,46937.5-6.2
Conservative hold Swing
Conservative gain from Labour Swing
Labour hold Swing

Hangleton and Knoll

Hangleton & Knoll (3)
PartyCandidateVotes%±%
Conservative Dawn Barnett2,65118.73+4.88
Conservative Tony Janio2,23715.80+1.15
Conservative David Smart2,21515.65+2.95
Labour Brian Fitch1,82012.86-2.39
Labour Tony Meadows1,51410.70-3.62
Labour Eddy Sears1,50910.66-2.35
Liberal Democrats David Patrick3352.37-0.48
Green Andy Player3212.27-0.41
Respect Maggie Clifford2972.10+0.84
UKIP Stuart Bower2912.06N/A
Liberal Democrats David Sears2611.84-1.25
Green Tim Goodall2551.80+0.18
Green Nicola Hodgson2511.77+0.53
Liberal Democrats Lee Shingles1981.40-1.20
Turnout 14,15545.6-10.7
Conservative hold Swing
Conservative gain from Labour Swing

Hanover and Elm Grove

Hanover & Elm Grove (3)
PartyCandidateVotes%±%
Green Bill Randall2,18218.61+2.56
Green Georgia Wrighton2,10217.93+4.09
Green Vicky Wakefield-Jarrett1,94516.59+6.50
Labour Joyce Edmond-Smith1,32111.27-2.50
Labour Leo Barraclough1,0308.78-3.79
Labour Brendan Hanlon9458.06-2.97
Conservative James Mortimer4824.11+0.54
Conservative Guy Gilmour4593.91+0.51
Conservative Luke Foster4113.51+0.19
Liberal Democrats Matthew Barker3332.84-0.93
Liberal Democrats Ellen Woolley2602.22-1.14
Liberal Democrats Beulah Town2562.18-1.11
Turnout 11,46636.6-8.2
Green hold Swing
Green hold Swing
Green gain from Labour Swing

Hollingdean and Stanmer (until 2008 known as Hollingbury and Stanmer)

Hollingbury and Stanmer (3)
PartyCandidateVotes%±%
Labour Jeane Lepper1,32615.10-1.26
Labour Christine Simpson1,05612.02-2.59
Labour Patricia Hawkes1,04911.94-2.94
Conservative Carol Ramsden8389.54+0.79
Conservative Nick Garside8329.47+0.98
Conservative Karen Miles8259.39+1.44
Green Tom Druitt6857.80+1.98
Green Amelia Mills5616.39+2.23
Green Guy Richardson4264.85+1.90
Independent Nick Savvides4084.65N/A
Liberal Democrats Vanessa Blackwell3814.34+0.04
Liberal Democrats Trevor Freeman2853.25-0.72
Liberal Democrats John Riddington2673.04-0.22
Alliance for Green Socialism Tony Greenstein 2322.64-0.22
Socialist Alternative Andrew Clarke1591.81N/A
Socialist Alternative Phillip Clarke1371.56N/A
Turnout 9,46730.63-7.28
Labour hold Swing
Labour hold Swing
Labour hold Swing

Hove Park (until 2009 known as Stanford)

Stanford (2)
PartyCandidateVotes%±%
Conservative Vanessa Brown2,35731.80+0.41
Independent Jayne Bennett2,25030.35+8.08
Conservative Michael Switzer1,51420.42-0.95
Green Mike Butler3024.07+1.04
Labour Jacqueline Teeboon2773.74-2.13
Labour Lisa Buckingham2343.16-2.32
Liberal Democrats Roy Alldred2092.82-2.42
Green Liz Petty1371.85-0.04
Liberal Democrats Jo Lake1331.79-1.67
Turnout 4,01050.43-5.51
Conservative hold Swing
Independent hold Swing

Moulsecoomb and Bevendean

Moulsecoomb and Bevendean (3)
PartyCandidateVotes%±%
Labour Mo Marsh1,01812.52-2.96
Labour Anne Meadows1,01812.52-2.73
Conservative Maria Caulfield 98412.10+3.40
Conservative Mel Grundy98312.09+3.66
Conservative Elizabeth Kirby96411.85+3.54
Labour Lis Telcs84810.43-4.80
Green Matt Dunton4685.76+0.73
Green Barry Mills3574.39+0.67
Respect David Bangs3464.25N/A
Green Morgan Daniels-Yeoman3334.09+1.09
Liberal Democrats Richard Bowden3203.94-1.79
Liberal Democrats Paul Chandler2683.30-1.36
Liberal Democrats Bruce Neave2252.77-1.85
Turnout 2,94927.18-9.73
Labour hold Swing
Labour hold Swing
Conservative gain from Labour Swing

North Portslade

North Portslade (2)
PartyCandidateVotes%±%
Labour Bob Carden1,14122.75-6.62
Conservative Trevor Alford1,08221.57+8.21
Conservative Theo Brake-Child1,03920.71+9.44
Labour Nicole Murphy98019.54-7.63
Liberal Democrats Neville Reginald Searle2444.86-1.46
Green Anthony Ackroyd1793.57-1.18
Liberal Democrats Coreen Sears1763.51-1.91
Green Janette Ackroyd1753.49+1.14
Turnout 2,69235.85-12.27
Labour hold Swing
Conservative gain from Labour Swing

Patcham

Patcham (3)
PartyCandidateVotes%±%
Conservative Brian Pidgeon2,79220.77+1.11
Conservative Carol Theobald2,74320.41+1.48
Conservative Geoffrey Theobald2,70220.10+1.38
Labour Peggy Betts9427.01-1.95
Labour Christine Moody8216.11-0.72
Labour Rosemary Collins8035.98-0.68
Green Geraldine Keenan6564.88+2.41
Green Mike Sells4513.36+0.61
Liberal Democrats Peter Edward Hughes Bailey4323.21-1.43
Green Julia Wilde4273.18+0.87
Liberal Democrats Bill Taylor3642.71N/A
Liberal Democrats Thomas Stokes3082.29-1.37
Turnout 4,74243.94-9.28
Conservative hold Swing

Preston Park

Preston Park (3)
PartyCandidateVotes%±%
Green Amy Kennedy1,63312.37-1.06
Labour Juliet McCaffery1,63012.35+1.17
Labour Kevin Allen1,47411.16+0.48
Labour Nick Jarvis1,32410.03+0.06
Green Simon Williams1,1858.98-1.09
Independent Tracey-Ann Ross1,0578.01N/A
Green Andrew Knott1,0277.78-1.46
Conservative Clive Brimmell7555.72-0.61
Conservative Dan Kaufer7465.65-0.24
Conservative Jon Perrin7245.48-0.21
Independent Jo Offer6444.88N/A
Liberal Democrats Paul Durden4383.32-2.77
Liberal Democrats Lawrence Eke2982.26-3.74
Liberal Democrats Billy Tipping2672.02-3.41
Turnout 4,76744.91-5.00
Green hold Swing
Labour hold Swing
Labour hold Swing

Queen's Park

Queens Park (3)
PartyCandidateVotes%±%
Green Rachel Fryer1,82614.26+5.21
Green Paul Steedman1,54912.10+5.04
Green Ben Duncan1,47311.50+5.11
Labour Delia Forester1,45811.39-1.34
Labour Kenneth Bodfish1,45511.36-2.15
Labour Simon Burgess1,41811.07-1.92
Conservative Nick Maskell9267.23-0.24
Conservative Ariane Poulain8206.40-0.87
Conservative Gail Woodcock7525.87-1.32
Liberal Democrats Elizabeth Robinson3692.88-3.23
Liberal Democrats Joe Blease3642.84N/A
Liberal Democrats Graham Arthur Bucknall3042.37-2.38
Independent John Walshe910.71N/A
Turnout 12,80539.99-1.49
Green gain from Labour Swing +3.1
Green gain from Labour Swing +3.2
Green gain from Labour Swing +3.8

Regency

Regency (2)
PartyCandidateVotes%±%
Green Sven Rufus86317.19+3.17
Green Hermione Roy78116.10+7.78
Labour Roy Pennington56511.65-3.17
Conservative Michael Macfarlane52510.82+1.47
Conservative Robert Nemeth51610.64+1.88
Liberal Democrats Sue Bucknall4549.36-6.15
Labour Daniel Yates4479.21-5.29
Liberal Democrats Kevin Donnelly4258.76-5.96
Brighton and Hove IndependentsCorinne Attwood2184.49N/A
Brighton and Hove IndependentsTony Davenport571.18N/A
Turnout 2,56933.75-1.35
Green gain from Liberal Democrats Swing
Green gain from Labour Swing

Rottingdean Coastal

Rottingdean Coastal (3)
PartyCandidateVotes%±%
Conservative Lynda Hyde2,80320.68+0.07
Conservative David Smith2,67919.77+1.43
Conservative Mary Mears2,66519.66+1.51
Green Geoffrey Bowden9326.88+2.16
Green Anita Gilson8276.10+2.66
Green Janet Hale7775.73+2.74
Labour Neil Mercer5804.28-1.64
Liberal Democrats Dawn Davidson5584.12-0.95
Liberal Democrats Birgit Hunter4903.62-1.45
Labour Mohammed Asaduzzaman4543.35-1.94
Labour Ian Tinlin4523.34-1.35
Liberal Democrats Shervin Sharghy3362.48-1.24
Turnout 4,42241.75-12.01
Conservative hold Swing

South Portslade

South Portslande (2)
PartyCandidateVotes%±%
Labour Leslie Hamilton1,11921.34-1.89
Conservative Steve Harmer-Strange1,06120.23+5.83
Conservative Peter Lockyer1,04119.85+7.47
Labour Sue John99819.03+0.32
Green Kate Chapman3156.01+2.32
Liberal Democrats Ken Rist2795.32+0.09
Liberal Democrats Peter Denyer2424.61-0.34
Green Steve Watson1893.60+0.05
Turnout 2,78140.70-5.91
Labour hold Swing
Conservative gain from Labour Swing

St Peter's and North Laine

St Peter's and North Laine (3)
PartyCandidateVotes%±%
Green Keith Taylor 2,30319.20+1.93
Green Pete West2,11217.60+0.92
Green Ian Davey2,09917.50+0.91
Labour Sarah Ogden9798.16-0.67
Labour Greg Hadfield9217.68-0.44
Labour George Moody8837.36-0.69
Conservative Mike Long5054.21+0.72
Conservative Hans Miles4994.16+0.67
Conservative Jo Woodward4443.70+0.23
Liberal Democrats Martin Lindsay-Hills3713.10-1.59
Liberal Democrats Graham Hunnable3102.58-1.93
Independent Debbie Dawes2862.38N/A
Liberal Democrats William Parker2852.38-1.43
Turnout 4,20434.12-6.47
Green hold Swing
Green hold Swing
Green hold Swing

Westbourne

Westbourne (2)
PartyCandidateVotes%±%
Conservative Brian Oxley1,48826.67+3.61
Conservative Denise Cobb1,45826.13+3.86
Labour Debbie Lunn67012.01-2.06
Labour Alan Robins5449.75-2.90
Green Louisa Greenbaum4508.06+2.49
Green Ollie Sykes4508.06+4.56
Liberal Democrats Clive Jarvis2684.80-5.48
Liberal Democrats Howard Spencer2532.53-6.07
Turnout 2,88138.86-8.07
Conservative hold Swing

Wish

Wish (2)
PartyCandidateVotes%±%
Conservative Garry Peltzer Dunn1,59625.70+2.74
Conservative Ted Kemble1,52324.52+2.89
Labour Mark Wright81413.11-6.33
Labour Malcolm Prescott80112.90-4.75
Green Liz Wakefield4587.37+4.31
Green Sally Glaskin2714.36-0.24
Liberal Democrats Mark Lawrence Collins2694.33-2.12
Liberal Democrats Dinah Staples3504.03-0.18
Protest VoteMark Stack2293.69N/A
Turnout 3,23746.58-8.47
Conservative hold Swing

Withdean

Withdean (3)
PartyCandidateVotes%±%
Conservative Pat Drake2,09415.57-1.50
Conservative Ann Norman2,06615.36-1.45
Conservative Ken Norman2,00414.90-1.72
Brighton and Hove IndependentsMichael Whitty7565.62N/A
Labour Mike Middleton7515.58-0.52
Labour Gary Thurston7295.42-1.50
Green Eddie Wearing7195.35+0.81
Labour Jack Kiffin6925.14-1.40
Brighton and Hove IndependentsJames Simister6795.05N/A
Green Lynn Mackenzie6684.97+0.83
Brighton and Hove IndependentsSimon Swan6054.50N/A
Green Omar Jebari5093.78+0.90
Liberal Democrats John Lovatt4343.23-2.87
Liberal Democrats Robert Stockman3842.86-2.81
Liberal Democrats Hyder Khalil3602.68-2.78
Turnout 4,71443.68-10.06
Conservative hold Swing

Woodingdean

Woodingdean (2)
PartyCandidateVotes%±%
Conservative Dee Simson1,84333.15+1.46
Conservative Geoff Wells1,84033.09+0.83
Labour Karen Barford5499.87-2.47
Labour Mark Maguire5029.03-2.39
Liberal Democrats Joy DeSouza2374.26+0.53
Green Alan Pegg2213.97+1.16
Green Nellie Jones1923.45+1.48
Liberal Democrats Rosemary Lovatt1763.17-0.60
Turnout 2,90238.84-16.49
Conservative hold Swing

Related Research Articles

2006 Colchester Borough Council election

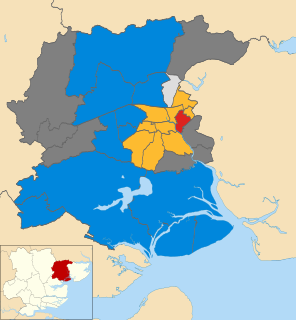
The 2006 Colchester Borough Council election took place on 4 May 2006 to elect members of Colchester Borough Council in Essex, England. One third of the council was up for election and the council stayed under no overall control.

2006 Camden London Borough Council election

The 2006 Camden Council election took place on 4 May 2006 to elect members of Camden London Borough Council in London, England. The whole council was up for election and the Labour Party lost overall control of the council to no overall control.

2008 West Lancashire District Council election

The 2008 West Lancashire District Council election took place on 1 May 2008 to elect members of West Lancashire District Council in Lancashire, England. One third of the council was up for election and the Conservative party stayed in overall control of the council.

1983 United Kingdom local elections

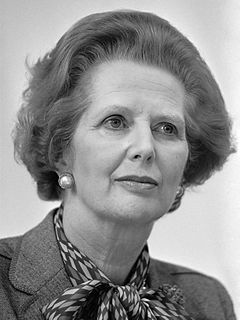
Local elections were held in the United Kingdom in 1983. The results were a success for Conservative Prime Minister Margaret Thatcher, who soon afterwards called a general election in which the Conservatives won a landslide victory. The projected share of the vote was Conservative 39%, Labour Party 36%, Liberal-SDP Alliance 20%.

The 2010 West Lancashire Borough Council election took place on 6 May 2010 to elect members of West Lancashire Borough Council in Lancashire, England. One third of the council was up for election and the Conservative party stayed in overall control of the council.

2004 Sunderland City Council election

The 2004 Sunderland City Council election took place on 10 June 2004 to elect members of Sunderland City Council Council in Tyne and Wear, England. The whole council was up for election following boundary changes since the last election in 2003. The Labour party stayed in overall control of the council.

2006 Sunderland City Council election

The 2006 Sunderland Council election took place on 4 May 2006 to elect members of Sunderland City Council in Tyne and Wear, England. One third of the Council was up for election and the Labour party stayed in overall control.

2007 Sunderland City Council election

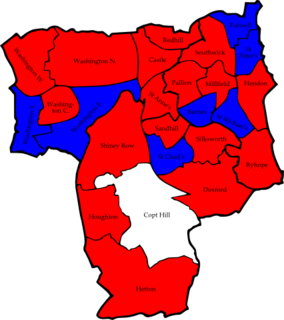
The 2007 Sunderland Council election took place on 3 May 2007 to elect members of Sunderland Metropolitan Borough Council in Tyne and Wear, England. One third of the council was up for election and the Labour party stayed in overall control of the council.

2011 Brighton and Hove City Council election

Elections to Brighton and Hove City Council were held on 5 May 2011, in line with other local elections in the United Kingdom. The whole council, a unitary authority, was up for election with 54 councillors elected from 21 wards.

2011 Great Yarmouth Borough Council election

The 2011 Great Yarmouth Borough Council election took place on 5 May 2011 to elect members of Great Yarmouth Borough Council in Norfolk, England. One third of the council was up for election and the Conservative Party stayed in overall control of the council. At the same time as the election, the introduction of a directly elected mayor in Great Yarmouth was rejected in a referendum.

2011 Wokingham Borough Council election

The 2011 Wokingham Borough Council election took place on 5 May 2011 to elect members of Wokingham Unitary Council in Berkshire, England. One third of the council was up for election and the Conservative Party stayed in overall control of the council.

Elections for the whole of Telford and Wrekin Council took place on 10 May 2011. 54 councillors were elected in 33 wards and the Labour Party took control from the Conservatives. There were no boundary changes taking effect at this election.

2014 Ealing London Borough Council election

The 2014 Ealing Council election took place on 22 May 2014 to elect members of Ealing Council in London. This was on the same day as other local elections. The Labour Party retained overall control of the council, increasing their majority over the Conservative Party by 13 seats.

The 2000 Colchester Borough Council election took place on 4 May 2000 to elect members of Colchester Borough Council in Essex, England. One third of the council was up for election and the council stayed under no overall control.

The 1964 Richmond upon Thames Council election took place on 7 May 1964 to elect members of Richmond upon Thames London Borough Council in London, England. The whole council was up for election and the Conservative party gained control of the council.

The 1964 Merton Council election took place on 7 May 1964 to elect members of Merton London Borough Council in London, England. The whole council was up for election and the council went into no overall control.

2015 Cheshire West and Chester Council election

The 2015 Cheshire West and Chester Council election took place on 7 May 2015, electing members of Cheshire West and Chester Council in England. This was on the same day as other local elections across the country as well as the general election.

2015 Breckland District Council election

The 2015 Breckland District Council election took place on 7 May 2015 to elect members of Breckland District Council in England. This was on the same day as other local elections.

The 2022 Hounslow London Borough Council election is due to take place on 5 May 2022. All 62 members of Hounslow London Borough Council will be elected. The elections will take place alongside local elections in the other London boroughs and elections to local authorities across the United Kingdom.

The 2022 Westminster City Council election is due to take place on 5 May 2022. All 54 members of Westminster London Borough Council will be elected. The elections will take place alongside local elections in the other London boroughs and elections to local authorities across the United Kingdom.