2007 Horsham District Council election

Last updated

The 2007 Horsham District Council election took place on 3 May 2007 to elect members of Horsham District Council in England. [1] It was held on the same day as other local elections. The Conservatives won a majority on the council, gaining from no overall control.

Contents

2007 Horsham District Council election
Flag of England.svg
  2003 3 May 2007 2011  

All 44 seats to Horsham District Council
23 seats needed for a majority
 First partySecond partyThird party
 
Party Conservative Liberal Democrats Independent
Seats won31112
Seat changeIncrease2.svg 9Decrease2.svg 9Steady2.svg

Council composition

Prior to the election, the composition of the council was:

22202
ConLDemInd

After the election, the composition of the council was:

31112
ConLDemInd

Results summary

2007 Horsham District Council election
PartySeatsGainsLossesNet gain/lossSeats %Votes %Votes+/−
  Conservative 3190Increase2.svg 970.554.342,736+6.8
  Liberal Democrats 1109Decrease2.svg 925.036.828,984-5.5
  Independent 2--Steady2.svg4.53.22,500-3.7
  UKIP 0--Steady2.svg0.02.92,297+2.7
  Labour 0--Steady2.svg0.01.61,217-1.6
  BNP 0--Steady2.svg0.00.5420+0.5
  Green 0--Steady2.svg0.00.3262+0.3
  Peace 0--Steady2.svg0.00.3226+0.3
  English Democrat 0--Steady2.svg0.00.2126+0.2

Ward results

Billingshurst and Shipley

Billingshurst and Shipley
PartyCandidateVotes%±%
Conservative Sheila van den Bergh 1,311 47.9 +11.2
Conservative Peggy Davies 1,307
Conservative Gordon Lindsay 1,253
Liberal Democrats John Griffin94534.5+2.0
Liberal Democrats Patrick Perks931
Liberal Democrats David Wright781
UKIP Doug Rands48017.5+17.5
UKIP Mike Bobker439
UKIP Harry Aldridge358
Turnout 37.4
Conservative hold Swing
Conservative gain from Liberal Democrats Swing

Bramber, Upper Beeding and Woodmancote

Bramber, Upper Beeding and Woodmancote
PartyCandidateVotes%±%
Conservative Alan Fisher 905 48.5
Conservative Frank Grantham 861
Liberal Democrats Andrew Purches84245.1
Liberal Democrats Marian Brown738
Labour Valerie Neves1196.4
Turnout 43.0
Conservative hold Swing
Conservative gain from Liberal Democrats Swing

Broadbridge Heath

Broadbridge Heath
PartyCandidateVotes%±%
Liberal Democrats Sally Horner 490 63.9 +20.1
Conservative Liz Ostacchini27736.1+0.7
Turnout 37.4
Liberal Democrats hold Swing

Chanctonbury

Chanctonbury
PartyCandidateVotes%±%
Conservative Philip Circus 1,673 64.7 +2.3
Conservative Roger Arthur 1,658
Conservative David Jenkins 1,601
Liberal Democrats Stephen Holbrook56721.9+5.5
UKIP Peter Westrip34713.4+13.4
Turnout 40.5
Conservative hold Swing

Chantry

Chantry
PartyCandidateVotes%±%
Conservative Ray Dawe 1,131 58.8 +3.2
Conservative Chris Mason 1,063
Conservative Jim Sanson 1,046
Liberal Democrats Richard Martin46724.3-20.1
Liberal Democrats Norman Cooper434
UKIP John Wallace32616.9+16.9
Turnout 42.6
Conservative hold Swing

Cowfold, Shermanbury and West Grinstead

Cowfold, Shermanbury and West Grinstead
PartyCandidateVotes%±%
Conservative Ian Shepherd 1,131 74.2 +5.4
Conservative Jonathan Chowen 1,124
Liberal Democrats Susan Stokes39425.8+4.9
Turnout 37.6
Conservative hold Swing

Denne

Denne
PartyCandidateVotes%±%
Liberal Democrats David Sheldon 729 48.5 -0.8
Liberal Democrats Sheila Dale 701
Conservative Clare Norriss52935.2-6.9
Conservative Ronald Vimpany474
BNP Richard Trower15710.4+10.4
Labour Jane Field885.9-2.7
Labour Nicholas Field76
Turnout 41.1
Liberal Democrats hold Swing

Forest

Forest
PartyCandidateVotes%±%
Conservative Gordon Brown 726 48.6 +12.2
Liberal Democrats Godfrey Newman71347.7-11.3
Labour Louise Skipton-Carter563.7-0.9
Turnout 53.6
Conservative gain from Liberal Democrats Swing

Henfield

Henfield
PartyCandidateVotes%±%
Independent Sheila Matthews 989 41.9 -7.8
Conservative Keith Wilkins 873 37.0 -1.0
Conservative Caroline Clarke814
Liberal Democrats Andrew Sharp49821.1+8.8
Turnout 43.0
Independent hold Swing
Conservative hold Swing

Holbrook East

Holbrook East
PartyCandidateVotes%±%
Conservative Andrew Baldwin 1,090 56.3 +15.7
Conservative Linda Pettitt 991
Liberal Democrats Tony Millson71937.2-3.2
Liberal Democrats Nick Chamberlain585
English Democrat William Cobbett1266.5+6.5
Turnout 42.0
Conservative hold Swing
Conservative gain from Liberal Democrats Swing

Holbrook West

Holbrook West
PartyCandidateVotes%±%
Conservative Christian Mitchell 1,018 46.9 +7.6
Conservative Roger Edworthy 959
Liberal Democrats Tony Rickett71232.8-5.3
Liberal Democrats Belinda Walters698
Independent Peter Burgess36116.6+2.4
Labour Raymond Chapman783.6-4.7
Turnout 46.8
Conservative hold Swing

Horsham Park

Horsham Park
PartyCandidateVotes%±%
Liberal Democrats David Holmes 1,132 48.8 +1.4
Liberal Democrats Clive Burgess 1,099
Liberal Democrats Kyle Wickens 944
Conservative Alex Kirke66828.8+9.6
Conservative Jonathan Vickers626
Conservative Matt Taylor615
Labour Jonathan Austin29412.7+3.2
Peace Jim Duggan2269.7+9.7
Turnout 25.3
Liberal Democrats hold Swing

Itchingfield, Slinfold and Warnham

Itchingfield, Slinfold and Warnham
PartyCandidateVotes%±%
Conservative Peter Rowlinson 1,088 52.3 +2.1
Conservative Robert Nye 1,082
Liberal Democrats Michael Dalrymple77237.1-12.7
Liberal Democrats Sally Pavey673
UKIP Stuart Aldridge22010.6+10.6
Turnout 47.0
Conservative hold Swing
Conservative gain from Liberal Democrats Swing

Nuthurst

Nuthurst
PartyCandidateVotes%±%
Conservative John Cox 752 73.4 +0.8
Liberal Democrats Jay Mercer18818.3-9.1
Green Tristan Loraine858.3+8.3
Turnout 45.3
Conservative hold Swing

Pulborough and Coldwatham

Pulborough and Coldwatham
PartyCandidateVotes%±%
Conservative Brian Donnelly 1,154 76.7 +1.8
Conservative Roger Paterson 1,125
Liberal Democrats Maureen Girard35123.3-1.8
Liberal Democrats Robert Margrett318
Turnout 34.2
Conservative hold Swing

Roffey North

Roffey North
PartyCandidateVotes%±%
Liberal Democrats David Skipp 1,194 52.9 +11.9
Liberal Democrats Sarah Gray 1,073
Conservative John Charles79835.4+1.8
Conservative Simon Torn771
BNP Donna Bailey26311.7+11.7
Turnout 45.5
Liberal Democrats hold Swing

Roffey South

Roffey South
PartyCandidateVotes%±%
Conservative Roy Cornell 716 45.4 +18.7
Liberal Democrats Pat Rutherford 693 43.9 -4.9
Conservative Nicholas Lowson676
Liberal Democrats Roger Wilton610
Labour John Thomas16810.7+3.6
Turnout 32.6
Conservative gain from Liberal Democrats Swing
Liberal Democrats hold Swing

Rudgwick

Rudgwick
PartyCandidateVotes%±%
Conservative John Bailey 640 76.7 +6.7
Liberal Democrats Laurence Price16219.4-10.6
Labour Christine Conibear334.0+4.0
Turnout 39.9
Conservative hold Swing

Rusper and Colgate

Rusper and Colgate
PartyCandidateVotes%±%
Conservative Liz Kitchen 585 75.5 -1.9
Liberal Democrats Derek Brundish10813.9-8.7
Independent Dudley Thompson8210.6+10.6
Turnout 38.1
Conservative hold Swing

Southwater

Southwater
PartyCandidateVotes%±%
Conservative Ian Howard 1,575 54.6 +13.8
Conservative Claire Vickers 1,433
Conservative Ross Dye 1,405
Liberal Democrats Peter Stainton1,31245.4-6.3
Liberal Democrats Barbara Varley1,265
Liberal Democrats Garry Jennings1,195
Turnout 41.0
Conservative gain from Liberal Democrats Swing

Steyning

Steyning
PartyCandidateVotes%±%
Conservative Leonard Warner 1,110 33.3 +2.4
Independent George Cockman 1,068 32.0 -7.0
Liberal Democrats Derek Deedman98829.6+7.9
Conservative Michael Willett812
Liberal Democrats Ros Deedman515
Labour Sarah Brookes1675.0+0.5
Turnout 49.1
Conservative hold Swing
Independent hold Swing

Trafalgar

Trafalgar
PartyCandidateVotes%±%
Liberal Democrats Christine Costin 1,264 53.5 -4.8
Liberal Democrats Leonard Crosbie 1,184
Conservative Paul Brown65527.7-5.7
Conservative Marc Kent635
Green Stacey Frier1777.5+7.5
Labour Alexandra Davis1385.8-2.6
UKIP Claire Bridewell1275.3+5.3
Turnout 45.2
Liberal Democrats hold Swing

Related Research Articles

<span class="mw-page-title-main">Borough of Waverley</span> Non-metropolitan district and Borough in England

The Borough of Waverley is a local government district with borough status in Surrey, England. The council is based in the town of Godalming. The borough also contains the towns of Farnham and Haslemere and numerous villages, including the large village of Cranleigh, and surrounding rural areas. At the 2021 Census, the population of the borough was 128,200. The borough is named after Waverley Abbey, near Farnham. Large parts of the borough are within the Surrey Hills Area of Outstanding Natural Beauty.

<span class="mw-page-title-main">Arun District</span> Local government district in West Sussex, England

Arun is a local government district in West Sussex, England. Its council is based in Littlehampton. The district's other towns are Arundel and Bognor Regis. The district is named after the River Arun, which runs through the centre of the district. Parts of the district fall within the South Downs National Park.

<span class="mw-page-title-main">Broadland</span> Non-metropolitan district in England

Broadland is a local government district in Norfolk, England, named after the Norfolk Broads. Its council is based at the Broadland Business Park on the outskirts of Norwich. The district includes the towns of Aylsham, Reepham, Sprowston and Thorpe St Andrew. Several of the district's settlements form part of the Norwich built-up area, lying outside the city's boundaries to the north-west and north-east. The district also includes numerous villages and surrounding rural areas. Some eastern parts of the district lie within The Broads.

<span class="mw-page-title-main">Horsham District</span> Local government district in West Sussex, England

Horsham is a local government district in West Sussex, England. It is named after the town of Horsham, which is its largest settlement and where the council is based. The district also includes the surrounding rural area and contains many villages, the largest of which are Southwater and Billingshurst. The district includes part of the South Downs National Park and part of the designated Area of Outstanding Natural Beauty of High Weald. At the 2021 census the district had a population of 147,487.

Mid Sussex District Council is elected every four years.

<span class="mw-page-title-main">Horsham</span> Market town in West Sussex, England

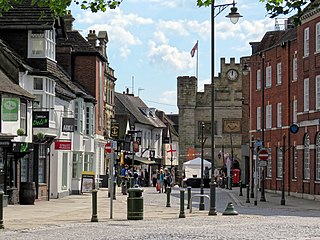
Horsham is a market town on the upper reaches of the River Arun on the fringe of the Weald in West Sussex, England. The town is 31 miles (50 km) south south-west of London, 18.5 miles (30 km) north-west of Brighton and 26 miles (42 km) north-east of the county town of Chichester. Nearby towns include Crawley to the north-east and Haywards Heath and Burgess Hill to the south-east. It is the administrative centre of the Horsham district.

<span class="mw-page-title-main">Horsham District Council elections</span>

Horsham District Council in West Sussex, England, is elected every four years.

<span class="mw-page-title-main">West Sussex County Council</span> British administrative authority

West Sussex County Council is the upper tier local authority for the non-metropolitan county of West Sussex in England.

The 2015 Horsham District Council election took place on 7 May 2015 to elect members of Horsham District Council in England. It was held on the same day as other local elections and the 2015 United Kingdom general election. The Conservatives secured a majority of 17, which was the largest majority any party has ever achieved at a Horsham District Council election.

<span class="mw-page-title-main">2019 Horsham District Council election</span> 2019 UK local government election

The 2019 Horsham District Council election took place on 2 May 2019 to elect members of Horsham District Council in England. It was held on the same day as other local elections. Every seat was contested and the Conservatives retained control of the council with a majority of 8.

The 1973 Horsham District Council election was the first ever for the council and took place on 7 June 1973 to elect members of Horsham District Council in England. It was held on the same day as other local elections. Independent councillors secured a majority of two with 23 seats, the Conservatives won 17 and the Liberal Party won 2. Labour also took part in the elections, fielding candidates in Horsham South & Horsham North only. The Liberal Party were successful in Broadbridge Heath and they were able to secure a seat in Storrington. The Conservative Party achieved good results in some rural areas but they were able to win the vast amount of their seats in the town. Independent councillors won a majority of seats in the villages in the district, sometimes unopposed, some later stood as a Conservative candidate three years later in the next set of elections for the Council.

The 1976 Horsham District Council election took place on 6 May 1976 to elect members of Horsham District Council in England. It was held on the same day as other local elections. The Conservatives won a majority of 9 on the council, gaining from Independent. In a number of seats, candidates who stood as an Independent in 1973, when these seats were last contested, stood again as a Conservative Party candidate. Residents' association won their first seat to the council, winning a seat in Henfield. The Liberal Party lost both of their seats from the previous election three years ago.

The 1979 Horsham District Council election took place on 3 May 1979 to elect members of Horsham District Council in England. It was held on the same day as other local elections and the 1979 United Kingdom general election. The Conservatives retained control of the council with 33 seats, a majority of 12. The Independents had eight councillors elected, a decrease of three from last time. The Liberals gained a seat in Bramber & Upper Beeding and the Residents' association held on to their Henfield seat.

The 1983 Horsham District Council election took place on 5 May 1983 to elect members of Horsham District Council in England. It was held on the same day as other local elections. The Conservatives retained control of the council with 35 seats, a majority of 14, Independent candidates won 5 seats and the SDP–Liberal Alliance won 2.

The 1987 Horsham District Council election took place on 7 May 1987 to elect members of Horsham District Council in England. It was held on the same day as other local elections. The Conservatives retained control of the council with 33 seats, a majority of 12. The SDP–Liberal Alliance won 6 seats and Independents won 4.

The 1991 Horsham District Council election took place on 2 May 1991 to elect members of Horsham District Council in England. It was held on the same day as other local elections. The Conservatives retained control of the council with a reduced majority. The Liberal Democrats gained a net total of 7 and Independent candidates had 2 councillors elected.

The 1995 Horsham District Council election took place on 4 May 1995 to elect members of Horsham District Council in England. It was held on the same day as other local elections. The Liberal Democrats gained control of the council from the Conservatives with a 3 seat majority. This was the first time ever the Conservative Party lost control of Horsham District Council since they first won overall control in 1976.

The 1999 Horsham District Council election took place on 6 May 1999 to elect members of Horsham District Council in England. It was held on the same day as other local elections. The Conservatives won a majority of 3 on the council, gaining from the Liberal Democrats.

The 2003 Horsham District Council election took place on 1 May 2003 to elect members of Horsham District Council in England. It was held on the same day as other local elections. The result left the council with no overall control with the Conservatives one seat short of a majority.

The 2011 Horsham District Council election took place on 5 May 2011 to elect members of Horsham District Council in England. It was held on the same day as other local elections and the 2011 United Kingdom Alternative Vote referendum. The Conservatives increased their majority on the council to 12, winning a total of 34 seats.

References

  1. Andrew Teale. "Local Election Results 2007" . Retrieved 9 June 2020.