1997 West Sussex County Council election

Last updated

Elections to West Sussex County Council were held on 1 May 1997 alongside a parliamentary general election. The whole council was up for election, and the Conservative Party regained control of the council from the Liberal Democrats who had governed since 1993 as a minority administration . Turnout across the county ranged from 57.7% in Richmond to 78.6% in Lindfield.

Contents

Election Result

West Sussex County Council Election Result 1997 [1]
PartySeatsGainsLossesNet gain/lossSeats %Votes %Votes+/−
  Conservative 3752.1142.90177,848
  Liberal Democrats 2433.8033.10137,191
  Labour 912.6821.4989,099
  Independent 11.411.686,494
  Green 00000.00.722,999
  Referendum 00000.00.08327
  Worth Area Party 00000.00.03110

Results by electoral division

Adur

Kingston Buci
PartyCandidateVotes%±%
Liberal Democrats Sydney Little1,85937.2
Conservative Paul Sims1,63932.9
Labour Co-op Nigel Sweet1,49129.9
Majority220
Turnout 72.3
Lancing
PartyCandidateVotes%±%
Liberal Democrats Clifford Robinson2,86646.2
Conservative Simon Craghill2,07033.3
Labour James Largue1,27120.5
Majority794
Turnout 74.2
Saltings
PartyCandidateVotes%±%
Conservative Graham Jones2,56245.2
Liberal Democrats Jemima Robinson2,37241.9
Labour Co-op Richard Knight73312.9
Majority190
Turnout 69.9
Shoreham
PartyCandidateVotes%±%
Conservative Ian Elliott3,10946.6
Liberal Democrats Anthony Burtenshaw2,09431.4
Labour Co-op Geoffrey Howitt1,46321.9
Majority1,015
Turnout 76.6
Sompting
PartyCandidateVotes%±%
Liberal Democrats Malcolm Brookes1,99241.4
Conservative Mark McCarthy1,49231.4
Labour Edward Luxford1,33121.9
Majority500
Turnout 71.6
Southwick
PartyCandidateVotes%±%
Labour Co-op Brian Whipp1,85635.8
Conservative Robert Dunn1,82735.3
Liberal Democrats Derek Deedman1,49728.9
Majority29
Turnout 74.5

Arun

Arun East
PartyCandidateVotes%±%
Conservative Christopher Sedgwick3,16563.6
Liberal Democrats John Hughes1,32626.7
Labour Frank Levy4829.7
Majority1,839
Turnout 78.1
Arundel and Angmering
PartyCandidateVotes%±%
Conservative Margaret Winn3,14951.8
Liberal Democrats John Barstow1,70728.1
Labour David Jones1,22120.1
Majority1,442
Turnout 74.3
Bersted
PartyCandidateVotes%±%
Liberal Democrats Sylvia Olliver2,57738.5
Conservative Gary Boucher2,17132.4
Labour Jan Cosgrove1,94829.1
Majority406
Turnout 67.5
Bognor Regis
PartyCandidateVotes%±%
Conservative Robin Brown2,76844.6
Liberal Democrats Kenneth Scutt2,44439.4
Labour Gail Walker99516.0
Majority324
Turnout 67.8
Felpham
PartyCandidateVotes%±%
Independent Dominica Smith3,03554.6
Liberal Democrats Walter Vanner1,62129.2
Labour Alison McIsacc89916.2
Majority1,432
Turnout 70.5
Fontwell
PartyCandidateVotes%±%
Conservative Harold Hall3,19956.4
Liberal Democrats Simon McDougall1,89633.4
Labour Thomas Oxtoby57610.2
Majority1,297
Turnout 72.3
Hotham
PartyCandidateVotes%±%
Liberal Democrats Catherine Morrish1,97539.7
Conservative Luke Parker1,61032.4
Labour Derek Fane1,38827.9
Majority365
Turnout 63.3
Littlehampton North
PartyCandidateVotes%±%
Labour George O'Neill2,11344.9
Conservative John Forster1,50832.0
Liberal Democrats David Jones1,08723.1
Majority606
Turnout 63.7
Littlehampton Town
PartyCandidateVotes%±%
Conservative Elizabeth Newell2,02234.0
Liberal Democrats Barbara Roberts1,73029.1
Labour David Dyball1,71128.7
Independent Andrew Hawkes4928.3
Majority292
Turnout 63.7
Middleton
PartyCandidateVotes%±%
Conservative John Betteridge2,56645.5
Liberal Democrats John Matthews1,98935.3
Labour Peter Found88415.7
Independent Marjorie Widdowson2023.6
Majority577
Turnout 71.9
Nyetimber
PartyCandidateVotes%±%
Conservative Christopher Gillings3,40949.7
Liberal Democrats Francis Oppler1,91427.9
Labour Michael Jones1,53122.3
Majority1,576
Turnout 73.6
Preston Manor
PartyCandidateVotes%±%
Conservative Peter Moor3,61054.7
Liberal Democrats John Richards2,07031.4
Labour Peter Nightingale91413.9
Majority1,540
Turnout 73.6
Rustington West
PartyCandidateVotes%±%
Liberal Democrats James Walsh2,80245.2
Conservative Phillipa Bower2,56341.3
Labour John Singleton83513.9
Majority239
Turnout 73.6

Chichester

Bourne
PartyCandidateVotes%±%
Conservative Thomas Dunn2,50340.5
Liberal Democrats Roy Ford1,89430.6
Independent Stanley Bray98615.9
Labour Roger Humphrey80113.0
Majority609
Turnout 73.6
Chichester East
PartyCandidateVotes%±%
Liberal Democrats Colin Tupper2,24645.7
Conservative Jane Chevs1,74235.5
Labour Timothy Weeks92518.8
Majority506
Turnout 68.5
Chichester North
PartyCandidateVotes%±%
Conservative Alan Phillips2,38645.5
Liberal Democrats Edith Pingree2,23242.6
Labour James Moran62511.9
Majority56
Turnout 76.2
Chichester South
PartyCandidateVotes%±%
Liberal Democrats John Rankin2,58944.1
Conservative Mary-Louise Bassett2,33839.8
Labour Geoffrey Jones94316.1
Majority251
Turnout 73.0
Chichester West
PartyCandidateVotes%±%
Conservative Kathryn Ward2,94746.2
Liberal Democrats Jennifer Wright2,50039.2
Labour Ian Edwards92614.5
Majority447
Turnout 76.3
Fernhurst
PartyCandidateVotes%±%
Conservative Terence Pemberton3,03450.5
Liberal Democrats Helena Lang2,39539.9
Labour David Morrison5769.6
Majority639
Turnout 72.3
Midhurst
PartyCandidateVotes%±%
Conservative Colin Walker3,75355.9
Liberal Democrats Robert Devreux2,09031.1
Labour Bernard Hollowood87413.0
Majority1,763
Turnout 74.3
Petworth
PartyCandidateVotes%±%
Conservative Sarah Greenwell3,75556.4
Independent Brian Hooton1,77926.7
Labour Andrew Young1,12816.9
Majority1,976
Turnout 76.8
Selsey and Sidlesham
PartyCandidateVotes%±%
Conservative Peter Jones2,79648.9
Labour Terrence Prince1,39424.4
Liberal Democrats Michael Shone1,33123.3
Green Eric Paine1913.3
Majority1,402
Turnout 69.9
The Witterings
PartyCandidateVotes%±%
Conservative John Daws-Chew3,52154.2
Liberal Democrats Simon Green2,15033.1
Labour John Feeney83012.8
Majority1,369
Turnout 72.2

Crawley

Bewbush
PartyCandidateVotes%±%
Labour Janet Scully3,77170.6
Conservative Lee Burke1,56929.4
Majority2,202
Turnout 66.9
Broadfield
PartyCandidateVotes%±%
Labour Michael Briggs3,01259.1
Conservative David Bowen1,45828.6
Liberal Democrats Linda Hamilton62712.3
Majority1,552
Turnout 64.0
Furnace Green
PartyCandidateVotes%±%
Conservative Henry Smith3,83944.8
Labour Anne Todd3,52141.1
Liberal Democrats Darren Wise1,20914.1
Majority318
Turnout 71.9
Gossops Green
PartyCandidateVotes%±%
Labour Anthony Edwards2,62851.8
Conservative Geoffrey Clarke1,74934.5
Liberal Democrats Josephine Hart69613.7
Majority879
Turnout 71.9
Ifield
PartyCandidateVotes%±%
Labour John Mortimer2,53259.4
Conservative Corrine Bowen1,18127.7
Liberal Democrats Howard Llewelyn54812.9
Majority1,351
Turnout 71.2
Langley Green
PartyCandidateVotes%±%
Labour James Smith3,29268.2
Conservative Sthphen Wilkinson1,14023.6
Liberal Democrats Vipin Patel3928.1
Majority2,152
Turnout 71.9
Northgate Three Bridges
PartyCandidateVotes%±%
Labour William Buck2,85450.9
Conservative Colin Coyston1,58528.2
Liberal Democrats Barry Hamilton1,17220.9
Majority1,269
Turnout 74.5
Pound Hill
PartyCandidateVotes%±%
Conservative David Dewdney2,80448.9
Labour Raymond Calcot1,95434.1
Liberal Democrats Martin Hart86615.1
Worth Area Party Peter Temple-Smithson1101.9
Majority850
Turnout 75.0
Tilgate
PartyCandidateVotes%±%
Labour Douglas Mayne3,34261.9
Conservative David Withall1,37225.4
Liberal Democrats Richard Miller68612.7
Majority1,970
Turnout 73.6

Horsham

Billingshurst
PartyCandidateVotes%±%
Conservative Tara Podger2,11644.1
Liberal Democrats Geoffrey Lawes1,70635.5
Labour Philip Gander65013.5
Referendum Robert Lomas3276.8
Majority410
Turnout 72.0
Henfield
PartyCandidateVotes%±%
Conservative William Cantello3,58758.3
Liberal Democrats Marcus Heawood1,60726.1
Labour Susan Erlam96115.6
Majority1,970
Turnout 74.9
Holbrook
PartyCandidateVotes%±%
Conservative Neil Matthewson4,20751.9
Liberal Democrats Derek Brundish2,63932.6
Labour Raymond Chapman1,25415.5
Majority1,568
Turnout 73.7
Hurst
PartyCandidateVotes%±%
Liberal Democrats Nigel Dennis2,20745.9
Conservative Peter Tobutt2,04342.5
Labour Joan Thurston55915.6
Majority164
Turnout 71.1
Pulborough
PartyCandidateVotes%±%
Conservative Carmel Cain5,09374.0
Labour Christine Rees1,78826.0
Majority3,305
Turnout 73.3
Riverside
PartyCandidateVotes%±%
Liberal Democrats Morwen Millson2,79046.6
Conservative Barbara Palmer2,40540.2
Labour George Burton78813.2
Majority385
Turnout 72.6
Roffey
PartyCandidateVotes%±%
Liberal Democrats Jacobus Clausen2,60640.8
Conservative Brian Watson2,60340.7
Labour Roger Brown1,17918.5
Majority3
Turnout 74.0
Southwater
PartyCandidateVotes%±%
Liberal Democrats Mary Beeson3,30344.6
Conservative Trevor Boud3,13542.3
Labour Diane Dumbrill96813.1
Majority168
Turnout 73.8
Steyning
PartyCandidateVotes%±%
Liberal Democrats John Campbell2,95647.3
Conservative Anthony Dennis2,64942.4
Labour Julia Bridgewater63910.2
Majority307
Turnout 74.2
Storrington
PartyCandidateVotes%±%
Conservative Frank Wilkinson2,78151.3
Liberal Democrats Kenneth Bates2,04237.7
Labour David Wickham59411.0
Majority739
Turnout 72.8
Warnham
PartyCandidateVotes%±%
Conservative Norman Horton2,66650.9
Liberal Democrats David Wright1,99038.0
Labour Eric Brady58311.1
Majority676
Turnout 74.6

Mid Sussex

Burgess Hill Central
PartyCandidateVotes%±%
Liberal Democrats Angela Chapman3,25845.8
Conservative Peter Burgess2,53235.6
Labour Paul Mitchell1,17016.4
Green Hugh Stevens1552.2
Majority906
Turnout 76.9
Burgess Hill East
PartyCandidateVotes%±%
Liberal Democrats Heather Ross2,90351.3
Conservative Michael Greenhow1,96434.7
Labour Lesley Whiting66411.7
Green Ruth Stevens1282.3
Majority939
Turnout 77.2
Cuckfield Rural
PartyCandidateVotes%±%
Conservative Michael Dennis3,06651.8
Liberal Democrats Jack Slaughter1,76329.8
Labour Frederick Harrison77413.1
Green Josephine Came3175.4
Majority1,303
Turnout 78.0
East Grinstead East
PartyCandidateVotes%±%
Liberal Democrats Margaret Collins2,64545.6
Conservative Margaret Ball2,23938.6
Labour Margaret Scott69211.9
Green Adrian Salmon2263.9
Majority407
Turnout 76.9
East Grinstead South
PartyCandidateVotes%±%
Liberal Democrats Andrew Brock2,47044.1
Conservative Allan Beal2,42943.3
Labour David Dickson70512.6
Majority41
Turnout 76.7
Hassocks and Burgess Hill West
PartyCandidateVotes%±%
Liberal Democrats Tony Balsdon3,23846.2
Conservative David Terry2,49435.6
Labour Patricia Ashcroft1,10215.7
Green Carol Filby1692.4
Majority744
Turnout 77.3
Haywards Heath East
PartyCandidateVotes%±%
Conservative Joan Gayler1,94735.1
Labour Mervyn Hamilton1,74331.4
Liberal Democrats Julia Brown1,73531.3
Green Edward Hasley1252.3
Majority204
Turnout 78.2
Haywards Heath West
PartyCandidateVotes%±%
Liberal Democrats Brian Hall2,55746.6
Conservative John Wilson1,93735.3
Labour Paddy Henry83515.2
Green Simon Anderson1562.8
Majority620
Turnout 77.5
Imberdown
PartyCandidateVotes%±%
Conservative Phillip Coote3,57346.3
Liberal Democrats Dorothy Hatswell2,74735.6
Labour Roger Burgess1,17915.3
Green Stephanie Gibson2232.9
Majority826
Turnout 76.6
Lindfield
PartyCandidateVotes%±%
Conservative Margaret Johnson2,78948.2
Liberal Democrats Anne-Marie Lucraft2,01934.9
Labour Nicholas Lightbody76113.2
Green Peter Weymss-Gorman2153.7
Majority770
Turnout 78.6
Mid Sussex North
PartyCandidateVotes%±%
Conservative William Acraman3,28853.2
Liberal Democrats Nicholas Dennis1,37922.3
Labour Joe Mitchell1,29120.9
Green Maurice Weeler2233.6
Majority1,909
Turnout 74.2
Mid Sussex South
PartyCandidateVotes%±%
Conservative Barrington Mack3,11256.0
Liberal Democrats Anthony Davies1,47726.6
Labour Maureen Ryan79514.3
Green Nadia Seefreid1763.2
Majority1,635
Turnout 78.1

Worthing

Broadwater
PartyCandidateVotes%±%
Liberal Democrats Amanda Claire2,36246.3
Conservative Celia Bettelley1,76934.7
Labour Michael Wooley97419.1
Majority1,59231.2
Turnout 5,10569.9
Cissbury
PartyCandidateVotes%±%
Conservative Collingwood O'Neill3,24151.8
Liberal Democrats George Miller2,44139.0
Labour Teana Ashley5779.2
Majority800
Turnout 74.0
Durrington
PartyCandidateVotes%±%
Liberal Democrats Nicholas Rodgers2,40044.0
Conservative Patricia Farrel2,32642.6
Labour Karen Hammond73413.4
Majority74
Turnout 71.1
East Worthing
PartyCandidateVotes%±%
Liberal Democrats Irene Richards2,00941.0
Conservative Tony Jackson1,73735.4
Labour Colin Marshall99620.3
Green Joan Glass1613.3
Majority272
Turnout 62.7
Goring-by-Sea
PartyCandidateVotes%±%
Conservative Graham Forshaw3,35154.2
Liberal Democrats Stewart McGurn-Stewart2,13434.5
Labour Olive Rand69611.3
Majority2,217
Turnout 71.9
Maybridge
PartyCandidateVotes%±%
Liberal Democrats Peter Green2,30045.7
Conservative Paul Bleasdale1,76935.2
Labour Peter Balderstone96119.1
Majority531
Turnout 72.0
Richmond
PartyCandidateVotes%±%
Conservative John Livermore1,65441.2
Liberal Democrats Cyril Selby1,51937.8
Labour John Hammond66516.6
Green Derek Colkett1794.5
Majority135
Turnout 57.7
Salvington
PartyCandidateVotes%±%
Conservative Clement Stevens2,60146.1
Liberal Democrats Dennis Rowley2,32741.3
Labour Jean Wicks71312.6
Majority229
Turnout 72.3
West Parade
PartyCandidateVotes%±%
Conservative Esther Giddins3,17753.6
Liberal Democrats Helen Brown1,78930.2
Labour Julie Balderstone78013.2
Green Lucielle Cokett1853.1
Majority1,388
Turnout 69.5
West Tarring
PartyCandidateVotes%±%
Liberal Democrats John Rose2,43248.5
Conservative Henry Kemp1,65733.0
Labour John Parr75915.1
Green Stuart Colgate1703.4
Majority585
Turnout 66.8

Related Research Articles

<span class="mw-page-title-main">West Sussex</span> County of England

West Sussex is a ceremonial county in South East England. It is bordered by Surrey to the north, East Sussex to the east, the English Channel to the south, and Hampshire to the west. The largest settlement is Crawley, and the county town is the city of Chichester.

<span class="mw-page-title-main">Mid Sussex District</span> Non-metropolitan district in England

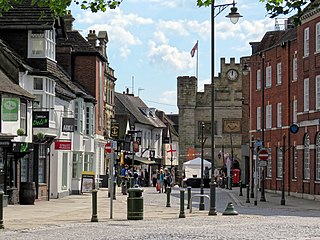
Mid Sussex is a local government district in West Sussex, England. The largest town is Haywards Heath, where the council is based. The district also contains the towns of Burgess Hill and East Grinstead plus surrounding rural areas, including many villages. The district includes part of the South Downs National Park and part of the designated Area of Outstanding Natural Beauty of High Weald, including sections of Ashdown Forest. The district contains most headwaters of the River Ouse. Its largest body of water is Ardingly reservoir which is used by watersports clubs. At the 2021 census the district had a population of 152,949.

<span class="mw-page-title-main">Arun District</span> Local government district in West Sussex, England

Arun is a local government district in West Sussex, England. Its council is based in Littlehampton. The district's other towns are Arundel and Bognor Regis. The district is named after the River Arun, which runs through the centre of the district. Parts of the district fall within the South Downs National Park.

<span class="mw-page-title-main">Horsham District</span> Local government district in West Sussex, England

Horsham is a local government district in West Sussex, England. It is named after the town of Horsham, which is its largest settlement and where the council is based. The district also includes the surrounding rural area and contains many villages, the largest of which are Southwater and Billingshurst. The district includes part of the South Downs National Park and part of the designated Area of Outstanding Natural Beauty of High Weald. At the 2021 census the district had a population of 147,487.

West Sussex County Council in England is elected every four years.

East Sussex County Council in England is elected every four years.

<span class="mw-page-title-main">East Sussex County Council</span>

East Sussex County Council is the upper tier local authority for the non-metropolitan county of East Sussex in England.

<span class="mw-page-title-main">West Sussex County Council</span> British administrative authority

West Sussex County Council is the upper tier local authority for the non-metropolitan county of West Sussex in England.

<span class="mw-page-title-main">2009 West Sussex County Council election</span> 2009 UK local government election

The West Sussex County Council election, 2009 were elections to West Sussex County Council which took place on 4 June 2009, having been delayed from 7 May, in order to coincide with elections to the European Parliament.

<span class="mw-page-title-main">Angmering & Findon (electoral division)</span>

Angmering & Findon is an electoral division of West Sussex in the United Kingdom and returns one member to sit on West Sussex County Council. The current County Councillor, Deborah Urquhart, is also Cabinet Member for Environment & Economy.

<span class="mw-page-title-main">Bersted (electoral division)</span> British electoral division

Bersted is an electoral division of West Sussex in the United Kingdom and returns one member to sit on West Sussex County Council.

<span class="mw-page-title-main">Durrington & Salvington (electoral division)</span> Electoral district in england

Durrington & Salvington is an electoral division of West Sussex in England, and returns one member to sit on West Sussex County Council.

<span class="mw-page-title-main">Hassocks & Victoria (electoral division)</span>

Hassocks & Victoria was an electoral division of West Sussex in the United Kingdom, and returned one member to sit on West Sussex County Council from 1997 to 2017. In 2017 it was replaced by a new division, Hassocks & Burgess Hill South.

<span class="mw-page-title-main">Haywards Heath East (electoral division)</span>

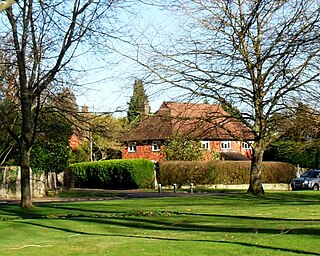
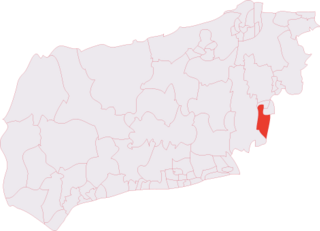
Haywards Heath East is an electoral division of West Sussex in the United Kingdom, and returns one member to sit on West Sussex County Council.

<span class="mw-page-title-main">Storrington (electoral division)</span>

Storrington is an electoral division of West Sussex in the United Kingdom and returns one member to West Sussex County Council.

Elections to West Sussex County Council were held on 7 June 2001, alongside a parliamentary general election. The whole council was up for election, and the Conservative Party remained in control of the council. Turnout across the county ranged from 42.7% in Broadfield to 69.6% in Midhurst, with the county average standing at 60.8%.

<span class="mw-page-title-main">2013 West Sussex County Council election</span> 2013 UK local government election

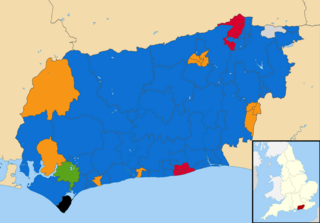
The West Sussex County Council election, 2013 took place on 2 May 2013, as part of the 2013 United Kingdom local elections. All 71 electoral divisions were up for election, which returned one county councillor each by first-past-the-post voting for a four-year term of office. At this election, the Conservative Party was seeking to retain overall control of the council, and the Liberal Democrats to maintain their position as the main opposition party.

<span class="mw-page-title-main">2017 West Sussex County Council election</span> 2017 UK local government election

The 2017 West Sussex County Council election took place as part of the 2017 local elections in the UK. All councillors were elected for single-member electoral divisions for a four-year term. The voting system used was first-past-the-post.

<span class="mw-page-title-main">2021 East Sussex County Council election</span> 2021 UK local government election

The 2021 East Sussex County Council election took place alongside the other local elections. All 50 seats to East Sussex County Council were up for election.

<span class="mw-page-title-main">2021 West Sussex County Council election</span> 2021 UK local government election

The West Sussex County Council election took place on 6 May 2021 alongside other local elections. All 70 seats to West Sussex County Council were elected. Labour gained 4 seats in the Worthing division, while the Green Party and Local Alliance gained their first ever seats on the council.

References

  1. "West Sussex County Council Election Results 1973-2009" (PDF). The Elections Centre. Retrieved 21 February 2024.