| ||||||||||||||||||||||||||||||||||||||||||||||||||||||||||||||||||||
All 79 seats to Essex County Council 40 seats needed for a majority | ||||||||||||||||||||||||||||||||||||||||||||||||||||||||||||||||||||
---|---|---|---|---|---|---|---|---|---|---|---|---|---|---|---|---|---|---|---|---|---|---|---|---|---|---|---|---|---|---|---|---|---|---|---|---|---|---|---|---|---|---|---|---|---|---|---|---|---|---|---|---|---|---|---|---|---|---|---|---|---|---|---|---|---|---|---|---|
| ||||||||||||||||||||||||||||||||||||||||||||||||||||||||||||||||||||
|
An election to Essex County Council took place on 1 May 1997 as part of the 1997 United Kingdom local elections. 79 councillors were elected from various electoral divisions, which returned either one or two county councillors each by first-past-the-post voting for a four-year term of office. With the creation of Southend-on-Sea Borough Council and Thurrock Council in 1998 the number of seats contested at this election was reduced by 19. In 1993 the breakdown of these seats were, Lab 9 Con 5 LD 5.
This section is empty. You can help by adding to it. (February 2014) |
Party | Seats | |
---|---|---|
Labour | 33 | |
Conservative | 32 | |
Liberal Democrats | 32 | |
Independent | 1 | |
Total | 79 |
Party | Seats | |
---|---|---|
Labour | 34 | |
Liberal Democrats | 32 | |
Conservative | 31 | |
Independent | 1 | |
Total | 79 |
Party | Seats | Gains | Losses | Net gain/loss | Seats % | Votes % | Votes | +/− | |
---|---|---|---|---|---|---|---|---|---|
Conservative | 40 | 14 | 1 | 13 | 50.6 | 38.9 | 281,074 | +3.6 | |
Labour | 23 | 2 | 3 | 1 | 29.1 | 31.7 | 229,181 | +1.0 | |
Liberal Democrats | 15 | 1 | 13 | 12 | 19.0 | 26.6 | 192,520 | −5.3 | |
Loughton Residents | 1 | 1 | 1 | 1.3 | 0.7 | 5,040 | +0.7 | ||
Green | 0 | 1.1 | 7,907 | +0.1 | |||||
Independent | 0 | 1 | 1 | 1.0 | 7,378 | +0.2 | |||
Socialist Alliance | 0 | >0.1 | 220 | N/A | |||||
Total | 79 | 723,320 |
Paul White (Stock) was elected leader of the Conservative Group, Mervyn Juliff (Great Parndon) was elected leader of the Labour Group and Kenneth Jones (Park) was elected leader of the Liberal Democratic Group.
Despite winning less than half the seats contested, the incumbent Labour-Liberal Democrat coalition continued in government because the members from Southend and Thurrock (whose seats had not been contested at the election) gave them a 52 to 45 majority over the Conservatives until April 1998 when those seats would be abolished. [3]
After council leader Chris Pearson (Tendring Rural West), wasn't reelected in Maypole, Mervyn Juliff (Great Parndon) became council leader until the departure of the 19 Southend and Thurrock councilors, at which point Conservative group leader Paul White became leader. [4]
However in May 1999 Alison Enkel (Brentwood Rural) resigned from the Conservatives. [5] This following a by election loss to Labour a year before gave control of the council back to the Labour-Liberal Democrat coalition. [6]
This proved unworkable as with further resignations leading to a power struggle before defeat in budget vote which caused the coalition to resign and the Conservatives to return. [7] [8]
District Summary
Party | Seats | +/- | Votes | % | +/- | |
---|---|---|---|---|---|---|
Labour | 5 | 0 | 35,336 | 39.9 | −1.0 | |
Conservative | 5 | 1 | 33,144 | 37.4 | −0.1 | |
Liberal Democrat | 0 | 1 | 20,021 | 22.6 | +1.5 | |
Socialist Alliance | 0 | 0 | 120 | 0.1 | New | |
Division Results
Party | Candidate | Votes | % | ±% | |
---|---|---|---|---|---|
Conservative | Donald Morris | 3,586 | 44.0 | +4.5 | |
Liberal Democrats | Geoffrey Williams * | 2,520 | 30.9 | −13.2 | |
Labour | Liv Roe | 2,052 | 25.2 | +8.7 | |
Majority | 1,066 | 13.1 | |||
Turnout | 8,158 | 73.3 | +32.5 | ||
Conservative gain from Liberal Democrats | Swing | 8.9 | |||
Party | Candidate | Votes | % | ±% | |
---|---|---|---|---|---|
Labour | William Archibald * | 4,427 | 66.4 | −1.6 | |
Conservative | Sandra Elliott | 1,610 | 24.1 | +1.6 | |
Liberal Democrats | Terry Marsh | 631 | 9.5 | ±0.0 | |
Majority | 2,817 | 42.2 | +3.3 | ||
Turnout | 6,668 | 68.6 | +29.5 | ||
Labour hold | Swing | 1.6 | |||
Party | Candidate | Votes | % | ±% | |
---|---|---|---|---|---|
Labour | Anthony Wright | 4,935 | 61.0 | −4.3 | |
Conservative | Andrew Elliott | 2,105 | 26.0 | +0.3 | |
Liberal Democrats | Michael Dickinson | 1,056 | 13.0 | +4.0 | |
Majority | 2,830 | 35.0 | −4.6 | ||
Turnout | 8,096 | 71.9 | +30.0 | ||
Labour hold | Swing | 2.3 | |||
Party | Candidate | Votes | % | ±% | |
---|---|---|---|---|---|
Labour | Rachel Liebeschuetz * | 3,679 | 56.1 | −1.5 | |
Conservative | David Walsh | 1,930 | 29.4 | −2.0 | |
Liberal Democrats | Vivien Howard | 950 | 14.5 | +3.5 | |
Majority | 1,749 | 26.7 | +0.5 | ||
Turnout | 6,559 | 65.5 | +29.4 | ||
Labour hold | Swing | 0.3 | |||
Party | Candidate | Votes | % | ±% | |
---|---|---|---|---|---|
Labour | Keith Bobbin | 5,791 | 54.3 | −3.2 | |
Conservative | Jacqueline Blake | 3,381 | 31.7 | −1.4 | |
Liberal Democrats | David Birch | 1,369 | 12.8 | +3.4 | |
Socialist Alliance | David Murray | 120 | 1.1 | N/A | |
Majority | 2,410 | 22.6 | −1.8 | ||
Turnout | 10,661 | 63.5 | +29.1 | ||
Labour hold | Swing | 0.9 | |||
Party | Candidate | Votes | % | ±% | |
---|---|---|---|---|---|
Labour | Swatantra Nandanwar | 4,668 | 57.2 | −4.6 | |
Conservative | Stephen Hillier | 2,213 | 27.1 | −0.9 | |
Liberal Democrats | Mark Hersom | 1,285 | 15.7 | +5.5 | |
Majority | 2,455 | 30.1 | −3.7 | ||
Turnout | 8,166 | 64.6 | +27.6 | ||
Labour hold | Swing | 1.9 | |||
Party | Candidate | Votes | % | ±% | |
---|---|---|---|---|---|
Conservative | Brinley Jones * | 3,958 | 40.8 | +0.1 | |
Labour | Susanna Caira-Neeson | 3,458 | 35.7 | −2.1 | |
Liberal Democrats | Joseph White | 2,275 | 23.5 | +2.0 | |
Majority | 500 | 5.2 | +2.3 | ||
Turnout | 9,691 | 76.4 | +32.7 | ||
Conservative hold | Swing | 1.1 | |||
Party | Candidate | Votes | % | ±% | |
---|---|---|---|---|---|
Conservative | Angela Watkinson | 5,338 | 51.3 | −10.5 | |
Liberal Democrats | Ronald Dowden | 3,598 | 34.6 | +7.4 | |
Labour | Margaret Viney | 1,473 | 14.2 | +3.2 | |
Majority | 1,740 | 16.7 | −17.8 | ||
Turnout | 10,409 | 75.5 | +42.1 | ||
Conservative hold | Swing | 9.0 | |||
Party | Candidate | Votes | % | ±% | |
---|---|---|---|---|---|
Conservative | Kay Twitchen * | 4,287 | 43.3 | +2.8 | |
Liberal Democrats | Geoffrey Taylor | 3,694 | 37.3 | −0.7 | |
Labour | Geoffrey Viney | 1,930 | 19.5 | +3.4 | |
Majority | 593 | 6.0 | +3.5 | ||
Turnout | 9,911 | 75.7 | +37.2 | ||
Conservative hold | Swing | 1.8 | |||
Party | Candidate | Votes | % | ±% | |
---|---|---|---|---|---|
Conservative | Iris Pummell * | 4,736 | 46.0 | −2.6 | |
Labour | Ian Hancock | 2,923 | 28.4 | +10.0 | |
Liberal Democrats | Lesley Pattison | 2,643 | 25.7 | −7.3 | |
Majority | 1,813 | 17.6 | +2.0 | ||
Turnout | 10,302 | 72.3 | +25.0 | ||
Conservative hold | Swing | 6.3 | |||
District Summary
Party | Seats | +/- | Votes | % | +/- | |
---|---|---|---|---|---|---|
Labour | 4 | 0 | 26,705 | 37.2 | −3.0 | |
Conservative | 2 | 0 | 26,812 | 37.3 | +2.1 | |
Liberal Democrat | 1 | 0 | 15,388 | 21.4 | −0.7 | |
Green | 0 | 0 | 2,909 | 4.1 | +1.5 | |
Division Results
Party | Candidate | Votes | % | ±% | |
---|---|---|---|---|---|
Labour | Frederick Card * | 3,925 | 42.4 | −1.9 | |
Conservative | Simon Walsh | 3,412 | 36.8 | +2.0 | |
Liberal Democrats | Anthony Meadows | 1,584 | 17.1 | −1.3 | |
Green | Wendy Partridge | 340 | 3.7 | +1.2 | |
Majority | 513 | 5.5 | −4.0 | ||
Turnout | 9,261 | 70.1 | +26.1 | ||
Labour hold | Swing | 2.0 | |||
Party | Candidate | Votes | % | ±% | |
---|---|---|---|---|---|
Labour | Elwyn Bishop * | 4,682 | 40.6 | −6.0 | |
Conservative | Nigel Edey | 4,553 | 39.5 | +3.1 | |
Liberal Democrats | Lesley Beckett | 1,967 | 17.1 | +3.1 | |
Green | Susan Ransome | 332 | 2.9 | −0.1 | |
Majority | 129 | 1.1 | −9.0 | ||
Turnout | 11,534 | 79.3 | +36.4 | ||
Labour hold | Swing | 4.6 | |||
Party | Candidate | Votes | % | ±% | |
---|---|---|---|---|---|
Liberal Democrats | Douglas Rice * | 3,837 | 33.4 | −11.8 | |
Conservative | Roger Wacey | 3,714 | 32.3 | +4.6 | |
Labour | Robert Miller | 3,630 | 31.6 | +7.2 | |
Green | Nelson Brunton | 318 | 2.8 | ±0.0 | |
Majority | 123 | 1.1 | −16.4 | ||
Turnout | 11,499 | 75.0 | +34.6 | ||
Liberal Democrats hold | Swing | 8.2 | |||
Party | Candidate | Votes | % | ±% | |
---|---|---|---|---|---|
Conservative | Joseph Pike * | 4,153 | 40.2 | +1.5 | |
Labour | John Kotz | 3,355 | 32.4 | −5.9 | |
Liberal Democrats | Oliver Forder | 2,393 | 23.1 | +0.1 | |
Green | Lyn Peacock | 442 | 4.3 | N/A | |
Majority | 798 | 7.7 | +7.3 | ||
Turnout | 10,343 | 73.6 | +36.0 | ||
Conservative hold | Swing | 3.7 | |||
Party | Candidate | Votes | % | ±% | |
---|---|---|---|---|---|
Conservative | Geoffrey Waterer * | 4,311 | 44.8 | −1.4 | |
Liberal Democrats | Trevor Ellis | 2,529 | 26.3 | +0.7 | |
Labour | Edward Snarey | 2,458 | 25.6 | −2.6 | |
Green | Kevin Peterson | 319 | 3.3 | N/A | |
Majority | 1,782 | 18.5 | +0.5 | ||
Turnout | 9,617 | 77.1 | +38.5 | ||
Conservative hold | Swing | 1.1 | |||
Party | Candidate | Votes | % | ±% | |
---|---|---|---|---|---|
Labour | Joan Lyon * | 4,845 | 47.3 | −10.2 | |
Conservative | Dennis Willetts | 3,090 | 30.2 | +5.3 | |
Liberal Democrats | Roy Cavinder | 1,503 | 14.7 | +2.9 | |
Green | James Abbott | 802 | 7.8 | +1.9 | |
Majority | 1,755 | 17.1 | −15.5 | ||
Turnout | 10,240 | 73.2 | +38.7 | ||
Labour hold | Swing | 7.8 | |||
Party | Candidate | Votes | % | ±% | |
---|---|---|---|---|---|
Labour | John Gyford * | 3,810 | 40.9 | −1.8 | |
Conservative | Michael Lager | 3,579 | 38.4 | −0.6 | |
Liberal Democrats | Christine May | 1,575 | 16.9 | +5.1 | |
Green | Philip Hughes | 356 | 3.8 | −0.2 | |
Majority | 231 | 2.5 | −1.3 | ||
Turnout | 9,320 | 73.3 | +38.3 | ||
Labour hold | Swing | 0.6 | |||
District Summary
Party | Seats | +/- | Votes | % | +/- | |
---|---|---|---|---|---|---|
Conservative | 4 | 4 | 18,258 | 43.8 | +7.9 | |
Liberal Democrat | 1 | 4 | 15,046 | 36.1 | −15.5 | |
Labour | 0 | 0 | 7,965 | 19.1 | +9.4 | |
Green | 0 | 0 | 400 | 1.0 | −1.9 | |
Division Results
Party | Candidate | Votes | % | ±% | |
---|---|---|---|---|---|
Liberal Democrats | Edgar Davis * | 2,941 | 42.8 | −16.1 | |
Conservative | Francis Kenny | 2,532 | 36.9 | +6.7 | |
Labour | Martin Coule | 1,393 | 20.3 | +12.8 | |
Majority | 409 | 14.8 | −13.9 | ||
Turnout | 6,866 | 75.4 | +33.2 | ||
Liberal Democrats hold | Swing | 11.4 | |||
Party | Candidate | Votes | % | ±% | |
---|---|---|---|---|---|
Conservative | John Roberts | 4,511 | 48.7 | +5.1 | |
Liberal Democrats | Richard Davies | 3,139 | 33.9 | −10.0 | |
Labour | Charles Bisson | 1,611 | 17.4 | +7.4 | |
Majority | 1,372 | 14.8 | |||
Turnout | 9,261 | 75.4 | +40.5 | ||
Conservative gain from Liberal Democrats | Swing | 7.6 | |||
Party | Candidate | Votes | % | ±% | |
---|---|---|---|---|---|
Conservative | Judith Gray | 3,186 | 45.5 | +7.3 | |
Liberal Democrats | Norman Spencer | 2,615 | 37.3 | −15.4 | |
Labour | Rosalind Brown | 1,201 | 17.2 | +10.1 | |
Majority | 571 | 8.2 | |||
Turnout | 7,002 | 74.7 | +36.3 | ||
Conservative gain from Liberal Democrats | Swing | 11.4 | |||
Party | Candidate | Votes | % | ±% | |
---|---|---|---|---|---|
Conservative | Alison Enkel | 4,230 | 43.1 | +10.5 | |
Liberal Democrats | Derek Hardy * | 3,879 | 39.5 | −18.6 | |
Labour | Paul Bartley | 1,303 | 13.3 | +7.0 | |
Green | Carolyn Bartley | 400 | 4.1 | +1.1 | |
Majority | 351 | 3.6 | |||
Turnout | 9,812 | 76.8 | +32.7 | ||
Conservative gain from Liberal Democrats | Swing | 14.6 | |||
Party | Candidate | Votes | % | ±% | |
---|---|---|---|---|---|
Conservative | Lionel Lee * | 3,799 | 43.5 | +7.8 | |
Liberal Democrats | Cyril Robins | 2,472 | 28.3 | −15.9 | |
Labour | Deborah Richardson | 2,457 | 28.2 | +11.2 | |
Majority | 1,327 | 15.2 | |||
Turnout | 8,728 | 75.5 | +33.0 | ||
Conservative gain from Liberal Democrats | Swing | 11.9 | |||
District Summary
Party | Seats | +/- | Votes | % | +/- | |
---|---|---|---|---|---|---|
Conservative | 4 | 2 | 21,761 | 45.1 | +11.8 | |
Labour | 2 | 1 | 19,413 | 40.3 | +6.1 | |
Liberal Democrat | 0 | 1 | 6,957 | 14.4 | −18.0 | |
Socialist Alliance | 0 | 0 | 100 | 0.2 | New | |
Division Results
Party | Candidate | Votes | % | ±% | |
---|---|---|---|---|---|
Conservative | Jillian Reeves * | 3,483 | 48.0 | +12.1 | |
Labour | Brian Wilson | 2,760 | 38.0 | +8.7 | |
Liberal Democrats | Stephen Howe | 1,014 | 14.0 | −20.8 | |
Majority | 723 | 10.0 | +8.9 | ||
Turnout | 7,257 | 73.8 | +38.1 | ||
Conservative hold | Swing | 1.7 | |||
Party | Candidate | Votes | % | ±% | |
---|---|---|---|---|---|
Labour | Dennis Williams | 4,682 | 48.1 | +7.4 | |
Conservative | Christopher Freeman | 3,833 | 39.4 | +5.8 | |
Liberal Democrats | Barry Newman | 1,218 | 12.5 | −13.1 | |
Majority | 849 | 8.7 | +1.6 | ||
Turnout | 9,733 | 66.1 | +30.6 | ||
Labour hold | Swing | 0.8 | |||
Party | Candidate | Votes | % | ±% | |
---|---|---|---|---|---|
Conservative | Raymond Howard * | 4,778 | 51.5 | +7.5 | |
Labour | James David | 3,725 | 40.2 | +1.4 | |
Liberal Democrats | Roger Terry | 670 | 7.2 | −10.0 | |
Socialist Alliance | Robert Chapman | 100 | 1.1 | N/A | |
Majority | 1,053 | 11.4 | +6.2 | ||
Turnout | 9,273 | 67.6 | +31.4 | ||
Conservative hold | Swing | 3.1 | |||
Party | Candidate | Votes | % | ±% | |
---|---|---|---|---|---|
Labour | Alfred Goldsworthy | 3,468 | 43.5 | −2.6 | |
Conservative | John Greenwood | 3,301 | 41.4 | +13.4 | |
Liberal Democrats | Barry King | 1,201 | 15.1 | −10.9 | |
Majority | 167 | 2.1 | −16.0 | ||
Turnout | 7,970 | 73.0 | +36.3 | ||
Labour hold | Swing | 8.0 | |||
Party | Candidate | Votes | % | ±% | |
---|---|---|---|---|---|
Conservative | Ronald Williams | 3,043 | 45.0 | +16.5 | |
Labour | Roy English | 2,070 | 30.6 | +19.6 | |
Liberal Democrats | Michael Baker * | 1,648 | 24.4 | −36.2 | |
Majority | 973 | 14.4 | |||
Turnout | 6,761 | 74.6 | +28.0 | ||
Conservative gain from Liberal Democrats | Swing | 1.6 | |||
Party | Candidate | Votes | % | ±% | |
---|---|---|---|---|---|
Conservative | William Dick * | 3,323 | 45.9 | +18.2 | |
Labour | Guy Shearwood | 2,708 | 37.4 | +0.1 | |
Liberal Democrats | Thomas Pile | 1,206 | 16.7 | −18.3 | |
Majority | 615 | 8.5 | |||
Turnout | 7,237 | 73.8 | +35.4 | ||
Conservative gain from Labour | Swing | 9.1 | |||
District Summary
Party | Seats | +/- | Votes | % | +/- | |
---|---|---|---|---|---|---|
Conservative | 4 | 1 | 35,355 | 39.0 | +1.8 | |
Liberal Democrat | 4 | 1 | 31,366 | 34.6 | −8.6 | |
Labour | 1 | 0 | 20,208 | 22.3 | +3.5 | |
Green | 0 | 0 | 2,320 | 2.6 | +1.8 | |
Independent | 0 | 0 | 1,383 | 1.5 | N/A | |
Division Results
Party | Candidate | Votes | % | ±% | |
---|---|---|---|---|---|
Conservative | Wendy Cole | 2,574 | 33.0 | −5.3 | |
Liberal Democrats | Phillip Evans * | 2,417 | 31.0 | −9.1 | |
Labour | Barry Grainger | 1,387 | 17.8 | −1.1 | |
Independent | Delmas Ashford | 1,261 | 16.2 | N/A | |
Green | Paulene Gaywood | 168 | 2.2 | −0.5 | |
Majority | 157 | 2.0 | |||
Turnout | 7,807 | 75.0 | +33.5 | ||
Conservative gain from Liberal Democrats | Swing | 1.9 | |||
Party | Candidate | Votes | % | ±% | |
---|---|---|---|---|---|
Liberal Democrats | Ian Gale | 3,727 | 39.6 | −9.9 | |
Conservative | John Candler | 3,401 | 36.1 | −2.2 | |
Labour | Michael Bloomsbury | 2,016 | 21.4 | +9.2 | |
Green | Nicholas Scales | 156 | 1.7 | N/A | |
Independent | Stephen Stratton | 122 | 1.3 | N/A | |
Majority | 326 | 3.5 | −7.8 | ||
Turnout | 9,422 | 76.6 | +31.2 | ||
Liberal Democrats hold | Swing | 3.9 | |||
Party | Candidate | Votes | % | ±% | |
---|---|---|---|---|---|
Liberal Democrats | Thomas Smith-Hughes * | 3,429 | 38.2 | −1.3 | |
Conservative | Kathleen Pauley | 2,716 | 30.3 | +2.5 | |
Labour | William Horslen | 2,680 | 29.9 | −2.9 | |
Green | Angela Thomson | 145 | 1.6 | N/A | |
Majority | 713 | 7.9 | +1.2 | ||
Turnout | 8,970 | 76.6 | +25.6 | ||
Liberal Democrats hold | Swing | 1.9 | |||
Party | Candidate | Votes | % | ±% | |
---|---|---|---|---|---|
Liberal Democrats | George Allen * | 4,000 | 45.4 | −11.4 | |
Conservative | Vernon Makin | 2,926 | 33.2 | +2.5 | |
Labour | David Howell | 1,674 | 19.0 | +6.4 | |
Green | Beryl Lankester | 202 | 2.3 | N/A | |
Majority | 1,074 | 12.2 | −13.9 | ||
Turnout | 8,802 | 76.9 | +32.5 | ||
Liberal Democrats hold | Swing | 7.0 | |||
Party | Candidate | Votes | % | ±% | |
---|---|---|---|---|---|
Labour | Neil Spurgeon * | 2,573 | 35.5 | −1.0 | |
Liberal Democrats | John Hunnable | 2,561 | 35.3 | +5.2 | |
Conservative | Duncan Lumley | 2,120 | 29.2 | −4.2 | |
Majority | 12 | 0.2 | −2.9 | ||
Turnout | 7,254 | 71.5 | +21.4 | ||
Labour hold | Swing | 3.1 | |||
Party | Candidate | Votes | % | ±% | |
---|---|---|---|---|---|
Liberal Democrats | Joan Beard * | 3,761 | 47.6 | −15.5 | |
Conservative | Norman Hume | 2,451 | 31.0 | +6.2 | |
Labour | Fredrick Burden | 1,549 | 19.6 | +7.5 | |
Green | Joyce Shiner | 146 | 1.8 | N/A | |
Majority | 1,310 | 16.6 | −21.7 | ||
Turnout | 7,907 | 75.3 | +32.2 | ||
Liberal Democrats hold | Swing | 10.9 | |||
Party | Candidate | Votes | % | ±% | |
---|---|---|---|---|---|
Conservative | Peter Martin * | 6,646 | 43.4 | +2.1 | |
Liberal Democrats | Graham Pooley | 5,256 | 34.3 | −6.7 | |
Labour | Roderick Essery | 2,819 | 18.4 | +4.8 | |
Green | Eleanor Burgess | 591 | 3.9 | −0.2 | |
Majority | 1,390 | 9.1 | +8.8 | ||
Turnout | 15,312 | 74.6 | +41.0 | ||
Conservative hold | Swing | 4.4 | |||
Party | Candidate | Votes | % | ±% | |
---|---|---|---|---|---|
Conservative | Paul White * | 5,258 | 49.3 | +0.5 | |
Labour | Derek Rice | 2,631 | 24.7 | +5.2 | |
Liberal Democrats | James Hutchon | 2,404 | 22.5 | −9.2 | |
Green | Robert Kenney | 368 | 3.5 | N/A | |
Majority | 2,627 | 24.6 | +7.5 | ||
Turnout | 10,661 | 74.9 | +41.3 | ||
Conservative hold | Swing | 2.4 | |||
Party | Candidate | Votes | % | ±% | |
---|---|---|---|---|---|
Conservative | Eileen Mickleborough * | 7,263 | 50.1 | +1.4 | |
Liberal Democrats | Richard Phillips | 3,811 | 26.3 | −12.6 | |
Labour | Carole Sampson | 2,879 | 19.9 | +7.5 | |
Green | Colin Budgey | 544 | 3.8 | N/A | |
Majority | 3,452 | 23.8 | +14.0 | ||
Turnout | 14,497 | 71.9 | +39.8 | ||
Conservative hold | Swing | 7.0 | |||
District Summary
Party | Seats | +/- | Votes | % | +/- | |
---|---|---|---|---|---|---|
Liberal Democrat | 5 | 0 | 27,697 | 33.7 | −10.6 | |
Conservative | 3 | 0 | 28,144 | 34.2 | +2.2 | |
Labour | 1 | 0 | 23,875 | 29.0 | +6.7 | |
Independent | 0 | 0 | 2,147 | 2.6 | N/A | |
Green | 0 | 0 | 367 | 0.4 | −1.0 | |
Division Results
Party | Candidate | Votes | % | ±% | |
---|---|---|---|---|---|
Conservative | Anthony Clover * | 3,916 | 45.8 | −2.3 | |
Liberal Democrats | Andrew Phillips | 2,844 | 33.3 | −6.5 | |
Labour | Julie Young | 1,783 | 20.9 | +8.8 | |
Majority | 1,072 | 12.5 | +4.1 | ||
Turnout | 8,543 | 76.8 | +37.1 | ||
Conservative hold | Swing | +2.1 | |||
Party | Candidate | Votes | % | ±% | |
---|---|---|---|---|---|
Liberal Democrats | Robert Yates * | 3,945 | 39.8 | −14.7 | |
Conservative | Jeremy Lucas | 3,865 | 38.9 | +2.8 | |
Labour | Roy Moules | 2,115 | 21.3 | +11.8 | |
Majority | 80 | 0.8 | −17.5 | ||
Turnout | 9,925 | 74.4 | +29.5 | ||
Liberal Democrats hold | Swing | −8.7 | |||
Party | Candidate | Votes | % | ±% | |
---|---|---|---|---|---|
Liberal Democrats | Patricia Pascoe * | 3,149 | 41.5 | −14.8 | |
Labour | Christopher Pearson * | 2,654 | 35.0 | +7.7 | |
Conservative | Richard Lamberth | 1,783 | 23.5 | +7.1 | |
Majority | 495 | 6.5 | −22.5 | ||
Turnout | 7,586 | 63.9 | +36.8 | ||
Liberal Democrats hold | Swing | −11.3 | |||
Party | Candidate | Votes | % | ±% | |
---|---|---|---|---|---|
Conservative | Christopher Manning-Press * | 5,193 | 44.3 | +0.1 | |
Liberal Democrats | Terence Brady | 3,973 | 33.9 | −6.5 | |
Labour | Ian Yates | 2,556 | 21.8 | +9.2 | |
Majority | 1,220 | 10.4 | +6.6 | ||
Turnout | 11,722 | 74.7 | +39.9 | ||
Conservative hold | Swing | +3.3 | |||
No Green candidate as previous (−2.8).
Party | Candidate | Votes | % | ±% | |
---|---|---|---|---|---|
Liberal Democrats | Margaret Fisher * | 3,806 | 43.4 | −7.8 | |
Labour | Sally Pygott | 3,092 | 35.2 | +1.0 | |
Conservative | Ian McCord | 1,879 | 21.4 | +9.4 | |
Majority | 714 | 8.1 | −8.8 | ||
Turnout | 8,777 | 67.5 | +29.4 | ||
Liberal Democrats hold | Swing | −4.4 | |||
No Green candidate as previous (−2.6).
Party | Candidate | Votes | % | ±% | |
---|---|---|---|---|---|
Liberal Democrats | Kenneth Jones * | 3,141 | 36.4 | −10.4 | |
Conservative | Nigel Chapman | 2,876 | 33.3 | −1.0 | |
Labour | Kim Naish | 2,611 | 30.3 | +11.4 | |
Majority | 265 | 3.1 | −13.8 | ||
Turnout | 8,628 | 66.6 | +28.5 | ||
Liberal Democrats hold | Swing | −4.7 | |||
Party | Candidate | Votes | % | ±% | |
---|---|---|---|---|---|
Liberal Democrats | Edward Crunden * | 4,413 | 42.1 | −11.1 | |
Conservative | Derek Smith | 3,062 | 29.2 | +6.9 | |
Labour | Anthony Constable | 3,005 | 28.7 | +4.2 | |
Majority | 1,351 | 12.9 | −15.8 | ||
Turnout | 10,480 | 69.3 | +32.5 | ||
Liberal Democrats hold | Swing | −9.0 | |||
Party | Candidate | Votes | % | ±% | |
---|---|---|---|---|---|
Conservative | Edmund Peel * | 3,526 | 40.0 | −4.0 | |
Labour | Tania Rogers | 2,783 | 31.5 | +5.6 | |
Independent | Stuart Beckwith | 2,147 | 24.3 | New | |
Green | Cheryl Gerrard | 367 | 4.2 | −0.5 | |
Majority | 743 | 8.5 | −9.5 | ||
Turnout | 8,823 | 73.1 | +43.6 | ||
Conservative hold | Swing | −4.8 | |||
No Liberal Democrat candidate as previous (−25.2).
Party | Candidate | Votes | % | ±% | |
---|---|---|---|---|---|
Labour | Brian Stapleton * | 3,276 | 42.3 | −7.8 | |
Liberal Democrats | John Gray | 2,426 | 31.3 | +14.0 | |
Conservative | Jane Girdlestone | 2,044 | 26.4 | −2.5 | |
Majority | 850 | 11.0 | −10.2 | ||
Turnout | 7,746 | 63.4 | +37.2 | ||
Labour hold | Swing | −10.9 | |||
No Green candidate as previous (−3.7).
District Summary
Party | Seats | +/- | Votes | % | +/- | |
---|---|---|---|---|---|---|
Conservative | 5 | 1 | 29,056 | 43.3 | +2.6 | |
Labour | 1 | 2 | 19,769 | 29.4 | −2.1 | |
Liberal Democrat | 1 | 0 | 13,296 | 19.8 | −7.2 | |
Loughton Residents | 1 | 1 | 5,040 | 7.5 | New | |
Division Results
Party | Candidate | Votes | % | ±% | |
---|---|---|---|---|---|
Liberal Democrats | Stephen Robinson * | 3,342 | 43.1 | −16.7 | |
Conservative | Richard Watts | 2,850 | 36.7 | +11.1 | |
Labour | Alan Larner | 1,571 | 20.2 | +11.1 | |
Majority | 492 | 6.3 | |||
Turnout | 7,763 | 72.9 | |||
Liberal Democrats hold | Swing | 13.9 | |||
Party | Candidate | Votes | % | ±% | |
---|---|---|---|---|---|
Conservative | Michael Tomkins | 3,851 | 57.3 | −1.3 | |
Liberal Democrats | Jack Fuller | 1,556 | 23.2 | −5.6 | |
Labour | Paul Bostock | 1,309 | 19.5 | +6.9 | |
Majority | 2,295 | 34.2 | |||
Turnout | 6,716 | 70.6 | |||
Conservative hold | Swing | 2.2 | |||
Party | Candidate | Votes | % | ±% | |
---|---|---|---|---|---|
Conservative | Dennis Ramshaw * | 4,042 | 45.8 | +2.5 | |
Liberal Democrats | Nicholas Macy | 2,446 | 27.7 | −7.0 | |
Labour | Sidney Miller | 2,340 | 26.5 | +4.5 | |
Majority | 1,596 | 18.1 | |||
Turnout | 8,828 | 72.1 | |||
Conservative hold | Swing | 4.8 | |||
Party | Candidate | Votes | % | ±% | |
---|---|---|---|---|---|
Labour | Gillian Huckle | 2,570 | 37.0 | −18.4 | |
Loughton Residents | Dorothy Paddon | 2,146 | 30.9 | +30.9 | |
Conservative | Stephen Metcalfe | 1,772 | 25.5 | −4.5 | |
Liberal Democrats | Christopher Spence | 452 | 6.5 | −8.1 | |
Majority | 424 | 6.1 | −19.2 | ||
Turnout | 6,940 | 69.7 | +41.6 | ||
Labour hold | Swing | 24.7 | |||
Party | Candidate | Votes | % | ±% | |
---|---|---|---|---|---|
Loughton Residents | Christopher Harper | 2,894 | 36.9 | +36.9 | |
Labour | Stanley Goodwin * | 2,552 | 32.5 | −12.6 | |
Conservative | James Brokenshire | 1,952 | 24.9 | −10.7 | |
Liberal Democrats | Lucille Thompson | 446 | 5.7 | −13.6 | |
Majority | 342 | 4.4 | |||
Turnout | 7,844 | 73.6 | +39.5 | ||
Loughton Residents gain from Labour | Swing | 24.8 | |||
Party | Candidate | Votes | % | ±% | |
---|---|---|---|---|---|
Conservative | Ian Abbey * | 4,645 | 56.6 | −3.9 | |
Labour | Graham Smith | 2,292 | 27.9 | +7.8 | |
Liberal Democrats | Colin Bagnall | 1,265 | 15.4 | −4.0 | |
Majority | 2,443 | 28.7 | |||
Turnout | 8,202 | 74.9 | |||
Conservative hold | Swing | 5.9 | |||
Party | Candidate | Votes | % | ±% | |
---|---|---|---|---|---|
Conservative | Gerard McEwan * | 4,941 | 47.7 | +6.5 | |
Labour | Ronald Barnes | 2,887 | 27.9 | +5.7 | |
Liberal Democrats | Douglas Kelly | 2,520 | 24.4 | −12.1 | |
Majority | 2,054 | 19.8 | |||
Turnout | 10,348 | 75.5 | |||
Conservative hold | Swing | 0.4 | |||
Party | Candidate | Votes | % | ±% | |
---|---|---|---|---|---|
Conservative | Elizabeth Webster | 5,003 | 47.6 | +4.3 | |
Labour | George Farren | 4,248 | 40.4 | −16.3 | |
Liberal Democrats | Patricia Brooks | 1,269 | 12.1 | N/A | |
Majority | 755 | 7.2 | |||
Turnout | 10,520 | 67.7 | |||
Conservative gain from Labour | Swing | 10.3 | |||
District Summary
Party | Seats | +/- | Votes | % | +/- | |
---|---|---|---|---|---|---|
Labour | 5 | 0 | 22,591 | 53.9 | +2.0 | |
Conservative | 0 | 0 | 12,189 | 29.1 | −2.0 | |
Liberal Democrat | 0 | 0 | 6,696 | 16.0 | −1.0 | |
Green | 0 | 0 | 434 | 1.0 | New | |
Division Results
Party | Candidate | Votes | % | ±% | |
---|---|---|---|---|---|
Labour | Mervyn Juliff * | 4,631 | 51.5 | +6.7 | |
Conservative | Ronald Cross | 3,133 | 34.8 | −5.2 | |
Liberal Democrats | Irene Lee | 1,227 | 13.6 | −1.6 | |
Majority | 1,498 | 16.7 | |||
Turnout | 8,991 | 72.8 | |||
Labour hold | Swing | 6.0 | |||
Party | Candidate | Votes | % | ±% | |
---|---|---|---|---|---|
Labour | Paul Stzumpf * | 3,969 | 51.3 | +1.4 | |
Conservative | Trevor McArdle | 2,367 | 30.6 | −6.3 | |
Liberal Democrats | Gareth Higgins | 1,196 | 15.5 | +1.9 | |
Green | Arthur Powell | 203 | 2.3 | N/A | |
Majority | 1,602 | 20.7 | |||
Turnout | 7,749 | 74.7 | |||
Labour hold | Swing | 3.9 | |||
Party | Candidate | Votes | % | ±% | |
---|---|---|---|---|---|
Labour | Anthony Duncan | 4,577 | 48.8 | −3.1 | |
Conservative | Simon Carter | 2,706 | 28.8 | +7.0 | |
Liberal Democrats | Lorna Spenceley | 1,886 | 20.1 | −6.2 | |
Green | Malcolm Powell | 217 | 2.3 | N/A | |
Majority | 1,871 | 19.9 | |||
Turnout | 9,336 | 73.0 | |||
Labour hold | Swing | 5.1 | |||
Party | Candidate | Votes | % | ±% | |
---|---|---|---|---|---|
Labour | Edith Morris * | 4,249 | 59.0 | +5.2 | |
Conservative | David Roberts | 1,833 | 25.5 | −3.7 | |
Liberal Democrats | Stanley Ward | 1,119 | 15.5 | −1.5 | |
Majority | 2,416 | 33.6 | |||
Turnout | 7,201 | 73.6 | |||
Labour hold | Swing | 4.5 | |||
Party | Candidate | Votes | % | ±% | |
---|---|---|---|---|---|
Labour | Paul Belfairs | 5,165 | 60.2 | −0.3 | |
Conservative | Michael Garnett | 2,150 | 25.0 | −0.6 | |
Liberal Democrats | Sheila Herbert | 1,268 | 14.8 | +0.5 | |
Majority | 3,015 | 35.1 | |||
Turnout | 8,583 | 75.3 | |||
Labour hold | Swing | 0.2 | |||
District Summary
Party | Seats | +/- | Votes | % | +/- | |
---|---|---|---|---|---|---|
Conservative | 3 | 0 | 13,532 | 42.5 | −5.1 | |
Labour | 0 | 0 | 7,856 | 24.7 | −1.4 | |
Liberal Democrat | 0 | 0 | 7,531 | 23.6 | +12.9 | |
Independent | 0 | 0 | 1,597 | 5.0 | +1.0 | |
Green | 0 | 0 | 1,351 | 4.2 | −7.4 | |
Division Results
Party | Candidate | Votes | % | ±% | |
---|---|---|---|---|---|
Conservative | Elizabeth Dines | 3,847 | 36.8 | −11.5 | |
Labour | Alison Lamb | 2,716 | 26.0 | −4.6 | |
Liberal Democrats | Graham Jones | 1,992 | 19.0 | N/A | |
Independent | Brian Mead | 1,597 | 15.3 | N/A | |
Green | Juliet Harpur | 309 | 3.0 | −6.0 | |
Majority | 1,131 | 10.8 | |||
Turnout | 10,461 | 75.0 | |||
Conservative hold | Swing | 3.5 | |||
Party | Candidate | Votes | % | ±% | |
---|---|---|---|---|---|
Conservative | Robert Boyce | 5,100 | 46.6 | −0.6 | |
Labour | Terence Quinlan | 3,307 | 30.2 | −1.1 | |
Liberal Democrats | Alan Weeks | 2,004 | 18.3 | N/A | |
Green | Michael Cole | 523 | 4.8 | −16.7 | |
Majority | 983 | 16.4 | |||
Turnout | 10,124 | 71.7 | |||
Conservative hold | Swing | 0.3 | |||
Party | Candidate | Votes | % | ±% | |
---|---|---|---|---|---|
Conservative | Rodney Bass | 4,585 | 43.8 | −3.4 | |
Liberal Democrats | Patricia Mead | 3,535 | 33.8 | +3.4 | |
Labour | Paul Rew | 1,833 | 17.5 | +0.4 | |
Green | Jonathan King | 519 | 5.0 | −0.3 | |
Majority | 1,050 | 10.0 | |||
Turnout | 10,472 | 75.5 | |||
Conservative hold | Swing | 3.4 | |||
District Summary
Party | Seats | +/- | Votes | % | +/- | |
---|---|---|---|---|---|---|
Conservative | 2 | 1 | 18,023 | 40.8 | +8.2 | |
Liberal Democrat | 2 | 1 | 13,756 | 31.1 | −15.2 | |
Labour | 1 | 0 | 12,425 | 28.1 | +7.1 | |
Division Results
Party | Candidate | Votes | % | ±% | |
---|---|---|---|---|---|
Liberal Democrats | Richard Boyd * | 3,728 | 43.7 | −27.2 | |
Conservative | Terry Fawell | 3,176 | 37.2 | +15.2 | |
Labour | David Sutton | 1,625 | 19.1 | +12.0 | |
Majority | 552 | 6.5 | |||
Turnout | 8,529 | 75.1 | |||
Liberal Democrats hold | Swing | 21.2 | |||
Party | Candidate | Votes | % | ±% | |
---|---|---|---|---|---|
Liberal Democrats | James Gordon * | 3,469 | 39.1 | −22.8 | |
Conservative | Peter Webster | 3,364 | 37.9 | +9.3 | |
Labour | David Rossi | 2,046 | 23.0 | +13.5 | |
Majority | 105 | 1.2 | |||
Turnout | 8,879 | 73.0 | |||
Liberal Democrats hold | Swing | 16.1 | |||
Party | Candidate | Votes | % | ±% | |
---|---|---|---|---|---|
Conservative | Tracey Chapman | 3,794 | 39.9 | +6.4 | |
Liberal Democrats | Paula Smith * | 3,265 | 34.3 | −20.7 | |
Labour | David Weir | 2,447 | 25.7 | +14.2 | |
Majority | 529 | 5.6 | |||
Turnout | 9,506 | 72.9 | |||
Conservative gain from Liberal Democrats | Swing | 13.6 | |||
Party | Candidate | Votes | % | ±% | |
---|---|---|---|---|---|
Labour | Graham Fox * | 3,315 | 42.1 | −5.9 | |
Conservative | Roy Pearson | 3,248 | 41.2 | +4.1 | |
Liberal Democrats | Peter Stanton | 1,311 | 16.6 | +1.7 | |
Majority | 67 | 0.9 | |||
Turnout | 7,874 | 71.1 | |||
Labour hold | Swing | 5.0 | |||
Party | Candidate | Votes | % | ±% | |
---|---|---|---|---|---|
Conservative | Elizabeth Hart * | 4,441 | 47.2 | +4.0 | |
Labour | Christopher Morgan | 2,992 | 31.8 | −0.8 | |
Liberal Democrats | Mary Nudd | 1,983 | 21.1 | −3.1 | |
Majority | 1,449 | 15.4 | |||
Turnout | 9,416 | 73.4 | |||
Conservative hold | Swing | 2.4 | |||
District Summary
Party | Seats | +/- | Votes | % | +/- | |
---|---|---|---|---|---|---|
Conservative | 4 | 0 | 26,250 | 35.7 | +1.9 | |
Labour | 3 | 2 | 27,694 | 37.6 | +5.2 | |
Liberal Democrat | 1 | 1 | 18,048 | 24.5 | −2.1 | |
Independent | 0 | 1 | 1,598 | 2.2 | −5.0 | |
Division Results
Party | Candidate | Votes | % | ±% | |
---|---|---|---|---|---|
Conservative | Derek Robinson | 3,115 | 34.6 | +13.3 | |
Labour | Cornelius Olivier | 2,954 | 32.8 | −2.0 | |
Liberal Democrats | Thomas Dale * | 2,941 | 32.6 | −11.3 | |
Majority | 161 | 1.8 | |||
Turnout | 9,010 | 73.2 | |||
Conservative gain from Liberal Democrats | Swing | 7.7 | |||
Party | Candidate | Votes | % | ±% | |
---|---|---|---|---|---|
Conservative | Catherine Jessop * | 3,960 | 44.1 | −2.3 | |
Labour | David Bolton | 3,137 | 34.9 | +6.4 | |
Liberal Democrats | Derek Harper | 1,886 | 21.9 | −4.1 | |
Majority | 823 | 9.2 | |||
Turnout | 8,983 | 69.5 | |||
Conservative hold | Swing | 4.4 | |||
Party | Candidate | Votes | % | ±% | |
---|---|---|---|---|---|
Labour | Clive Baker | 3,606 | 36.8 | +11.0 | |
Liberal Democrats | Michael Bargent * | 3,223 | 32.9 | −16.3 | |
Conservative | Audrey Owens | 2,961 | 30.2 | +5.3 | |
Majority | 383 | 3.9 | |||
Turnout | 9,790 | 67.2 | |||
Labour gain from Liberal Democrats | Swing | 13.7 | |||
Party | Candidate | Votes | % | ±% | |
---|---|---|---|---|---|
Labour | Roy Smith * | 5,008 | 54.8 | −10.2 | |
Conservative | Martyn Hughes | 2,756 | 30.2 | +5.5 | |
Liberal Democrats | Peter Miller | 1,375 | 15.0 | +4.7 | |
Majority | 2,252 | 24.6 | |||
Turnout | 9,139 | 64.2 | |||
Labour hold | Swing | 7.9 | |||
Party | Candidate | Votes | % | ±% | |
---|---|---|---|---|---|
Conservative | David Rex * | 6,042 | 54.5 | −1.0 | |
Labour | Brian Theadom | 3,116 | 28.1 | +3.2 | |
Liberal Democrats | Jeffrey Bray | 1,922 | 17.3 | −2.3 | |
Majority | 2,926 | 26.4 | |||
Turnout | 11,080 | 72.4 | |||
Conservative hold | Swing | 2.1 | |||
Party | Candidate | Votes | % | ±% | |
---|---|---|---|---|---|
Labour | Leslie Double | 4,645 | 53.7 | +35.9 | |
Conservative | Eric Yallop | 2,338 | 27.0 | +9.2 | |
Liberal Democrats | Rosemary Smith | 1,669 | 19.3 | +11.5 | |
Majority | 2,307 | 26.7 | |||
Turnout | 8,652 | 71.1 | |||
Labour gain from Independent | Swing | 13.4 | |||
Party | Candidate | Votes | % | ±% | |
---|---|---|---|---|---|
Conservative | Charles Lumber * | 3,232 | 40.3 | −2.1 | |
Labour | William Mixter | 2,626 | 32.8 | −0.9 | |
Liberal Democrats | Mark De Roy | 2,160 | 26.9 | +3.0 | |
Majority | 606 | 7.6 | |||
Turnout | 8,018 | 73.0 | |||
Conservative hold | Swing | 0.6 | |||
Party | Candidate | Votes | % | ±% | |
---|---|---|---|---|---|
Liberal Democrats | Kevin Hawkins | 2,872 | 32.2 | −1.5 | |
Labour | Gregory Morgan | 2,602 | 29.2 | −0.7 | |
Conservative | Rosalind Tovell | 1,846 | 20.7 | −15.7 | |
Independent | Douglas Pallett | 1,598 | 17.9 | N/A | |
Majority | 270 | 3.0 | |||
Turnout | 8,918 | 74.8 | |||
Liberal Democrats gain from Conservative | Swing | 0.4 | |||
District Summary
Party | Seats | +/- | Votes | % | +/- | |
---|---|---|---|---|---|---|
Conservative | 4 | 3 | 17,507 | 44.8 | +4.0 | |
Liberal Democrat | 0 | 3 | 13,380 | 34.2 | −9.5 | |
Labour | 0 | 0 | 8,211 | 21.0 | +5.4 | |
Division Results
Party | Candidate | Votes | % | ±% | |
---|---|---|---|---|---|
Conservative | David Westcott * | 4,604 | 50.2 | +0.9 | |
Liberal Democrats | Geoffrey Powers | 2,805 | 30.6 | −6.0 | |
Labour | William McCarthy | 1,766 | 19.2 | +5.2 | |
Majority | 1,799 | 19.6 | |||
Turnout | 9,175 | 75.4 | |||
Conservative hold | Swing | 3.5 | |||
Party | Candidate | Votes | % | ±% | |
---|---|---|---|---|---|
Conservative | Robert Chambers | 4,290 | 35.9 | +2.4 | |
Labour | Russell Green | 3,450 | 28.9 | +1.6 | |
Liberal Democrats | John Lefever * | 3,334 | 27.9 | −11.3 | |
Independent | Raymond Tyler | 653 | 5.5 | N/A | |
Green | Gerald Lucy | 212 | 1.8 | N/A | |
Majority | 840 | 7.0 | |||
Turnout | 11,939 | 76.4 | |||
Conservative gain from Liberal Democrats | Swing | 0.4 | |||
Party | Candidate | Votes | % | ±% | |
---|---|---|---|---|---|
Conservative | Richard Wallace | 4,298 | 43.4 | +3.9 | |
Liberal Democrats | Melvin Caton * | 4,020 | 40.6 | −13.0 | |
Labour | Adam Pounds | 1,579 | 16.0 | +9.1 | |
Majority | 278 | 2.8 | |||
Turnout | 9,897 | 75.0 | |||
Conservative gain from Liberal Democrats | Swing | 8.5 | |||
Party | Candidate | Votes | % | ±% | |
---|---|---|---|---|---|
Conservative | John Whitehead | 4,315 | 48.2 | +4.1 | |
Liberal Democrats | David Morgan | 3,221 | 36.0 | −8.8 | |
Labour | Gordon Murray | 1,416 | 15.8 | +4.6 | |
Majority | 1,095 | 12.2 | |||
Turnout | 8,952 | 75.1 | |||
Conservative gain from Liberal Democrats | Swing | 6.5 | |||
Party | Candidate | Votes | % | ±% | |
---|---|---|---|---|---|
Conservative | Daphne White | 4,125 | 56.6 | −4.6 | |
Labour | Heather Searle | 1,915 | 26.3 | +6.5 | |
Liberal Democrats | Derek Holliday | 1,251 | 17.2 | −2.0 | |
Majority | 2,210 | 30.3 | −11.1 | ||
Turnout | 7,291 | 63.8 | +36.7 | ||
Conservative hold | Swing | 5.5 | |||
The 2003 Harlow District Council election took place on 1 May 2003 to elect members of Harlow District Council in Essex, England. One third of the council was up for election and the council stayed under no overall control.
The 2007 Harlow District Council election took place on 3 May 2007 to elect members of Harlow District Council in Essex, England. One third of the council was up for election and the council stayed under no overall control.
The 2008 Thurrock Council election took place on 1 May 2008 to elect members of Thurrock Council in Essex, England. One third of the council was up for election and the council stayed under no overall control.
The 2008 Harlow District Council election took place on 1 May 2008 to elect members of Harlow District Council in Essex, England. One third of the council was up for election and the Conservative party gained overall control of the council from no overall control.
An election to Essex County Council took place on 4 June 2009 as part of the 2009 United Kingdom local elections. The elections had been delayed from 7 May, to coincide with elections to the European Parliament. 75 councillors were elected from various electoral divisions, which returned either one or two county councillors each by first-past-the-post voting for a four-year term of office. The electoral divisions were the same as those used at the previous election in 2005.
The 2002 Basildon District Council election took place on 2 May 2002 to elect members of Basildon District Council in Essex, England. The whole council was up for election with boundary changes since the last election in 2000. The council stayed under no overall control.
The 2011 Basildon Council election took place on 5 May 2011 to elect members of Basildon Borough Council in Essex, England. One third of the council was up for election and the Conservative party stayed in overall control of the council.
Southend-on-Sea City Council is the local authority of the Southend-on-Sea district in Essex, England. It is a unitary authority, having the powers of a non-metropolitan county and district council combined. It is a member of the East of England Local Government Association. It is based at Southend Civic Centre in Southend-on-Sea.
The Norfolk County Council election took place across Norfolk on 2 May 2013, coinciding with local elections for all county councils in England. The results were announced the following day, Friday 3 May 2013. The result brought to an end 12 years of Conservative administration, who finished three seats short of a majority after losing 20 seats, leaving the Council in no overall control (NOC). UKIP and the Labour Party both made gains of 14 and 11 seats respectively. The Liberal Democrats and the Green Party both lost three seats each, whilst an independent won a single seat in North Norfolk.
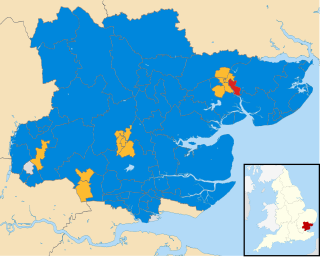
An election to Essex County Council took place on 2 May 2013 as part of the 2013 United Kingdom local elections. 75 councillors were elected from 70 electoral divisions, which returned either one or two county councillors each by first-past-the-post voting for a four-year term of office. The electoral divisions were the same as those used at the previous election in 2009. No elections were held in Thurrock or Southend-on-Sea, which are unitary authorities outside the area covered by the County Council.
An election to Essex County Council took place on 9 May 2005 as part of the 2005 United Kingdom local elections. 75 councillors were elected from various electoral divisions, which returned either one or two county councillors each by first-past-the-post voting for a four-year term of office. The electoral divisions were redrawn for this election.
The 2011 Harlow District Council election took place on 5 May 2011 to elect members of Harlow District Council in Essex, England. One third of the council was up for election and the Conservative Party stayed in overall control of the council.
The 2012 Harlow District Council election took place on 3 May 2012 to elect members of Harlow District Council in Essex, England. One third of the council was up for election and the Labour Party gained overall control of the council from the Conservative Party.
The 2014 Harlow District Council election took place on 22 May 2014 to elect members of Harlow District Council in Essex, England. One third of the council was up for election and the Labour Party stayed in overall control of the council.
Elections to Essex County Council took place on 4 May 2017 as part of the 2017 local elections. All 75 councillors were elected from 70 electoral divisions, which each returned either one or two councillors by first-past-the-post voting for a four-year term of office.
The 2017 Norfolk County Council election took place on 4 May 2017 as part of the 2017 local elections in the United Kingdom.
The 2021 Cambridgeshire County Council election took place on 6 May 2021 as part of the 2021 local elections in the United Kingdom. All 61 councillors were elected from 59 electoral divisions, which returned either one or two county councillors each by first-past-the-post voting for a four-year term of office. The election was held alongside a full election for Cambridge City Council, the Cambridgeshire Police and Crime Commissioner, Mayor of Cambridgeshire and Peterborough and one-third of Peterborough City Council.
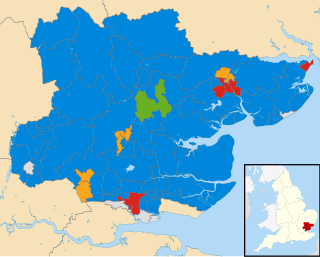
The 2021 Essex County Council election took place on 6 May 2021 as part of the 2021 United Kingdom local elections. All 75 councillors were elected from 70 electoral divisions, with each returning either one or two councillors by first-past-the-post voting for a four-year term of office.
The 2023 Colchester City Council election took place on 4 May 2023 to elect members of Colchester City Council in Essex, England. This was on the same day as other local elections across England. There were 17 of the 51 seats on the council up for election, being the usual third of the council, with one seat available for each ward. This set of seats were last contested at the 2019 election.