1998 Colchester Borough Council election

Last updated

1998 Colchester Borough Council election
Flag of Essex.svg
  1996 7 May 1998 (1998-05-07) 1999  

20 out of 60 seats to Colchester Borough Council
31 seats needed for a majority
Turnout30.7% (Decrease2.svg7.4%)
 First partySecond party
  No image wide.svg No image wide.svg
Party Liberal Democrats Labour
Last election32 seats, 39.9%16 seats, 34.2%
Seats before3116
Seats won85
Seats after2718
Seat changeDecrease2.svg 4Increase2.svg 2
Popular vote11,26610,327
Percentage34.7%31.8%
SwingDecrease2.svg 5.2%Decrease2.svg 2.4%

 Third partyFourth party
  No image wide.svg No image wide.svg
Party Conservative Tiptree Residents
Last election11 seats, 22.5%1 seat, 2.9%
Seats before121
Seats won70
Seats after141
Seat changeIncrease2.svg 2Steady2.svg
Popular vote10,8600
Percentage33.5%0.0%
SwingIncrease2.svg 11.0%Decrease2.svg 2.9%

Colchester UK ward map 1998.svg
Winner of each seat at the 1998 Colchester Borough Council election

Council control before election

Liberal Democrats

Council control after election

No overall control

Elections to Colchester Borough Council took place on 7 May 1998. This was on the same day as other local elections across the United Kingdom.

Contents

At the election, the Liberal Democrats lost control of the council to no overall control, with gains being made by both Labour and the Conservatives. [1] [2]

Summary

1998 Colchester Borough Council election
PartyThis electionFull councilThis election
SeatsNetSeats %OtherTotalTotal %VotesVotes %+/−
  Liberal Democrats 8Decrease2.svg 440.0192745.011,26634.7–5.2
  Labour 5Increase2.svg 225.0131830.010,32731.8–2.4
  Conservative 7Increase2.svg 235.071423.310,86033.5+11.0
  Tiptree Residents 0Steady2.svg0.0111.700.0–2.9

Ward results

Berechurch

Berechurch
PartyCandidateVotes%±%
Labour John Cooke 971 49.0 +6.4
Liberal Democrats W. Sutton*77138.9-11.2
Conservative J. Dinglemans23912.1+4.8
Majority20010.1N/A
Turnout 1,98134.1-9.1
Registered electors 5,823
Labour gain from Liberal Democrats Swing Increase2.svg8.8

Birch Messing Copford

Birch Messing Copford
PartyCandidateVotes%±%
Conservative Peter Crowe* 555 65.8 +15.1
Labour T. Rogers19723.4+1.6
Liberal Democrats D. Paton9110.8-16.7
Majority35842.5+19.3
Turnout 84333.2-14.0
Registered electors 2,544
Conservative hold Swing Increase2.svg6.8

Castle

Castle
PartyCandidateVotes%±%
Liberal Democrats Chris Hall* 907 44.5 -1.1
Labour Chris Pearson58528.7-9.2
Conservative N. Stock51425.2+9.7
Natural Law Loretta Basker321.6+0.7
Majority32215.8+8.1
Turnout 2,03834.0-7.6
Registered electors 6,012
Liberal Democrats hold Swing Increase2.svg4.1

Harbour

Harbour
PartyCandidateVotes%±%
Liberal Democrats Patricia Blandon* 800 43.8 -9.2
Labour David Canning76141.7+2.3
Conservative Sandra Rae26414.5+6.9
Majority392.1-11.5
Turnout 1,82529.1-8.7
Registered electors 6,283
Liberal Democrats hold Swing Decrease2.svg5.8

Lexden

Lexden
PartyCandidateVotes%±%
Conservative P. Walford 1,030 50.4 +2.1
Liberal Democrats Una Jones80239.3-1.9
Labour Stella Creasy 21010.3+1.1
Majority22811.2+4.0
Turnout 2,04246.5-6.0
Registered electors 4,387
Conservative gain from Liberal Democrats Swing Increase2.svg2.0

No Independent Conservative candidate as previous (1.3%).

Mile End

Mile End
PartyCandidateVotes%±%
Liberal Democrats David Goatley* 913 36.2 +6.1
Conservative N. Taylor84433.5+2.9
Labour J. Thomas76630.4-6.6
Majority692.7N/A
Turnout 2,52325.5-7.7
Registered electors 9,916
Liberal Democrats hold Swing Increase2.svg1.6

New Town

New Town
PartyCandidateVotes%±%
Liberal Democrats Bob Russell 997 62.6 -0.1
Labour Jean Quinn42926.9-3.7
Conservative A. Allen16610.4+3.7
Majority56835.7+3.7
Turnout 1,59230.2-6.6
Registered electors 5,273
Liberal Democrats hold Swing Increase2.svg1.8

Prettygate

Prettygate
PartyCandidateVotes%±%
Conservative J. Girdlestone 838 40.7 +15.2
Liberal Democrats David Goss*79538.6-9.7
Labour P. Creasy42620.7-5.4
Majority432.1N/A
Turnout 2,05934.6-6.0
Registered electors 5,951
Conservative gain from Liberal Democrats Swing Increase2.svg12.5

Pyefleet

Pyefleet
PartyCandidateVotes%±%
Conservative Robert Davidson 573 66.7 +20.1
Liberal Democrats R. Watkins14617.0-22.9
Labour John Coombes14016.3+4.4
Majority42749.7+43.0
Turnout 85942.2-10.0
Registered electors 2,026
Conservative hold Swing Increase2.svg21.5

No Green candidate as previous (3.5%).

Shrub End

Shrub End
PartyCandidateVotes%±%
Liberal Democrats W. Sandford* 452 40.4 -9.4
Labour R. Pryor43638.9+0.5
Conservative A. Yalland23220.7+8.9
Majority161.4-10.1
Turnout 1,12021.7-7.0
Registered electors 5,175
Liberal Democrats hold Swing Decrease2.svg5.0

St. Andrew's

St. Andrew's
PartyCandidateVotes%±%
Labour Julie Young 688 58.4 -2.7
Liberal Democrats John Gray37531.8+1.3
Conservative Richard Lamberth1169.8+1.2
Majority31326.5-4.0
Turnout 1,17921.7-1.9
Registered electors 5,432
Labour hold Swing Decrease2.svg2.0

St. Anne's

St. Anne's
PartyCandidateVotes%±%
Labour D. Fairbrother 967 50.1 -0.6
Liberal Democrats K. Hindle74538.6-3.6
Conservative M. Girdlestone22011.4+4.3
Majority22211.5N/A
Turnout 1,93234.1-6.0
Registered electors 5,669
Labour gain from Liberal Democrats Swing Increase2.svg1.5

St. John's

St. John's
PartyCandidateVotes%±%
Liberal Democrats Helen Chuah 813 44.8 -15.0
Conservative D. Smith66136.4+12.1
Labour Dave Harris34018.7+2.8
Majority1528.4-27.1
Turnout 1,81432.1-6.8
Registered electors 5,656
Liberal Democrats hold Swing Decrease2.svg13.6

St. Mary's

St. Mary's
PartyCandidateVotes%±%
Liberal Democrats Nick Cope* 754 41.9 -3.9
Conservative S. Candy68137.8+4.4
Labour P. McGilvray36620.3-0.5
Majority734.1-8.2
Turnout 1,80133.0-10.2
Registered electors 5,453
Liberal Democrats hold Swing Decrease2.svg4.2

Stanway

Stanway
PartyCandidateVotes%±%
Liberal Democrats Gwendoline Illot 752 40.7 -13.2
Conservative Ian McCord65135.3+15.4
Labour Ian Yates44324.0-2.2
Majority1015.5-22.2
Turnout 1,84630.5-3.9
Registered electors 6,074
Liberal Democrats hold Swing Decrease2.svg14.3

Tiptree

Tiptree
PartyCandidateVotes%±%
Labour Mike Dale 913 60.0 +18.0
Conservative Elizabeth Blundell41026.9+17.1
Liberal Democrats A. Seaman19913.1N/A
Majority50333.0N/A
Turnout 1,52224.3-12.5
Registered electors 6,263
Labour hold Swing Increase2.svg0.5

No Tiptree Residents candidate as previous (48.2%).

West Bergholt & Eight Ash Green

West Bergholt & Eight Ash Green
PartyCandidateVotes%±%
Conservative Nigel Chapman 655 49.9 +18.3
Liberal Democrats R. Tyrrell48136.7-11.9
Labour David Jones17613.4-6.4
Majority17413.3N/A
Turnout 1,31233.5-12.5
Registered electors 3,932
Conservative gain from Liberal Democrats Swing Increase2.svg15.1

West Mersea

West Mersea
PartyCandidateVotes%±%
Conservative Margaret Kimberley* 910 60.6 +5.7
Labour Alan Mogridge36124.0+2.0
Liberal Democrats B. Harrison23115.4-7.7
Majority54936.6+4.8
Turnout 1,50225.9-9.6
Registered electors 5,806
Conservative hold Swing Increase2.svg1.9

Winstree

Winstree
PartyCandidateVotes%±%
Conservative M. Fairhead* 674 80.0 +16.7
Labour Luke Dopson9611.4+3.2
Liberal Democrats P. Gentry738.7-18.7
Majority57868.6+31.7
Turnout 84344.2-15.4
Registered electors 1,909
Conservative hold Swing Increase2.svg6.8

Wivenhoe

Wivenhoe
PartyCandidateVotes%±%
Labour R. Richardson* 1,056 57.0 -1.8
Conservative David Adams62733.9+6.1
Liberal Democrats L. Warren1699.1-5.3
Majority42923.2-7.8
Turnout 1,85225.7-8.4
Registered electors 7,223
Labour hold Swing Decrease2.svg4.0

By-elections

Tiptree

Tiptree: 25 June 1998 [3]
PartyCandidateVotes%±%
Labour 624 46.0 -14.0
Tiptree Residents 39929.4N/A
Conservative 33324.6-2.3
Majority29116.6-16.4
Turnout 1,35621.7-2.6
Labour hold Swing N/A

No Liberal Democrat candidate as previous (13.1%).

Related Research Articles

<span class="mw-page-title-main">1998 Solihull Metropolitan Borough Council election</span>

The 1998 Solihull Metropolitan Borough Council election took place on 7 May 1998 to elect members of Solihull Metropolitan Borough Council in the West Midlands, England. One third of the council was up for election and the council stayed under no overall control.

The 1998 Wolverhampton Metropolitan Borough Council election took place on 7 May 1998 to elect members of Wolverhampton Metropolitan Borough Council in the West Midlands, England. One third of the council was up for election and the Labour Party kept overall control of the council.

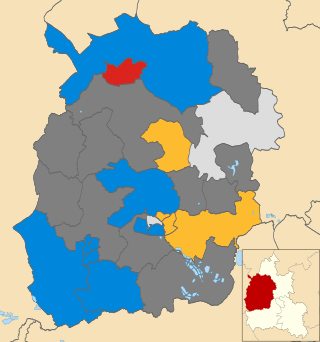
The 1998 Craven District Council election took place on 7 May 1998 to elect members of Craven District Council in North Yorkshire, England. One third of the council was up for election and the Liberal Democrats lost overall control of the council to no overall control.

The 1999 Craven District Council election took place on 6 May 1999 to elect members of Craven District Council in North Yorkshire, England. One third of the council was up for election and the Conservative Party gained overall control of the council from no overall control.

The 2000 Craven District Council election took place on 4 May 2000 to elect members of Craven District Council in North Yorkshire, England. One third of the council was up for election and the Conservative Party stayed in overall control of the council.

<span class="mw-page-title-main">2007 Worthing Borough Council election</span> 2007 UK local government election

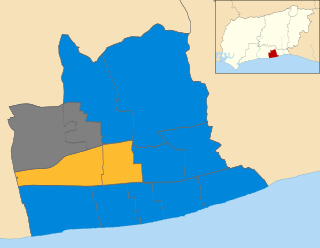
The 2007 Worthing Borough Council election took place on 3 May 2007 to elect members of Worthing Borough Council in West Sussex, England. One third of the council was up for election and the Conservative Party stayed in overall control of the council.

<span class="mw-page-title-main">2006 St Albans City and District Council election</span>

The 2006 St Albans City and District Council election took place on 4 May 2006 to elect members of St Albans District Council in Hertfordshire, England. One third of the council was up for election and the Liberal Democrats gained overall control of the council from no overall control.

The 1998 Wyre Forest District Council election took place on 7 May 1998 to elect members of Wyre Forest District Council in Worcestershire, England. One-third of the council was up for election and the Labour Party stayed in overall control of the council.

The 1998 Worcester City Council election took place on 7 May 1998 to elect members of Worcester City Council in Worcestershire, England. One third of the council was up for election and the Labour Party stayed in overall control of the council.

The 2002 Wokingham District Council election took place on 2 May 2002 to elect members of Wokingham Unitary Council in Berkshire, England. One third of the council was up for election and the Conservative party gained overall control of the council from no overall control.

<span class="mw-page-title-main">2003 Woking Borough Council election</span>

The 2003 Woking Council election took place on 1 May 2003 to elect members of Woking Borough Council in Surrey, England. One third of the council was up for election and the council stayed under no overall control.

The 2010 Weymouth and Portland Borough Council election took place on 6 May 2010 to elect members of Weymouth and Portland Borough Council in Dorset, England. One third of the council was up for election and the council stayed under no overall control.

<span class="mw-page-title-main">2010 Sunderland City Council election</span> Sunderland City Council election

The 2010 Sunderland Council election took place on 6 May 2010 to elect members of Sunderland Metropolitan Borough Council in Tyne and Wear, England. One third of the council was up for election and the Labour Party stayed in overall control of the council. The election took place on the same day as the 2010 General Election.

<span class="mw-page-title-main">2004 Pendle Borough Council election</span> 2004 UK local government election

The 2004 Pendle Borough Council election took place on 10 June 2004 to elect members of Pendle Borough Council in Lancashire, England. One third of the council was up for election and the Liberal Democrats gained overall control of the council from no overall control.

<span class="mw-page-title-main">2006 Basingstoke and Deane Borough Council election</span>

The 2006 Basingstoke and Deane Council election took place on 4 May 2006 to elect members of Basingstoke and Deane Borough Council in Hampshire, England. One third of the council was up for election and the council stayed under no overall control.

<span class="mw-page-title-main">2004 Colchester Borough Council election</span> 2004 UK local government election

The 2004 Colchester Borough Council election took place on 10 June 2004 to elect members of Colchester Borough Council in Essex, England. This was the same day as the other 2004 United Kingdom local elections and as the 2004 European Parliament Elections. One third of the seats were up for election and the council stayed under no overall control.

<span class="mw-page-title-main">2008 Colchester Borough Council election</span> 2008 UK local government election

The 2008 Colchester Borough Council election took place on 1 May 2008 to elect members of Colchester Borough Council in Essex, England. One third of the council was up for election and the Conservative party lost overall control of the council to no overall control.

The 1998 West Oxfordshire District Council election took place on 7 May 1998 to elect members of West Oxfordshire District Council in Oxfordshire, England. One third of the council was up for election and the council stayed under no overall control.

<span class="mw-page-title-main">2003 West Oxfordshire District Council election</span>

The 2003 West Oxfordshire District Council election took place on 1 May 2003 to elect members of West Oxfordshire District Council in Oxfordshire, England. One third of the council was up for election and the Conservative Party stayed in overall control of the council.

<span class="mw-page-title-main">2018 Calderdale Metropolitan Borough Council election</span>

The 2018 Calderdale Metropolitan Borough Council election took place on 3 May 2018 to elect members of Calderdale Metropolitan Borough Council in England. This was on the same day as other local elections. One councillor was elected in each ward for a four-year term so the councillors elected in 2018 last stood for election in 2014. Each ward is represented by three councillors, the election of which is staggered, so only one third of the councillors were elected in this election. Before the election there was no overall control with a minority Labour administration. Following the election Labour, having gained one councillor, was still two councillors away from a majority so it remained no overall control.

References

  1. "Local government election results". The Independent . 8 May 1998.
  2. Timmins, Nicholas (8 May 1998). "Parties suffer mixed fortunes in poll". Financial Times . p. 15.
  3. "Local Authority Byelection Results". Archived from the original on 29 March 2010. Retrieved 25 May 2014.