2011 Braintree District Council election

Last updated


2011 Braintree District Council election
Flag of the United Kingdom.svg
  2007 5 May 2011 (2011-05-05) 2015  

60 seats
31 seats needed for a majority
 First partySecond partyThird party
 
Party Conservative Labour Green
Last election4292
Seats before4292
Seats won4792
Seat changeIncrease2.svg 5Steady2.svgSteady2.svg
Popular vote24,11513,4795,465
Percentage48.927.411.1
SwingIncrease2.svg2.1Increase2.svg2.8Increase2.svg3.9

 Fourth partyFifth partySixth party
 
Party Independent Halstead Residents Liberal Democrats
Last election151
Seats before151
Seats won110
Seat changeSteady2.svgDecrease2.svg 4Decrease2.svg 1
Popular vote1,6361,2721,734
Percentage3.32.63.5
SwingDecrease2.svg0.2Decrease2.svg0.9Decrease2.svg7.9

The 2011 Braintree District Council Elections took place on 5 May 2011 to elect members of Braintree District Council in England. This was on the same day as other local elections. All 60 councillors in 30 wards were up for election.

Contents

Summary

Candidates by party

Labour Party (58/58)


Conservative Party (57/58)


Green Party (22/58)


Liberal Democrats (8/58)


Independent (6/58)


Halstead Residents (5/58)


UKIP (5/58)


BNP (1/58)


Results

Braintree District Council election result 2011 [1] [2]
PartySeatsGainsLossesNet gain/lossSeats %Votes %Votes+/−
  Conservative 4450Increase2.svg 573.352.247,063
  Labour 1011Steady2.svg16.731.328,186
  Green 200Steady2.svg3.37.56,788
  Halstead Residents 104Decrease2.svg 41.72.92,582
  Independent 100Steady2.svg1.72.11,927
  Liberal Democrats 001Decrease2.svg 102.32,082
  UKIP 000Steady2.svg01.61,440
  BNP 000Steady2.svg00.2132

Ward results

Black Notley

Black Notley ward
PartyCandidateVotes%±%
Conservative Margaret Galione 789 55.8
Conservative Tom Cunningham 767 54.2
Labour Juliet Walton23116.3
Labour Andrew Bennett21715.3
UKIP David Hodges20014.1
Independent John Clark16311.5
Liberal Democrats David Toombs14910.5
Green Freddie Gerrard-Abbott1158.1
Turnout 1,41446.0
Conservative hold
Conservative hold

Bocking Blackwater

Bocking Blackwater ward
PartyCandidateVotes%±%
Conservative Stephen Canning 1,243 50.1
Conservative Jean Schmitt 1,059 42.7
Conservative Vanessa Santomauro 999 40.2
Labour Agnes Bishop79632.1
Labour Allan Millam62325.1
Labour Richard Parsons62225.1
UKIP Gordan Helm41816.8
Green Simon Attwood33413.5
Turnout 2,48341.2
Conservative hold
Conservative hold
Conservative hold

Bocking North

Bocking North ward
PartyCandidateVotes%±%
Labour David Mann 709 49.4
Labour Anthony Everard 657 45.8
Conservative Timothy Wilkinson49334.3
Conservative Nigel McCrea37626.2
UKIP Michael Ford21515.0
Green Dawn Holmes1168.1
Turnout 1,43640.7
Labour hold
Labour hold

Bocking South

Bocking South ward
PartyCandidateVotes%±%
Conservative Davis Baugh 701 46.9
Labour Moia Thorogood 689 46.1
Labour Lynn Watson62641.9
Conservative Abiodun Olumbori50834.0
Green John Malam20413.6
Turnout 1,49536.2
Conservative hold
Labour hold

Bradwell, Silver End and Rivenhall

Bradwell, Silver End and Rivenhall ward
PartyCandidateVotes%±%
Green James Abbott 969 53.0
Green Bob Wright 689 37.7
Labour Jeremy White42223.1
Labour Daniel Wright35819.6
Conservative Stephen Nimmons32317.7
UKIP Brain Wood28415.5
Conservative Paul Ryland26614.6
Turnout 1,82849.8
Green hold
Green hold

Braintree Central

Braintree Central ward
PartyCandidateVotes%±%
Conservative John McKee 1,123 47.7
Conservative Marlene Shepherd 957 40.6
Conservative Ronald Ramage 888 37.7
Labour Nigel Gibson80534.2
Labour Celia Burne78933.5
Labour William Edwards73431.2
Green Daniel Shadbolt32713.9
UKIP Roger Lord32313.7
BNP Paul Hooks1325.6
Turnout 2,35538.8
Conservative hold
Conservative hold
Conservative gain from Labour

Braintree East

Braintree East ward
PartyCandidateVotes%±%
Labour Elwyn Bishop 762 42.3
Conservative David Messer 759 42.2
Labour Colette Gibson 756 42.0
Labour Eric Lynch71039.4
Conservative Luke Harrington69138.4
Conservative Rikki Williams66837.1
Green Wendy Partridge29716.5
Turnout 1,80036.0
Labour hold
Conservative hold
Labour hold

Braintree South

Braintree South ward
PartyCandidateVotes%±%
Conservative Stephen Sandbrook 844 42.3
Conservative Lyn Walters 806 40.4
Labour Douglas Rice 780 39.1
Labour Gordon Currie71135.7
Labour Martin Green70935.6
Conservative Syedun Noor60530.3
Independent Andrew Beatty40820.5
Green Timothy Reeve29114.6
Turnout 1,99437.3
Conservative gain from Liberal Democrats
Conservative hold
Labour hold

Bumpstead

Bumpstead ward
PartyCandidateVotes%±%
Conservative Christopher Cadman 713 70.0
Labour Stephen Trumm30630.0
Majority40740.0
Turnout 1,03551.3
Conservative hold Swing

Coggeshall and North Feering

Coggeshall and North Feering ward
PartyCandidateVotes%±%
Conservative Patricia Newton 1,254 63.1
Conservative Susan Wilson 1,114 56.1
Labour Catherine Joyce49324.8
Labour Cherry Cornish47824.1
Green Stephanie Bills28914.6
Turnout 1,98650.0
Conservative hold
Conservative hold

Cressing and Stisted

Cressing and Stisted ward
PartyCandidateVotes%±%
Independent Lynette Flint 600 76.9
Labour Greta Tew18023.1
Majority42053.8
Turnout 80445.0
Independent hold Swing

Gosfield and Greenstead Green

Gosfield and Greenstead Green ward
PartyCandidateVotes%±%
Conservative John O'Reilly-Cicconi 688 64.5
Labour Adrian Gibson25423.8
Green Howard Reed12411.6
Majority43440.7
Turnout 1,07853.2
Conservative hold Swing

Great Notley and Braintree West

Great Notley and Braintree West ward
PartyCandidateVotes%±%
Conservative Graham Butland 1,435 67.0
Conservative Claire Sandbrook 1,418 66.2
Conservative Roger Walters 1,211 56.5
Labour David Green40719.0
Labour Christina Bennett36216.9
Labour Stephen Goodfellow30614.3
Green Howard Bills27412.8
Turnout 2,14241.3
Conservative hold
Conservative hold
Conservative hold

Halstead St. Andrew's

Halstead St. Andrews ward
PartyCandidateVotes%±%
Conservative Jennifer Sutton 895 42.0
Conservative Julia Allen 827 38.8
Conservative Stephen Kirby 762 35.7
Halstead Residents David Hume72033.8
Labour Grahame McCoyd57326.9
Halstead Residents Kenneth Paisley57126.8
Halstead Residents Howard Messenger40519.0
Labour Stuart Gilbert38818.2
Independent Michael Gage31014.5
Labour Stuart Scrivens29713.9
Independent Beryl Gage29113.6
Turnout 2,13240.5
Conservative gain from Halstead Residents

Halstead Trinity

Halstead Trinity ward
PartyCandidateVotes%±%
Halstead Residents Jacqueline Pell 552 41.9
Labour Malcolm Fincken 456 34.6
Labour Stephen Knight37628.5
Conservative David Sharp35226.7
Halstead Residents Linda Hilton33425.4
Conservative Yvonne Warren32524.7
Turnout 1,31737.4
Halstead Residents hold
Labour gain from Halstead Residents

Hatfield Peverel

Hatfield Peverel ward
PartyCandidateVotes%±%
Conservative David Beeb 1,062 65.3
Conservative Derrick Louis 981 60.3
Labour Lauren Whitnell35721,9
Labour Katherine Watts28817.7
Green Cheryl Gerrard22013.5
Turnout 1,62747.2
Conservative hold
Conservative hold

Hedingham and Maplestead

Hedingham and Mapstead ward
PartyCandidateVotes%±%
Conservative Joanne Beavis 1,345 58.9
Conservative Hylton Johnson 1,197 52.4
Conservative Wendy Scattergood 1,044 45.7
Liberal Democrats Stephen Bolter66128.9
Green Susan Ransome38716.9
Labour Noel Owen38616.9
Labour John Kotz35015.3
Labour Betty Kotz33914.8
Turnout 2,28544.3
Conservative hold
Conservative hold
Conservative hold

Kelvedon

Kelvedon ward
PartyCandidateVotes%±%
Conservative Thomas Foster 1,202 60.4
Conservative Robert Mitchell 1,084 54.4
Labour Ian Marshall53727.0
Labour Anthony Lewis50825.5
Green Robert McCracken28014.1
Turnout 1,99150.4
Conservative hold
Conservative hold

Panfield

Panfield ward
PartyCandidateVotes%±%
Conservative Peter Tattersley 522 64.8
Labour David Rice18322.7
Green Lynne Maynard10112.5
Majority33942.1
Turnout 81647.8
Conservative hold Swing

Rayne

Rayne ward
PartyCandidateVotes%±%
Conservative Michael Banthorpe 652 81.2
Labour Cornelius Coughlan15118.8
Majority50162.4
Turnout 81746.8
Conservative hold Swing

Stour Valley North

Stour Valley North ward
PartyCandidateVotes%±%
Conservative Julian Swift 686 76.0
Labour Robert Green21724.0
Majority46952.0
Turnout 91551.1
Conservative hold Swing

Stour Valley South

Stour Valley South ward
PartyCandidateVotes%±%
Conservative Anthony Shelton 711 78.6
Labour Frederick Hearn19421.4
Majority51757.2
Turnout 93653.7
Conservative hold Swing

Three Fields

Three Fields ward
PartyCandidateVotes%±%
Conservative John Finbow 1,125 71.1
Conservative David Reid 1,029 65.0
Labour Maureen Bennett34321.7
Labour Cynthia Woodhouse29818.8
Turnout 1,58250.3
Conservative hold
Conservative hold

Upper Colne

Upper Colne ward
PartyCandidateVotes%±%
Conservative Robert Bolton 599 73.3
Labour Peter Long21826.7
Majority38146.6
Turnout 83448.6
Conservative hold Swing

Witham Chipping Hill and Central

Witham Chipping Hill and Central ward
PartyCandidateVotes%±%
Conservative Sandra Howell 662 44.2
Conservative Michael Lager 652 43.5
Labour Francis MacDonald39626.4
Labour Eileen Davidson38225.5
Liberal Democrats Barry Fleet29619.7
Liberal Democrats Helen Waring18112.1
Green Nelson Brunton17611.7
Turnout 1,49941.7
Conservative hold
Conservative hold

Witham North

Witham North ward
PartyCandidateVotes%±%
Labour Robert Evans 613 46.7
Labour Philip Barlow 603 45.9
Conservative Christopher Thompson42232.1
Conservative John Cunningham36327.6
Green Robert Nicholls24618.7
Liberal Democrats Clifford Livermore15812.0
Turnout 1,31438.0
Labour hold
Labour hold

Witham South

Witham South ward
PartyCandidateVotes%±%
Conservative Janet Money 997 46.1
Conservative Corrine Thompson 937 43.3
Conservative John Elliott 930 43.0
Labour Paul Heath71933.2
Labour Olatunde Biyi71332.9
Labour Alan O'Shea67231.0
Green Agnes Wells35216.3
Green Stephen Hicks29013.4
Liberal Democrats Bernard Dearlove23911.0
Turnout 2,16534.3
Conservative hold
Conservative hold
Conservative hold

Witham West

Witham West ward
PartyCandidateVotes%±%
Conservative William Rose 841 41.4
Conservative Patrick Horner 824 40.6
Conservative Cheryl Louis 736 36.2
Labour Lucy Barlow69734.3
Labour Anthony Bennett64932.0
Labour Kathleen Tearle64031.5
Green Andrew Bunn36217.8
Green Philip Hughes34517.0
Liberal Democrats James Fleet23111.4
Liberal Democrats Pamela Hooper1678.2
Turnout 2,03140.4
Conservative hold
Conservative hold
Conservative hold

Yeldham

Yeldham ward
PartyCandidateVotes%±%
Conservative Iona Parker 426 58.2
Independent Trevor Revell15521.2
Labour Richard Green15120.6
Majority27137.0
Turnout 73544.9
Conservative hold Swing

By-elections

Braintree East (March 2012)

A by-election was called due to the resignation of Cllr David Messer (Conservative).

Braintree East: 15 March 2012
PartyCandidateVotes%±%
Labour Eric Lynch 554 49.0 +7.1
Conservative Stephen Nimmons33829.9-11.8
UKIP Phil Palij13111.6N/A
Green Wendy Partridge766.7-9.6
Independent Paul Lemon322.8N/A
Majority21619.1N/A
Turnout 1,131
Labour gain from Conservative Swing Increase2.svg9.5

Braintree South

A by-election was called due to the resignation of Cllr Stephen Sandbrook (Conservative).

Braintree South: 15 March 2012
PartyCandidateVotes%±%
Labour Martin Green 596 50.2 +16.6
Conservative Abi Olumbori47640.1+3.8
Green Timothy Reeve1169.8-2.7
Majority12010.1N/A
Turnout 1,188
Labour gain from Conservative Swing Increase2.svg6.4

Great Notley and Braintree West

A by-election was called due to the resignation of Cllr Claire Sandbrook (Conservative).

Great Notley and Braintree West: 15 March 2012
PartyCandidateVotes%±%
Conservative Frankie Ricci 532 54.3 -13.5
Labour Juliet Walton23223.7+4.5
UKIP Gordon Helm15515.8N/A
Green Lynne Maynard616.2-6.7
Majority30030.6N/A
Turnout 980
Conservative hold Swing Decrease2.svg9.0

Braintree East (July 2013)

A by-election was called due to the death of Cllr Eric Lynch (Labour). Percentage changes compared to the 2012 by-election.

Braintree East: 25 July 2013
PartyCandidateVotes%±%
Labour Celia Burne 461 46.6 -2.4
Conservative Jennifer Smith26727.0-2.9
UKIP Philip Palij19419.6+8.0
Green John Malam676.8+0.1
Majority19419.6+0.5
Turnout 989
Labour hold Swing Increase2.svg0.3

Related Research Articles

<span class="mw-page-title-main">Lambeth London Borough Council elections</span>

Lambeth London Borough Council is elected every four years.

<span class="mw-page-title-main">Brent London Borough Council elections</span> Local elections in London

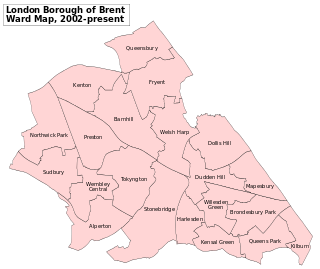
Brent London Borough Council in London, England is elected every four years. Since the last boundary changes in 2002, 63 councillors have been elected from 21 wards.

Dartford Borough Council is the local authority for the Borough of Dartford in Kent, England. The council is elected every four years.

<span class="mw-page-title-main">2006 Barnet London Borough Council election</span> 2006 local election in England

The 2006 Barnet Council election took place on 4 May 2006 to elect members of Barnet London Borough Council in London, England. The whole council was up for election and the Conservative party stayed in overall control of the council.

<span class="mw-page-title-main">Redbridge London Borough Council elections</span>

Redbridge London Borough Council in London, England is elected every four years.

<span class="mw-page-title-main">Enfield London Borough Council elections</span> UK local elections

Enfield London Borough Council in London, England is elected every four years. Since the last boundary changes in 2002, 63 councillors have been elected from 21 wards.

<span class="mw-page-title-main">Harrow London Borough Council elections</span>

Harrow London Borough Council in London, England is elected every four years. Since the last boundary changes in 2022, 55 councillors are elected from 22 wards.

<span class="mw-page-title-main">Lewisham London Borough Council elections</span>

Lewisham London Borough Council is the local authority for the London Borough of Lewisham, in London, United Kingdom. Elections are held every four years using a plurality bloc vote electoral system for the councillors and the supplementary vote electoral system for the elected mayor.

The Politics of Aberdeen, Scotland have changed significantly in recent years. In 1996, under the Local Government etc. (Scotland) Act 1994, Grampian Regional Council and Aberdeen District Council were dissolved, creating the new unitary Aberdeen City Council to represent the city's council area.

<span class="mw-page-title-main">Richmond upon Thames London Borough Council elections</span> Class of UK elections

Richmond upon Thames London Borough Council elections are held every four years for all 54 councillor seats in the 18 wards that make up the Borough Council. By-elections are held in individual wards when vacancies arise outside the four-year cycle.

<span class="mw-page-title-main">Waltham Forest London Borough Council elections</span>

Waltham Forest London Borough Council in London is elected every four years. Since the last boundary changes in 2002, 60 councillors have been elected from 20 wards, with 3 councillors per ward.

<span class="mw-page-title-main">Hillingdon London Borough Council elections</span> Class of UK elections

The members of the Hillingdon London Borough Council in London, England are elected every four years. Since the 2022 boundary changes, the council is composed of 53 councillors.

<span class="mw-page-title-main">2009 Essex County Council election</span>

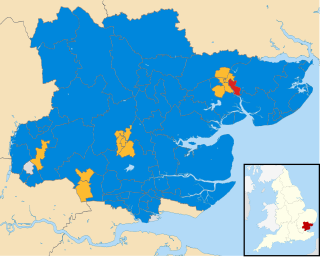
An election to Essex County Council took place on 4 June 2009 as part of the 2009 United Kingdom local elections. The elections had been delayed from 7 May, to coincide with elections to the European Parliament. 75 councillors were elected from various electoral divisions, which returned either one or two county councillors each by first-past-the-post voting for a four-year term of office. The electoral divisions were the same as those used at the previous election in 2005.

<span class="mw-page-title-main">Merton London Borough Council elections</span> Political party in the United Kingdom

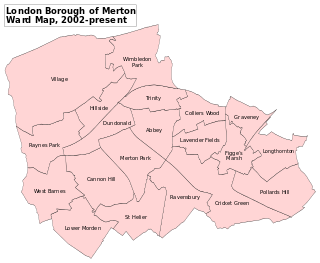
Merton London Borough Council in London, England is elected every four years; it has administrative control over the London Borough of Merton.

Cardiff Council elections take place for the whole council every five years, to Cardiff Council in south Wales. It came into being as a unitary authority on 1 April 1996, after the passing of the Local Government (Wales) Act 1994. In 2014 the National Assembly for Wales deferred all local elections in Wales to 2017. The council is composed of 75 councillors.

<span class="mw-page-title-main">Islington London Borough Council elections</span> UK local government elections

Islington London Borough Council in London, England is elected every four years. Since the last boundary changes in 2002, 48 councillors have been elected from 16 wards.

<span class="mw-page-title-main">Greenwich London Borough Council elections</span>

Greenwich London Borough Council is the local authority for the Royal Borough of Greenwich in London, England. The council is elected every four years. Since the last boundary changes in 2022, 55 councillors have been elected from 23 wards.

Wandsworth London Borough Council, England, is elected every four years. From 2002 to 2018, 60 councillors were elected from 20 wards. Following ward boundary changes, in 2022 58 councillors were elected in 22 wards returning either 2 or 3 councillors each.

<span class="mw-page-title-main">2008 City of Bradford Metropolitan District Council election</span>

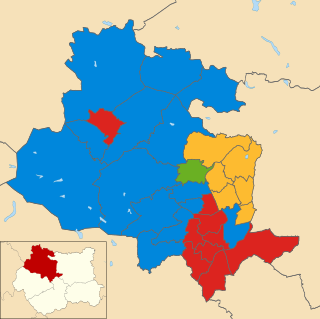
The City of Bradford Metropolitan District Council election took place on Thursday 1 May 2008.

<span class="mw-page-title-main">2018 Hillingdon London Borough Council election</span> 2018 local election in England

The 2018 Hillingdon Council election took place on 3 May 2018 to elect members of Hillingdon Council in England. This was on the same day as other local elections. The Conservative Party retained control with an increased majority.

References

  1. "Braintree District Council Election Results 1973-2011" (PDF). The Elections Centre. Retrieved 8 February 2024.
  2. "Local Election Results 2011 - Braintree". Local Elections Archive Project. Retrieved 8 February 2024.