2011 Horsham District Council election

Last updated

The 2011 Horsham District Council election took place on 5 May 2011 to elect members of Horsham District Council in England. [1] It was held on the same day as other local elections and the 2011 United Kingdom Alternative Vote referendum. The Conservatives increased their majority on the council to 12, winning a total of 34 seats.

Contents

2011 Horsham District Council election
Flag of England.svg
  2007 5 May 2011 2015  

All 44 seats to Horsham District Council
23 seats needed for a majority
 First partySecond partyThird party
 
Party Conservative Liberal Democrats Independent
Seats won3482
Seat changeIncrease2.svg 3Decrease2.svg 3Steady2.svg

Council composition

Prior to the election, the composition of the council was:

31112
ConLDemInd

After the election, the composition of the council was:

3482
ConLDemInd

Results summary

2011 Horsham District Council election
PartySeatsGainsLossesNet gain/lossSeats %Votes %Votes+/−
  Conservative 3441Increase2.svg 377.356.451,157+2.1
  Liberal Democrats 814Decrease2.svg 318.224.422,114-12.4
  Independent 200Steady2.svg4.53.73,376+0.5
  Labour 0Steady2.svg0.07.26,533+5.6
  UKIP 0--Steady2.svg0.06.86,190+3.9
  Green 0Steady2.svg0.01.11,022+0.8
  Peace 0Steady2.svg0.00.32660.0

Ward results

Billingshurst and Shipley

Billingshurst and Shipley
PartyCandidateVotes%±%
Conservative Adam Breacher 1,467 42.3 -5.6
Conservative Gordon Lindsay 1,414
Conservative Kathleen Rowbottom 1,360
UKIP Douglas Rands60117.3-0.2
Liberal Democrats Gillian Knight56816.4-18.1
UKIP David Duke561
UKIP Graham Harper441
Labour John Box42112.1+12.1
Liberal Democrats Erica Lee414
Independent Roy Margetts40911.8+11.8
Liberal Democrats Philip Seth385
Labour Keith Maslin351
Turnout 44.5
Conservative hold Swing

Bramber, Upper Beeding and Woodmancote

Bramber, Upper Beeding and Woodmancote
PartyCandidateVotes%±%
Conservative James Goddard 974 44.4 -4.1
Conservative David Coldwell 938
Liberal Democrats Andrew Purches77035.1-10.0
Liberal Democrats Jessica Sproxton-Miller518
Labour Adrian Norridge23610.8+4.4
UKIP Stuart Bower2129.7+9.7
Turnout 49.1
Conservative hold Swing

Broadbridge Heath

Broadbridge Heath
PartyCandidateVotes%±%
Liberal Democrats Malcolm Curnock 391 37.9 -26.0
Conservative Linda Pettitt38537.3+1.2
Labour Raymond Chapman16415.9+15.9
UKIP Valerie Gray918.8+8.8
Turnout 44.4
Liberal Democrats hold Swing

Chanctonbury

Chanctonbury
PartyCandidateVotes%±%
Conservative Philip Circus 1,851 57.1 -7.6
Conservative Roger Arthur 1,789
Conservative Eric Jenkins 1,786
Liberal Democrats Richard Martin55017.0-4.9
Labour Susan Shord42713.2+13.2
UKIP Jean Westrip41412.8-0.6
Turnout 49.0
Conservative hold Swing

Chantry

Chantry
PartyCandidateVotes%±%
Conservative Christopher Mason 2,507 54.5 -4.3
Conservative Raymond Dawe 2,495
Conservative James Sanson 2,265
Liberal Democrats Hugh Addy83618.2-6.1
Labour Margaret Cornwell66114.4+14.4
UKIP Peter Westrip59212.9-4.0
Turnout 49.9
Conservative hold Swing

Cowfold, Shermanbury and West Grinstead

Cowfold, Shermanbury and West Grinstead
PartyCandidateVotes%±%
Conservative Jonathan Chowen 1,242 66.4 -7.8
Conservative Andrew Dunlop 1,127
Liberal Democrats Jonathan Dittmer62833.6+7.8
Turnout 39.7
Conservative hold Swing

Denne

Denne
PartyCandidateVotes%±%
Conservative Lawrence Deakins 854 38.9 +3.7
Liberal Democrats David Sheldon 816 37.1 -11.4
Conservative Ronald Vimpany630
Liberal Democrats Alessandro Mancini588
Labour Jane Field30914.1+8.2
UKIP Martin Bridewell2189.9+9.9
Turnout 45.1
Conservative gain from Liberal Democrats Swing
Liberal Democrats hold Swing

Forest

Forest
PartyCandidateVotes%±%
Liberal Democrats Godfrey Newman 976 53.0 +5.3
Conservative David Scozzafava66736.2-12.4
Labour Josephine Battersby1216.6+2.9
UKIP Harry Aldridge784.2+4.2
Turnout 62.3
Liberal Democrats gain from Conservative Swing

Henfield

Henfield
PartyCandidateVotes%±%
Independent Sheila Matthews 1,133 35.2 -6.7
Conservative Brian O'Connell 986 30.8 -6.2
Independent Matthew Brookbank42813.4+13.4
Liberal Democrats Andrew Sharp39812.4-8.7
Labour Mark Boorsma2628.2+8.2
Turnout 51.5
Independent hold Swing
Conservative hold Swing

Holbrook East

Holbrook East
PartyCandidateVotes%±%
Conservative Andrew Baldwin 1,295 60.3 +4.0
Conservative James Rae 1,050
Liberal Democrats Warwick Hellawell42819.9-17.3
Liberal Democrats Gregory Collins417
Labour Linda Hugl28913.4+13.4
UKIP Micheal Smith1376.4+6.4
Turnout 48.8
Conservative hold Swing

Holbrook West

Holbrook West
PartyCandidateVotes%±%
Conservative Peter Burgess 1,174 54.1 +7.2
Conservative Christian Mitchell 1,151
Liberal Democrats Valerie Newman54725.2-7.6
Liberal Democrats Belinda Walters541
Labour Sheila Chapman28313.0+9.4
UKIP Sally Wilkins1687.7+7.7
Turnout 48.3
Conservative hold Swing

Peter Burgess stood as an Independent in Holbrook West in 2007, the year when this seat was last contested.

Horsham Park

Horsham Park
PartyCandidateVotes%±%
Liberal Democrats David Holmes 876 32.6 -16.2
Conservative Josh Murphy 798 29.7 +0.9
Liberal Democrats Frances Haigh 785
Conservative Lauren Proctor759
Conservative Connor Relleen712
Liberal Democrats Roberto Nacci564
Labour Carol Hayton50718.9+6.2
Labour Jonathan Austin499
Labour David Hide437
Peace Jim Duggan2669.9+0.2
UKIP Nigel Smith2408.9+8.9
Turnout 43.0
Liberal Democrats hold Swing
Conservative gain from Liberal Democrats Swing
Liberal Democrats hold Swing

Itchingfield, Slinfold and Warnham

Itchingfield, Slinfold and Warnham
PartyCandidateVotes%±%
Conservative Robert Nye 1,303 51.8 -0.5
Conservative Patricia Youtan 898
Liberal Democrats Ian Shepherd56922.6-14.5
Green Justin Pickard36614.6+14.6
UKIP George Tribe27611.0+0.4
Turnout 49.1
Conservative hold Swing

Nuthurst

Nuthurst
PartyCandidateVotes%±%
Conservative Duncan England 862 68.7 -4.7
Liberal Democrats Peter Mullarkey25820.6+2.3
UKIP Adam Bufton13510.8+10.8
Turnout 55.6
Conservative hold Swing

Pulborough and Coldwatham

Pulborough and Coldwatham
PartyCandidateVotes%±%
Conservative Brian Donnelly 1,329 52.6 -24.1
Conservative Roger Paterson 1,253
Green Peter Alison36814.6+14.6
UKIP Peter Lee32312.8+12.8
Liberal Democrats Susan Stokes26910.6-12.7
UKIP John Wallace241
Labour Jill Allen2409.5+9.5
Turnout 44.7
Conservative hold Swing

Roffey North

Roffey North
PartyCandidateVotes%±%
Conservative Helena Croft 999 39.4 +4.0
Liberal Democrats David Skipp 932 36.8 -16.1
Liberal Democrats Nicholas Butler748
Conservative Mikko Figura694
Labour Nicholas Field32412.8+12.8
UKIP Micheal Rowlands27811.0+11.0
Turnout 47.3
Conservative gain from Liberal Democrats Swing
Liberal Democrats hold Swing

Roffey South

Roffey South
PartyCandidateVotes%±%
Conservative Roy Cornell 934 45.0 -0.4
Conservative Simon Torn 914
Liberal Democrats Phyllis Rutherford62530.1-13.8
Liberal Democrats Roger Wilton586
Labour Raymond Battersby29714.3+3.6
UKIP David Buck21810.5+10.5
Turnout 41.8
Conservative hold Swing
Conservative gain from Liberal Democrats Swing

Rudgwick

Rudgwick
PartyCandidateVotes%±%
Conservative John Bailey 662 60.7 -16.0
Liberal Democrats Laurence Price22921.0+1.6
UKIP Albert Stevens20018.3+18.3
Turnout 55.3
Conservative hold Swing

Rusper and Colgate

Rusper and Colgate
PartyCandidateVotes%±%
Conservative Elizabeth Kitchen 713 73.7 -1.8
Liberal Democrats Anthony Millson14615.1+1.2
UKIP Stuart Aldridge10911.3+11.3
Turnout 48.3
Conservative hold Swing

Southwater

Southwater
PartyCandidateVotes%±%
Conservative Ian Howard 1,857 54.2 -0.4
Conservative Claire Vickers 1,806
Conservative John Chidlow 1,721
Liberal Democrats Peter Stainton1,07331.3-14.1
Liberal Democrats Kirstin Turner834
Liberal Democrats Alan Belmore666
UKIP Bryan Bufton49514.5+14.5
Turnout 44.7
Conservative hold Swing

Steyning

Steyning
PartyCandidateVotes%±%
Independent George Cockman 1,406 39.1 +7.1
Conservative Susan Rogers 1,059 29.4 -3.9
Conservative David Barling961
Liberal Democrats Nicholas Hopkinson85723.8-5.8
Labour Antony Bignell2747.6+2.6
Turnout 43.9
Independent hold Swing
Conservative hold Swing

Trafalgar

Trafalgar
PartyCandidateVotes%±%
Liberal Democrats Christine Costin 1,210 45.7 -7.8
Liberal Democrats Leonard Crosbie 1,116
Conservative Keith Bridgeman89533.8+6.1
Labour Alexandra Davis2399.0+3.2
Labour Jacqueline Little192
UKIP Claire Bridewell1626.1+0.8
Green Nicholas Fitter1445.4-2.1
Green Stacey Frier144
Turnout 53.2
Liberal Democrats hold Swing

Related Research Articles

<span class="mw-page-title-main">Mid Sussex District</span> Non-metropolitan district in England

Mid Sussex is a local government district in West Sussex, England. The largest town is Haywards Heath, where the council is based. The district also contains the towns of Burgess Hill and East Grinstead plus surrounding rural areas, including many villages. The district includes part of the South Downs National Park and part of the designated Area of Outstanding Natural Beauty of High Weald, including sections of Ashdown Forest. The district contains most headwaters of the River Ouse. Its largest body of water is Ardingly reservoir which is used by watersports clubs. At the 2021 census the district had a population of 152,949.

<span class="mw-page-title-main">Chichester District</span> Local government district in West Sussex, England

Chichester is a local government district in West Sussex, England. It is named after the city of Chichester, which is its largest settlement and where the council is based. The district includes the towns of Midhurst, Petworth and Selsey and surrounding rural areas, including many villages. The district includes part of the South Downs National Park, and Chichester Harbour is a designated Area of Outstanding Natural Beauty. At the 2021 census the district had a population of 124,531.

<span class="mw-page-title-main">Horsham District</span> Local government district in West Sussex, England

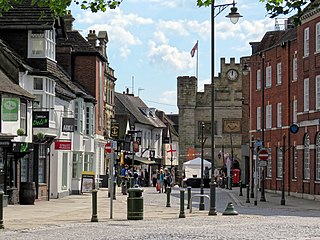
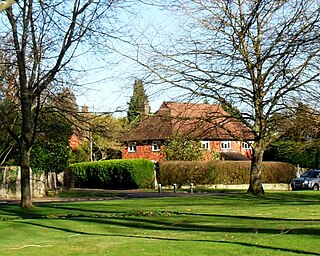
Horsham is a local government district in West Sussex, England. It is named after the town of Horsham, which is its largest settlement and where the council is based. The district also includes the surrounding rural area and contains many villages, the largest of which are Southwater and Billingshurst. The district includes part of the South Downs National Park and part of the designated Area of Outstanding Natural Beauty of High Weald. At the 2021 census the district had a population of 147,487.

One third of Crawley Borough Council in West Sussex, England is elected each year, followed by one year without election. Since the last boundary changes in 2019, 36 councillors have been elected from 13 wards.

Mid Sussex District Council is elected every four years.

<span class="mw-page-title-main">Horsham District Council elections</span>

Horsham District Council in West Sussex, England, is elected every four years.

The 2015 Horsham District Council election took place on 7 May 2015 to elect members of Horsham District Council in England. It was held on the same day as other local elections and the 2015 United Kingdom general election. The Conservatives secured a majority of 17, which was the largest majority any party has ever achieved at a Horsham District Council election.

<span class="mw-page-title-main">2017 West Sussex County Council election</span>

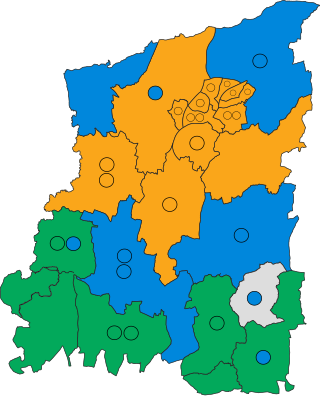
The 2017 West Sussex County Council election took place as part of the 2017 local elections in the UK. All councillors were elected for single-member electoral divisions for a four-year term. The voting system used was first-past-the-post.

<span class="mw-page-title-main">2019 Horsham District Council election</span> 2019 UK local government election

The 2019 Horsham District Council election took place on 2 May 2019 to elect members of Horsham District Council in England. It was held on the same day as other local elections. Every seat was contested and the Conservatives retained control of the council with a majority of 8.

The 1973 Horsham District Council election was the first ever for the council and took place on 7 June 1973 to elect members of Horsham District Council in England. It was held on the same day as other local elections. Independent councillors secured a majority of two with 23 seats, the Conservatives won 17 and the Liberal Party won 2. Labour also took part in the elections, fielding candidates in Horsham South & Horsham North only. The Liberal Party were successful in Broadbridge Heath and they were able to secure a seat in Storrington. The Conservative Party achieved good results in some rural areas but they were able to win the vast amount of their seats in the town. Independent councillors won a majority of seats in the villages in the district, sometimes unopposed, some later stood as a Conservative candidate three years later in the next set of elections for the Council.

The 1976 Horsham District Council election took place on 6 May 1976 to elect members of Horsham District Council in England. It was held on the same day as other local elections. The Conservatives won a majority of 9 on the council, gaining from Independent. In a number of seats, candidates who stood as an Independent in 1973, when these seats were last contested, stood again as a Conservative Party candidate. Residents' association won their first seat to the council, winning a seat in Henfield. The Liberal Party lost both of their seats from the previous election three years ago.

The 1979 Horsham District Council election took place on 3 May 1979 to elect members of Horsham District Council in England. It was held on the same day as other local elections and the 1979 United Kingdom general election. The Conservatives retained control of the council with 33 seats, a majority of 12. The Independents had eight councillors elected, a decrease of three from last time. The Liberals gained a seat in Bramber & Upper Beeding and the Residents' association held on to their Henfield seat.

The 1983 Horsham District Council election took place on 5 May 1983 to elect members of Horsham District Council in England. It was held on the same day as other local elections. The Conservatives retained control of the council with 35 seats, a majority of 14, Independent candidates won 5 seats and the SDP–Liberal Alliance won 2.

The 1987 Horsham District Council election took place on 7 May 1987 to elect members of Horsham District Council in England. It was held on the same day as other local elections. The Conservatives retained control of the council with 33 seats, a majority of 12. The SDP–Liberal Alliance won 6 seats and Independents won 4.

The 1991 Horsham District Council election took place on 2 May 1991 to elect members of Horsham District Council in England. It was held on the same day as other local elections. The Conservatives retained control of the council with a reduced majority. The Liberal Democrats gained a net total of 7 and Independent candidates had 2 councillors elected.

The 1995 Horsham District Council election took place on 4 May 1995 to elect members of Horsham District Council in England. It was held on the same day as other local elections. The Liberal Democrats gained control of the council from the Conservatives with a 3 seat majority. This was the first time ever the Conservative Party lost control of Horsham District Council since they first won overall control in 1976.

The 1999 Horsham District Council election took place on 6 May 1999 to elect members of Horsham District Council in England. It was held on the same day as other local elections. The Conservatives won a majority of 3 on the council, gaining from the Liberal Democrats.

The 2003 Horsham District Council election took place on 1 May 2003 to elect members of Horsham District Council in England. It was held on the same day as other local elections. The result left the council with no overall control with the Conservatives one seat short of a majority.

The 2007 Horsham District Council election took place on 3 May 2007 to elect members of Horsham District Council in England. It was held on the same day as other local elections. The Conservatives won a majority on the council, gaining from no overall control.

<span class="mw-page-title-main">2023 Horsham District Council election</span> English council election

The 2023 Horsham District Council election took place on 4 May 2023 to elect members of Horsham District Council in West Sussex, England. It was held on the same day as other local elections in England.

References

  1. Andrew Teale. "Local Election Results 2011" . Retrieved 23 June 2020.