2011 Bristol City Council election

Last updated

2011 Bristol City Council election
Flag of England.svg
  2010 5 May 2011 2013  

24 of 70 seats (One Third) to Bristol City Council
36 seats needed for a majority
 First partySecond partyThird party
 
Party Liberal Democrats Labour Conservative
Seats won332114
Seat changeDecrease2.svg5Increase2.svg4Steady2.svg
Popular vote21,68231,17618,215
Percentage24.9%35.79%20.91%
SwingDecrease2.svg 9.38%Increase2.svg 9%Decrease2.svg 6.31%

 Fourth party
 
Party Green
Seats won2
Seat changeIncrease2.svg1
Popular vote12,535
Percentage14.39%
SwingIncrease2.svg 6.46%

Council control before election

Liberal Democrats

Council control after election

No Overall Control

The 2011 Bristol City Council elections were held on Thursday 5 May 2011, for 24 seats, that being one third of the total number of councillors. [lower-alpha 1] The Liberal Democrats, who had won overall control of the council in 2009 and increased their majority in 2010, experienced a drop in support and lost 5 seats; 4 to the Labour Party and 1 to the Green Party, which gained its second ever council seat in Bristol. This meant that the Lib Dems no longer had a majority on the council. However, they continued to run the council, relying on opposition groups to vote through any proposal.

Contents

Party2010 CllrsNet Gain/Loss2011 Cllrs
Conservative 14-14
Green 1+12
Labour 17+421
Liberal Democrats 38-533
Total70-70
2011 local election results in Bristol Bristol wards 2011.svg
2011 local election results in Bristol

Ward results

Bristol Council composition following the 2011 local elections Composition of Bristol City Council following the 2011 local elections.svg
Bristol Council composition following the 2011 local elections

Ashley

Bristol City Council Elections: Ashley Ward 2011 [3]
PartyCandidateVotes%±%
Green Gus Hoyt2,20642.65+11.62
Liberal Democrats Waliur Rahman1,43227.69-20.15
Labour Thangam Debbonaire 1,30225.17+12.06
Conservative Graham Roger Godwin Pearson2324.49-0.50
Majority77414.96-1.85
Green gain from Liberal Democrats Swing +15.89

Bedminster

Bristol City Council Elections: Bedminster Ward 2011 [4]
PartyCandidateVotes%±%
Labour Colin John Smith1,69440.93+8.21
Liberal Democrats Ian Robert Cooper83920.27-8.98
Conservative Doug Newton74918.10-3.57
Green Cath Slade62115.00+5.39
TUSC Robin Victor Clapp1253.02N/A
English Democrat Jon Baker1112.68N/A
Majority85520.6617.19
Labour hold Swing +8.60

Bishopsworth

Bristol City Council Elections: Bishopsworth Ward 2011 [5]
PartyCandidateVotes%±%
Conservative Richard Stephen Eddy1,60651.52+11.20
Labour Darren Eurwyn Lewis1,12636.12+1.91
Green Barrie Robert Lewis2798.95+1.40
Liberal Democrats Ian Humfrey Campion-Smith1063.40-14.52
Majority48015.40+9.29
Conservative hold Swing +4.65

Brislington East

Bristol City Council Elections: Brislington East Ward 2011 [6]
PartyCandidateVotes%±%
Labour Mike Langley1,38339.46+7.11
Conservative Lara Cozens1,22434.92+3.42
Liberal Democrats Pauline Mary Allen37410.67-12.86
Green Robin Whitlock2707.70+3.26
UKIP Mark Stanley Smith2186.22N/A
TUSC Martyn Ahmet361.03N/A
Majority1594.54+3.69
Labour hold Swing +1.85

Brislington West

Bristol City Council Elections: Brislington West Ward 2011 [7]
PartyCandidateVotes%±%
Liberal Democrats Jackie Norman1,12332.34-5.47
Labour Liam John McDonough1,06830.75+6.73
Conservative Colin Robert Bretherton66319.09-5.71
UKIP Philip John Collins3369.67N/A
Green Lucy MacKilligin2477.11+1.02
TUSC John Mark Yeandle361.04N/A
Majority551.59-11.42
Liberal Democrats hold Swing -6.10

Cabot

Bristol City Council Elections: Cabot Ward 2011 [8]
PartyCandidateVotes%±%
Liberal Democrats Alex Woodman1,44137.45-10.17
Labour Ben Mosley93624.32+10.44
Green Ben Appleby73919.20-2.24
Conservative Iain Jenkins Dennis64716.81-0.25
TUSC Chris Farrell852.21N/A
Majority50513.13-13.05
Liberal Democrats hold Swing -10.31

Clifton

Bristol City Council Elections: Clifton Ward 2011 [9]
PartyCandidateVotes%±%
Liberal Democrats Barbara Lilian Janke 1,66139.87-2.59
Conservative Charles James Hastings Lucas98723.69-3.50
Green Georgina Mary Bavetta80719.370.61
Labour Rosemary Patricia Chamberlin67816.27+4.67
TUSC Jack Jeffery330.79N/A
Majority67416.18+0.91
Liberal Democrats hold Swing +0.46

Clifton East

Bristol City Council Elections: Clifton East Ward 2011 [10]
PartyCandidateVotes%±%
Liberal Democrats Christian Martin1,19134.94-13.01
Conservative Marcus Bruton1,04030.51-1.58
Labour Charlotte Elisabeth Martin67019.65+11.74
Green Simon James Bennett46113.52+1.47
TUSC Patrick Burland471.38N/A
Majority1514.43-11.43
Liberal Democrats hold Swing -5.72

Cotham

Bristol City Council Elections: Cotham Ward 2011 [11]
PartyCandidateVotes%±%
Liberal Democrats Neil Robert Harrison1,69440.29-4.60
Labour Estella Jane Tincknell88921.14+7.37
Green Graham Woodruff83319.81-3.01
Conservative Gareth Alan-Williams73217.41-1.11
TUSC Amy Hillgrove571.36N/A
Majority80519.15-2.92
Liberal Democrats hold Swing -5.99

Easton

Bristol City Council Elections: Easton Ward 2011 [12]
PartyCandidateVotes%±%
Labour Faruk Choudhury1,50137.97+7.49
Liberal Democrats Zahir Malik1,09727.75-7.49
Green Katie Buse1,07527.19+1.57
Conservative David Thomas Harrison Lewis2807.08+1.07
Majority40410.22+5.46
Labour hold Swing +7.49

Eastville

Bristol City Council Elections: Eastville Ward 2011 [13]
PartyCandidateVotes%±%
Labour Mahmadur Khan1,45739.75+15.81
Liberal Democrats Muriel Cole1,06529.06-14.68
Conservative Nazir Muhammad63517.33-0.77
Green Josephine McLellan38610.53-3.69
TUSC Roger Stephen Thomas1223.33N/A
Majority39210.69-9.11
Labour gain from Liberal Democrats Swing +15.25

Filwood

Bristol City Council Elections: Filwood Ward 2011 [14]
PartyCandidateVotes%±%
Labour Jeff Lovell1,40063.84+11.14
Conservative Paul Francis Smith31114.18-2.47
Liberal Democrats Roger Graham Norman1356.16-10.13
BNP Michael John Hamblin1125.11-3.31
Green Stephen Petter1084.92+1.74
English Democrat Barbara Ann Wright924.20+1.44
TUSC Wayne Jefferson Coombes351.60N/A
Majority108949.66+13.61
Labour hold Swing +6.81

Frome Vale

Bristol City Council Elections: Frome Vale Ward 2011 [15]
PartyCandidateVotes%±%
Conservative Lesley Ann Alexander1,67145.21+8.11
Labour Bill Payne1,35836.74+8.90
Green Nick Foster2436.57-4.13
Liberal Democrats Jason Budd2185.90-7.39
English Democrat Greg Shaw1363.68N/A
TUSC Mark Ian Baker701.89N/A
Majority3138.47-0.79
Conservative hold Swing -0.40

Hartcliffe

Bristol City Council Elections: Hartcliffe Ward 2011 [16]
PartyCandidateVotes%±%
Labour Mark Brain1,50055.80+16.87
Conservative Shirley Hodges64223.88-3.11
English Democrat Stephen Michael Wright27210.12N/A
Liberal Democrats Anne Pauline White1485.51-16.97
Green Patrick Slade1264.69+1.58
Majority85831.92+19.98
Labour hold Swing +9.99

Hengrove

Bristol City Council Elections: Hengrove Ward 2011 [17]
PartyCandidateVotes%±%
Labour Barry Clark1,33137.55+8.50
Conservative George William Pendrill Maggs1,01028.49-0.85
Liberal Democrats Jos Clark92426.06-12.56
English Democrat Mike Blundell1895.33N/A
Green Graham Hugh Davey912.57-0.43
Majority3219.06-0.17
Labour gain from Liberal Democrats Swing 4.68

Hillfields

Bristol City Council Elections: Hillfields Ward 2011 [18]
PartyCandidateVotes%±%
Labour Phil Hanby1,53744.86+18.34
Liberal Democrats Helene Louise Gibson98928.87-8.55
Conservative Barbara Madeleine Lewis59417.34+2.27
Green Rob Telford2025.90-2.05
TUSC Matt Gordon1043.04N/A
Majority54815.99+5.09
Labour hold Swing +13.45

Knowle

Bristol City Council Elections: Knowle Ward 2011 [19]
PartyCandidateVotes%±%
Liberal Democrats Christopher Davies1,41339.14-9.35
Labour Gwyneth Brain1,21033.52+9.09
Conservative Graham David Morris52714.60-0.59
Green Glenn Royston Vowles38010.53+3.58
TUSC Domenico William Hill802.22N/A
Majority2035.62-18.44
Liberal Democrats hold Swing -9.22

Lawrence Hill

Bristol City Council Elections: Lawrence Hill Ward 2011 [20]
PartyCandidateVotes%±%
Labour Margaret Elizabeth Hickman1,61541.57+10.04
Liberal Democrats Abdul Malik1,05427.13-4.09
Independent Liiban Mohamed Abdi45811.79N/A
Green Christine Mary Prior3669.42-3.00
Conservative Charles William Alexander3228.29-8.41
TUSC Matthew Edward Carey701.80N/A
Majority56114.44+14.13
Labour gain from Liberal Democrats Swing +7.07

Southville

Bristol City Council Elections: Southville Ward 2011 [21]
PartyCandidateVotes%±%
Labour Sean David Beynon1,85643.34+13.57
Green Charles Nicholas Bolton1,61337.67+3.84
Conservative Adam Beda Tayler49911.65+0.52
Liberal Democrats Lena Wright3147.33-17.94
Majority56114.44+10.38
Labour hold Swing +4.87

St George East

Bristol City Council Elections: St George East Ward 2011 [22]
PartyCandidateVotes%±%
Labour Fabian Breckels1,73950.10+27.93
Conservative Philip Hutton1,10231.75-4.08
Liberal Democrats Paul Elvin3068.82-5.36
Green Chloe Alice Somers2196.31-4.12
TUSC Mike Luff1053.03N/A
Majority63718.35+4.69
Labour hold Swing +16.01

St George West

Bristol City Council Elections: St George West Ward 2011 [23]
PartyCandidateVotes%±%
Labour Peter Warren Hammond1,34642.04+10.39
Liberal Democrats Tony Potter93629.23+0.81
Conservative Sylvia Christine Windows43213.49-1.98
Green Genevieve Liveley43213.49+3.09
English Democrat Eddie Tranter1815.65-0.91
TUSC Bernie Lyons782.44N/A
Majority41012.81+9.58
Labour gain from Liberal Democrats Swing +5.60

Stockwood

Bristol City Council Elections: Stockwood Ward 2011 [24]
PartyCandidateVotes%±%
Conservative Jay Jethwa1,60647.10+5.67
Labour Yvonne Clapp1,02229.97+3.30
Liberal Democrats Michael Alan Goulden42612.49-12.03
Green Peter Anthony Goodwin35610.44+3.05
Majority58417.13+2.37
Conservative hold Swing +1.19

Whitchurch Park

Bristol City Council Elections: Whitchurch Park Ward 2011 [25]
PartyCandidateVotes%±%
Labour Helen Holland1,47251.59+13.46
Liberal Democrats Lorraine Horgan68824.11-15.27
Conservative Jenny Rogers44915.74+0.92
English Democrat Ray Carr1545.40N/A
Green Barney Smith903.15+1.35
Majority78427.48+26.23
Labour hold Swing +14.37

Windmill Hill

Bristol City Council Elections: Windmill Hill Ward 2011 [26]
PartyCandidateVotes%±%
Liberal Democrats Mark Bailey2,11850.55-1.28
Labour Narraser Rochelle Gordon1,08625.92+1.96
Green Lex Cumber58814.03+2.98
Conservative Tony Lee2556.09-4.31
TUSC Tom Baldwin1433.41N/A
Majority103224.63-3.24
Liberal Democrats hold Swing -1.62

Notes

  1. All locally registered electors (British, Irish, Commonwealth and European Union citizens) who were aged 18 or over on Thursday 2 May 2013 were entitled to vote in the local elections. Those who were temporarily away from their ordinary address (for example, away working, on holiday, in student accommodation or in hospital) were also entitled to vote in the local elections, [1] although those who had moved abroad and registered as overseas electors cannot vote in the local elections. It is possible to register to vote at more than one address (such as a university student who had a term-time address and lives at home during holidays) at the discretion of the local Electoral Register Office, but it remains an offence to vote more than once in the same local government election. [2]

Related Research Articles

<span class="mw-page-title-main">2009 Hertfordshire County Council election</span>

An election to Hertfordshire County Council took place on 4 June 2009 the date of the 2009 United Kingdom local elections. The whole elected council was up for election. The councillors were elected from the 77 wards, which return one each by first-past-the-post voting for a four-year term of office. The wards were the same as those used at the previous election in 2005.

<span class="mw-page-title-main">2009 East Sussex County Council election</span> 2009 UK local government election

The East Sussex County Council election, 2009 took place on 4 June 2009 as part of the 2009 United Kingdom local elections, having been delayed from 7 May, to coincide with elections to the European Parliament. All 49 seats of this council were up for election. The councillors were elected from 44 electoral divisions, which accordingly return one or two by first-past-the-post voting, for a four-year term of office.

<span class="mw-page-title-main">2009 Hampshire County Council election</span> 2009 UK local government election

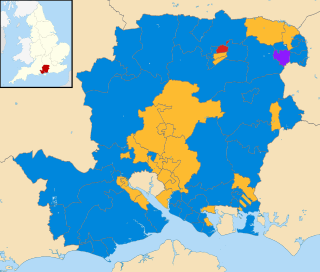
An election to Hampshire County Council took place on 4 June 2009 as part of the 2009 United Kingdom local elections, having been delayed from 7 May, to coincide with elections to the European Parliament. 78 councillors were elected from 75 electoral divisions, which returned either one or two county councillors each by first-past-the-post voting for a four-year term of office. The electoral divisions were the same as those used at the previous election in 2005. Elections in Portsmouth and Southampton do not coincide with this set, being unitary authorities outside the area covered by the County Council.

<span class="mw-page-title-main">2009 Worcestershire County Council election</span>

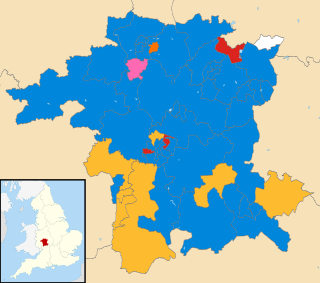
An election to Worcestershire County Council took place on 4 June 2009 as part of the 2009 United Kingdom local elections, alongside the 31 other County Councils, five of which are unitary, and a few other areas. The election had been delayed from 7 May, to coincide with elections to the European Parliament. 57 councillors were elected from 53 wards, which returned either one or two county councillors each by first-past-the-post voting for a four-year term of office. The wards were unchanged from the previous election in 2005. The election saw the Conservative Party retain overall control of the council with a majority of 14 seats, up from a majority of just 2 seats.

<span class="mw-page-title-main">2012 United Kingdom local elections</span> Elections that were held across England, Scotland and Wales

The 2012 United Kingdom local elections were held across England, Scotland and Wales on 3 May 2012. Elections were held in 128 English local authorities, all 32 Scottish local authorities and 21 of the 22 Welsh unitary authorities, alongside three mayoral elections including the London mayoralty and the London Assembly. Referendums were also held in 11 English cities to determine whether or not to introduce directly elected mayors.

<span class="mw-page-title-main">2012 City of Lincoln Council election</span> UK municipal election

The 2012 City of Lincoln Council election took place on 3 May 2012 to elect one-third of the members of City of Lincoln Council in Lincolnshire, England, for a 4-year term of office. This was on the same day as other 2012 United Kingdom local elections.

<span class="mw-page-title-main">2013 United Kingdom local elections</span>

The 2013 United Kingdom local elections took place on Thursday 2 May 2013. Elections were held in 35 English councils: all 27 non-metropolitan county councils and eight unitary authorities, and in one Welsh unitary authority. Direct mayoral elections took place in Doncaster and North Tyneside. These elections last took place on the 4 June 2009 at the same time as the 2009 European Parliament Elections, except for County Durham, Northumberland and the Anglesey where elections last took place in 2008.

<span class="mw-page-title-main">2013 Derbyshire County Council election</span>

An election to Derbyshire County Council took place on 2 May 2013 as part of the 2013 United Kingdom local elections. Following the final draft of the 2012 electoral review, 64 councillors were elected from 61 electoral divisions which returned either one or two county councillors each by first-past-the-post voting for a four-year term of office. No elections were held in the City of Derby, which is a unitary authority outside the area covered by the County Council. The Labour Party won back control of the council by a landslide victory, taking forty-two of the authority's sixty-four seats.

<span class="mw-page-title-main">2013 Leicestershire County Council election</span> 2013 UK local government election

An election to Leicestershire County Council took place on 2 May 2013 as part of the 2013 United Kingdom local elections. 55 councillors were elected from 52 electoral divisions, which returned either one or two county councillors each by first-past-the-post voting for a four-year term of office. The Conservatives held control of the council with a reduced majority of 5 seats. Despite a strong challenge from UKIP, the party only gained 2 seats whilst the Liberal Democrats lost one seat and Labour recouped some of their 2009 losses, gaining 6 seats.

<span class="mw-page-title-main">2013 East Sussex County Council election</span> 2013 UK local government election

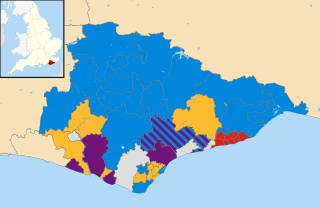
The East Sussex County Council election, 2013 took place on 2 May 2013 as part of the 2013 United Kingdom local elections. All 49 councillors of East Sussex County Council were elected from 44 electoral divisions, which return either one or two councillors each by first-past-the-post voting for a four-year term of office. The electoral divisions were the same as those used at the previous election in 2009. No elections were held in Brighton and Hove, which is a unitary authority outside the area covered by the County Council.

<span class="mw-page-title-main">2013 Hertfordshire County Council election</span>

An election to Hertfordshire County Council took place on 2 May 2013, as part of the 2013 United Kingdom local elections. 77 electoral divisions elected one county councilor each by first-past-the-post voting for a four-year term of office. The electoral divisions were the same as those used at the previous election in 2009.

<span class="mw-page-title-main">2013 Essex County Council election</span> 2013 UK local government election

An election to Essex County Council took place on 2 May 2013 as part of the 2013 United Kingdom local elections. 75 councillors were elected from 70 electoral divisions, which returned either one or two county councillors each by first-past-the-post voting for a four-year term of office. The electoral divisions were the same as those used at the previous election in 2009. No elections were held in Thurrock or Southend-on-Sea, which are unitary authorities outside the area covered by the County Council.

<span class="mw-page-title-main">2013 Staffordshire County Council election</span> UK local elections

An election to Staffordshire County Council took place on 2 May 2013 as part of the 2013 United Kingdom local elections. 62 electoral divisions returned one county councillor each by first-past-the-post voting for a four-year term of office. Following a boundary review, new electoral division boundaries were established for this election. No elections were held in Stoke-on-Trent, which is a unitary authority outside the area covered by the County Council. The council continues to be administered on the Leader and Cabinet model.

<span class="mw-page-title-main">2013 Bristol City Council election</span> 2013 UK local government election

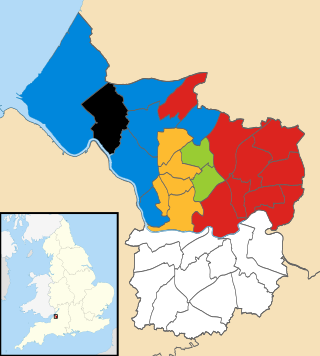
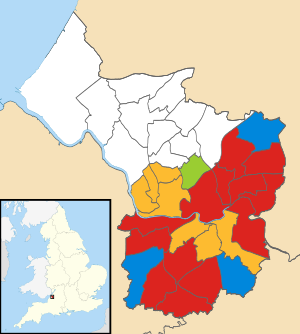
Elections for one third of Bristol City Council were held on 2 May 2013 as part of the 2013 United Kingdom local elections. No party gained overall control of the chamber, although administrative power rested with the Mayor of Bristol, who had been first elected in November 2012

<span class="mw-page-title-main">2013 Dorset County Council election</span>

An election to Dorset County Council took place on 2 May 2013 as part of the United Kingdom local elections. 45 councillors were elected from 42 electoral divisions, which returned either one or two county councillors each by first-past-the-post voting for a four-year term of office. The electoral divisions were the same as those used at the previous election in 2009. No elections were held in Bournemouth or Poole, which are unitary authorities outside the area covered by the County Council. The election saw the Conservative Party maintain overall control of the council.

Council elections for the City of Preston, Lancashire were held on 22 May 2014 as part of the 2014 United Kingdom local elections. The elections have been moved from earlier on in May to coincide with the North West component of the 2014 European Parliament election. Nineteen electoral wards were fought with those councillors elected in the corresponding elections in 2010 defending their seats due to the "in thirds" system employed in Preston local elections. The previous elections to Preston council occurred in 2012 but due to the "in thirds" system employed by Preston council, councillors are elected for four-year terms. This means gains, losses, and vote share comparisons this year are with those fought in 2010.

<span class="mw-page-title-main">2014 Harrogate Borough Council election</span>

Elections to Harrogate Borough Council were held on 22 May 2014. A third of the council was up for election, with voting only in the urban wards of Harrogate, Knaresborough and Ripon. The elections were held on the same day as the British local elections and the European Parliament elections. Each ward up for election returned a councillor for a four-year term of office.

<span class="mw-page-title-main">2014 Waltham Forest London Borough Council election</span> 2014 local election in England

The 2014 Waltham Forest Council election took place on 22 May 2014 to elect members of Waltham Forest Council in England. This was on the same day as other local elections.

<span class="mw-page-title-main">2017 Gloucestershire County Council election</span>

The 2017 Gloucestershire County Council election took place on 4 May 2017 as part of the 2017 local elections in the United Kingdom. All 53 councillors were elected from electoral divisions which returned one county councillor each by first-past-the-post voting for a four-year term of office. Control of the council went from a Conservative Party minority to a majority administration.

<span class="mw-page-title-main">2017 Lincolnshire County Council election</span>

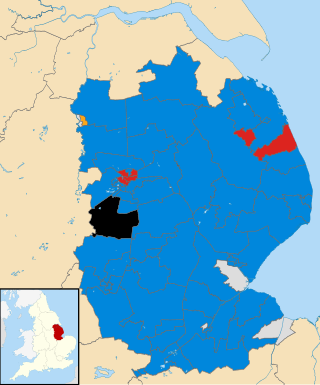
The 2017 Lincolnshire County Council election took place in non-metropolitan Lincolnshire on 4 May 2017 as part of the 2017 local elections in the United Kingdom. A total of 70 councillors were elected across the seven non-metropolitan districts that make up the administrative county of Lincolnshire from 70 single member electoral divisions by first-past-the-post voting for a four-year term of office. The election did not include North Lincolnshire and North East Lincolnshire as they are separate unitary authorities.

References

  1. "The Representation of the People (Form of Canvass) (England and Wales) Regulations 2006, Schedule Part 1". Legislation.gov.uk. 13 October 2011. Retrieved 18 April 2012.
  2. "I have two homes. Can I register at both addresses?". The Electoral Commission. Archived from the original on 15 November 2008. Retrieved 5 January 2011.
  3. "Ashley Ward". Bristol City Council. Retrieved 22 March 2016.
  4. "Bedminster Ward". Bristol City Council. Retrieved 22 March 2016.
  5. "Bishopsworth Ward". Bristol City Council. Retrieved 22 March 2016.
  6. "Brislington East Ward". Bristol City Council. Retrieved 22 March 2016.
  7. "Brislington West Ward". Bristol City Council. Retrieved 22 March 2016.
  8. "Cabot Ward". Bristol City Council. Retrieved 22 March 2016.
  9. "Clifton Ward". Bristol City Council. Retrieved 22 March 2016.
  10. "Clifton East Ward". Bristol City Council. Retrieved 22 March 2016.
  11. "Cotham Ward". Bristol City Council. Retrieved 22 March 2016.
  12. "Easton Ward". Bristol City Council. Retrieved 22 March 2016.
  13. "Eastville Ward". Bristol City Council. Retrieved 22 March 2016.
  14. "Filwood Ward". Bristol City Council. Retrieved 22 March 2016.
  15. "Frome Vale Ward". Bristol City Council. Retrieved 22 March 2016.
  16. "Hartcliffe Ward". Bristol City Council. Retrieved 22 March 2016.
  17. "Hengrove Ward". Bristol City Council. Retrieved 22 March 2016.
  18. "Hillfields Ward". Bristol City Council. Retrieved 22 March 2016.
  19. "Knowle Ward". Bristol City Council. Retrieved 22 March 2016.
  20. "Lawrence Hill Ward". Bristol City Council. Retrieved 22 March 2016.
  21. "Southville Ward". Bristol City Council. Retrieved 22 March 2016.
  22. "St George East Ward". Bristol City Council. Retrieved 22 March 2016.
  23. "St George West Ward". Bristol City Council. Retrieved 22 March 2016.
  24. "Stockwood Ward". Bristol City Council. Retrieved 22 March 2016.
  25. "Whitchurch Park Ward". Bristol City Council. Retrieved 22 March 2016.
  26. "Windmill Hill Ward". Bristol City Council. Retrieved 22 March 2016.