2011 Leeds City Council election

Last updated

2011 Leeds City Council election
Flag of England.svg
  2010 5 May 2011 2012  

33 of the 99 seats on Leeds City Council
50 seats needed for a majority
 First partySecond partyThird party
 
Party Labour Conservative Liberal Democrats
Last election20 seats, 35.7%6 seats, 26.6%5 seats, 24.5%
Seats won2172
Seats after552116
Seat changeIncrease2.svg7Decrease2.svg 1Decrease2.svg 5
Popular vote99,95557,92728,985
Percentage46.8%27.1%13.6%

Leeds UK local election 2011 map.svg
Labour in red (21), Conservatives in blue (7), Liberal Democrats in yellow (2), Greens in light green (1) and Morley Borough Independents in dark green (1).

Council control before election

Minority administration
Labour

Council control after election

Majority administration
Labour

The 2011 Leeds City Council election took place on Thursday 5 May 2011 to elect members of Leeds City Council in England. It was held on the same day as other local elections across the UK.

Contents

As per the election cycle, one third of the council's seats were up for election. The councillors subsequently elected replaced those elected when their individual seats were previously contested in 2007.

After forming a minority administration following the 2010 election, the Labour Party regained overall control of the council for the first time since the council had been in no overall control in 2004. Labour gained seven seats, including four from the Liberal Democrats. [1] [2] [3] [4]

Election summary

Leeds City Council Election Result 2011 [4]
PartySeatsGainsLossesNet gain/lossSeats %Votes %Votes+/−
  Labour 2270Increase2.svg766.746.899,955+11.1
  Conservative 712Decrease2.svg 121.227.157,927+0.5
  Liberal Democrats 205Decrease2.svg 56.113.628,985-10.9
  Green 100Steady2.svg3.04.810,298+2.4
  Morley Borough Independent 101Decrease2.svg 13.02.75,718+0.7
  UKIP 000Steady2.svg0.02.04,383+1.1
  English Democrat 000Steady2.svg0.01.32,698+1.3
 Alliance for Green Socialism000Steady2.svg0.00.81,727+0.1
  BNP 000Steady2.svg0.00.51,105-6.3
  Independent 000Steady2.svg0.00.3582-0.1
  TUSC 000Steady2.svg0.00.1252+0.1

This result had the following consequences for the total number of seats on the council after the elections: [2]

PartyPrevious councilNew council
Labour4855
Conservative2221
Liberal Democrat2116
Morley Borough Independent65
Green22
Total9999
Working majority -3  11 

Councillors who did not stand for re-election

Councillor/s who did not stand for re-election (2)
CouncillorWardFirst electedPartyReasonSuccessor
Andrew Barker [5] Horsforth 2000 Liberal Democrats stood downDawn Collins (Conservative)
Ruth Feldman [6] Alwoodley 1999 Conservative stood downDan Cohen (Conservative)

Ward results

Adel & Wharfedale [3] [4]
PartyCandidateVotes%±%
Conservative Les Carter* 4,144 50.2 +7.0
Liberal Democrats Christine Shaw1,75821.3-15.5
Labour Nigel Gill1,70120.6+5.7
Green Paul Marchant3374.1+1.7
UKIP Claire Wilson-Sharp3153.8+3.8
Majority2,38628.9+22.5
Turnout 8,25552
Conservative hold Swing +11.2
Alwoodley [3] [4]
PartyCandidateVotes%±%
Conservative Dan Cohen 4,254 53.3 +3.9
Labour Katy Sian2,83735.4+8.2
UKIP Warren Hendon5476.9+4.1
Alliance for Green SocialismBrian Jackson3514.4+3.2
Majority1,41717.9-4.3
Turnout 7,97945
Conservative hold Swing -2.1
Ardsley & Robin Hood [3] [4]
PartyCandidateVotes%±%
Labour Jack Dunn* 2,847 48.7 +7.5
Conservative Robert Buxton1,37723.5-1.3
English Democrat Joanna Beverley88015.0+15.0
UKIP Karen Foster3846.6+2.6
Liberal Democrats Katherine Bavage3606.2-10.0
Majority1,47025.1+8.7
Turnout 5,84834
Labour hold Swing +4.4
Armley [3] [4]
PartyCandidateVotes%±%
Labour Jim McKenna* 3,428 62.8 +16.6
Conservative Ross Burgham90116.5+1.3
Green Jane Morrison74813.7+7.2
Liberal Democrats Ruth Pecher3827.0-15.6
Majority2,52746.3+22.7
Turnout 5,45931
Labour hold Swing +7.6
Beeston & Holbeck [3] [4]
PartyCandidateVotes%±%
Labour Adam Ogilvie* 2,880 61.3 +13.9
Conservative Robert Winfield83817.8-1.8
UKIP Wilfred Woodhouse4259.1+4.8
Green David Smith3086.6+4.2
Liberal Democrats Paul Swain2455.2-10.2
Majority2,04243.5+15.8
Turnout 4,69631
Labour hold Swing +7.8
Bramley & Stanningley [3] [4]
PartyCandidateVotes%±%
Labour Ted Hanley* 3,121 60.8 +19.7
Conservative Alistair McDowall1,04020.2+1.1
Green Kate Bisson51410.0+6.8
Liberal Democrats Nathan Fossey4629.0-14.9
Majority2,08140.5+23.4
Turnout 5,13731
Labour hold Swing +9.3
Burmantofts & Richmond Hill [3] [4]
PartyCandidateVotes%±%
Labour Asghar Khan 2,515 51.6 +7.7
Liberal Democrats David Hollingsworth*1,77936.5+2.6
Green Peter Exley3567.3+4.8
Conservative Michael Wheeler2264.6-3.7
Majority73615.1+5.1
Turnout 4,87632
Labour gain from Liberal Democrats Swing +2.5
Calverley & Farsley [3] [4]
PartyCandidateVotes%±%
Conservative Joseph Marjoram* 3,568 48.1 +8.4
Labour Carol Hughes3,15842.6+8.0
Liberal Democrats Jude Arbuckle6859.2-10.0
Majority4105.5+0.3
Turnout 7,41142
Conservative hold Swing +0.2
Chapel Allerton [3] [4]
PartyCandidateVotes%±%
Labour Mohammed Rafique* 4,121 63.6 +8.3
Conservative David Myers86813.4-0.6
Alliance for Green SocialismMike Davies5027.8-0.1
Liberal Democrats Adam Slack5017.7-12.8
Green Colin Noble4847.5+7.5
Majority3,25350.2+15.4
Turnout 6,47638
Labour hold Swing +4.4
City & Hunslet [3] [4]
PartyCandidateVotes%±%
Labour Patrick Davey* 3,230 62.7 +21.2
Liberal Democrats Jahangir Aziz1,04720.3-8.8
Conservative Matthew Wharton87717.0-0.3
Majority2,18342.4+30.0
Turnout 5,15425
Labour hold Swing +15.0
Cross Gates & Whinmoor [3] [4]
PartyCandidateVotes%±%
Labour Pauleen Grahame* 3,653 56.9 +10.9
Conservative Patrick Hennigan1,47222.9-4.7
UKIP Darren Oddy5107.9+7.9
Liberal Democrats Keith Norman2714.2-13.7
Independent David Hudson2574.0+4.0
Green Ben Goldthorp2533.9+3.9
Majority2,18134.0+15.6
Turnout 6,41637
Labour hold Swing +7.8
Farnley & Wortley [3] [4]
PartyCandidateVotes%±%
Green Ann Blackburn* 2,995 47.4 +23.1
Labour Stuart McKenna2,35337.3+4.2
Conservative Caroline Oldfield76912.2-5.1
Liberal Democrats Philip Moore1993.2-11.9
Majority64210.2+1.4
Turnout 6,31635
Green hold Swing +9.4
Garforth & Swillington [3] [4]
PartyCandidateVotes%±%
Labour Mark Dobson* 4,906 64.1 +20.4
Conservative Ryan Stephenson2,47932.4-2.2
Liberal Democrats Christine Golton2633.4-12.4
Majority2,42731.7+22.5
Turnout 7,64848
Labour hold Swing +11.3
Gipton & Harehills [3] [4]
PartyCandidateVotes%±%
Labour Arif Hussain* 4,805 80.2 +19.8
Liberal Democrats Qadeer Khan5068.4-16.1
Conservative Beatrice Greenwood4627.7+0.2
Alliance for Green SocialismAzar Iqbal2203.7+1.9
Majority4,29971.7+35.9
Turnout 5,99338
Labour hold Swing +17.9
Guiseley & Rawdon [3] [4]
PartyCandidateVotes%±%
Conservative Paul Wadsworth* 3,276 42.8 +2.6
Labour Mike King2,85337.3+9.1
Liberal Democrats Cindy Cleasby77810.2-12.9
Green Colin Avison5296.9+3.5
BNP Andrew Gallagher2132.8-2.3
Majority4235.5-6.5
Turnout 7,64944
Conservative hold Swing -3.2
Harewood [3] [4]
PartyCandidateVotes%±%
Conservative Rachael Procter* 5,003 67.1 +7.5
Labour Joshua Blower1,58121.2+3.6
Liberal Democrats Sara Howell4726.3-10.8
Green Patricia Capstick4005.4+3.0
Majority3,44245.9+3.9
Turnout 7,45651
Conservative hold Swing +1.9
Headingley [3] [4]
PartyCandidateVotes%±%
Labour Neil Walshaw 1,536 39.6 +13.2
Liberal Democrats James Monaghan*1,09828.3-22.7
Green Christopher Foren68217.6+8.5
Conservative Christina Annesley3709.5-3.0
TUSC Ian Pattison882.3+2.3
Independent David Rudge691.8+1.8
UKIP Peter Morgan391.0+1.0
Majority43811.3-13.3
Turnout 3,88226
Labour gain from Liberal Democrats Swing +17.9
Horsforth [3] [4]
PartyCandidateVotes%±%
Conservative Dawn Collins 2,680 33.7 +8.5
Liberal Democrats Kate Arbuckle2,46631.0-16.8
Labour Robert Wilkinson2,21327.9+8.9
UKIP Paul Hellyer4215.3+2.7
TUSC Andrew Smith1642.1+2.1
Majority2142.7-20.0
Turnout 7,94445
Conservative gain from Liberal Democrats Swing +12.6
Hyde Park & Woodhouse [3] [4]
PartyCandidateVotes%±%
Labour Gerry Harper* 2,332 57.4 +17.6
Green Robert Simpson68916.9+9.1
Liberal Democrats Karim Abdul-Ghaffer68816.9-21.2
Conservative Shahrukh Malik3568.8-1.5
Majority1,64340.4+38.7
Turnout 4,06525
Labour hold Swing +4.2
Killingbeck & Seacroft [3] [4]
PartyCandidateVotes%±%
Labour Vonnie Morgan* 3,761 73.5 +19.5
Conservative Billy Flynn84716.6-0.1
Liberal Democrats Joanne Binns5089.9-6.8
Majority2,91457.0+19.7
Turnout 5,11631
Labour hold Swing +9.8
Kippax & Methley [3] [4]
PartyCandidateVotes%±%
Labour James Lewis* 4,156 63.3 +12.0
Conservative James Langley1,42821.7-3.1
UKIP Paul Spivey6099.3+4.2
Liberal Democrats Anne Bagnall3745.7-7.6
Majority2,72841.5+15.0
Turnout 6,56741
Labour hold Swing +7.5
Kirkstall [3] [4]
PartyCandidateVotes%±%
Labour John Illingworth* 3,634 64.5 +22.1
Conservative Daniel Whitehouse68012.1-2.9
Liberal Democrats Chris Lovell63611.3-21.7
Green Morgan Tatchell-Evans5279.4+4.4
Independent Stuart Long1572.8+2.8
Majority2,95452.4+43.0
Turnout 5,63435
Labour hold Swing +12.5
Middleton Park [3] [4]
PartyCandidateVotes%±%
Labour Judith Blake* 3,313 64.5 +15.3
BNP Kevin Meeson89217.4-3.2
Conservative James McFarland67913.2-1.0
Liberal Democrats Sadie Fisher2524.9-8.5
Majority2,42147.1+18.5
Turnout 5,13628
Labour hold Swing +9.2
Moortown [3] [4]
PartyCandidateVotes%±%
Labour Rebecca Charlwood 3,688 44.5 +9.3
Liberal Democrats Brenda Lancaster*2,83434.2-0.1
Conservative Mark Rowlinson1,38016.7-8.7
Alliance for Green SocialismAllan House3814.6+2.2
Majority85410.3+9.4
Turnout 8,28348
Labour gain from Liberal Democrats Swing +4.7
Morley North [3] [4]
PartyCandidateVotes%±%
Morley Borough Independent Bob Gettings* 3,642 52.9 +19.5
Labour Kathryn Rose1,59923.2+0.5
Conservative Robin Ghosh87412.7-8.4
English Democrat Tom Redmond5738.3+8.3
Liberal Democrats Peter Andrews1992.9-8.6
Majority2,04329.7+19.1
Turnout 6,88739
Morley Borough Independent hold Swing +9.5
Morley South [3] [4]
PartyCandidateVotes%±%
Labour Neil Dawson 2,129 33.4 +9.9
Morley Borough Independent Terry Grayshon*2,07632.6+5.9
English Democrat Chris Beverley1,24519.6+19.6
Conservative Neil Hunt73611.6-6.2
Liberal Democrats Robert Jacques1802.8-8.0
Majority530.8-2.4
Turnout 6,36638
Labour gain from Morley Borough Independent Swing +2.0
Otley & Yeadon [3] [4]
PartyCandidateVotes%±%
Liberal Democrats Colin Campbell* 3,185 38.6 -6.3
Labour John Eveleigh3,02636.7+12.8
Conservative Nigel Francis2,03424.7-0.4
Majority1591.9-17.9
Turnout 8,24547
Liberal Democrats hold Swing -9.5
Pudsey [3] [4]
PartyCandidateVotes%±%
Labour Co-op Richard Lewis* 3,669 53.4 +11.1
Conservative Jason Aldiss1,98728.9-0.3
UKIP Phil Banks6369.3+9.3
Green Irene Dracup3214.7+2.1
Liberal Democrats Brendan Stubbs2623.8-14.3
Majority1,68224.5+11.4
Turnout 6,87540
Labour hold Swing +5.7
Rothwell [3] [4]
PartyCandidateVotes%±%
Labour Karen Bruce 2,889 46.1 +10.1
Liberal Democrats Steve Smith*2,36537.7+0.0
Conservative Louise Turner1,01816.2-3.1
Majority5248.4+6.7
Turnout 6,27240
Labour gain from Liberal Democrats Swing +5.0
Roundhay [3] [4]
PartyCandidateVotes%±%
Labour Christine MacNiven 4,307 50.3 +11.6
Conservative Valerie Kendall*2,85033.3-0.3
Liberal Democrats Adam Douglas5786.7-14.7
Green Paul Ellis5596.5+6.5
Alliance for Green SocialismMalcolm Scott2733.2-0.4
Majority1,45717.0+11.8
Turnout 8,56749
Labour gain from Conservative Swing +5.9
Temple Newsam [3] [4]
PartyCandidateVotes%±%
Labour Katherine Mitchell 3,707 54.4 +16.8
Conservative David Schofield*2,64838.8+11.0
Liberal Democrats Ian Dowling4646.8-7.3
Majority1,05915.5+5.7
Turnout 6,81942
Labour gain from Conservative Swing +2.9
Weetwood [3] [4]
PartyCandidateVotes%±%
Liberal Democrats Sue Bentley* 2,605 39.1 -4.1
Labour Caroline Gruen2,07231.1+7.9
Conservative Natalie Oliver1,28219.3-4.8
Green Martin Hemingway5969.0+3.8
Independent Alan Procter991.5+0.5
Majority5338.0-11.2
Turnout 6,65439
Liberal Democrats hold Swing -6.0
Wetherby [3] [4]
PartyCandidateVotes%±%
Conservative Alan Lamb* 4,524 59.9 +7.0
Labour James Barber1,94525.8+5.0
Liberal Democrats Jonathan Bentley5837.7-10.8
UKIP David Macey4976.6+1.4
Majority2,57934.2+2.1
Turnout 7,54949
Conservative hold Swing +1.0

Related Research Articles

<span class="mw-page-title-main">Leeds City Council</span> Local government body in England

Leeds City Council is the local authority of the City of Leeds in West Yorkshire, England. It is a metropolitan district council, one of five in West Yorkshire and one of 36 in the metropolitan counties of England, and provides the majority of local government services in Leeds. It has the second-largest population of any council in the United Kingdom with approximately 800,000 inhabitants living within its area; only Birmingham City Council has more. Since 1 April 2014, it has been a constituent council of the West Yorkshire Combined Authority.

<span class="mw-page-title-main">1999 Leeds City Council election</span>

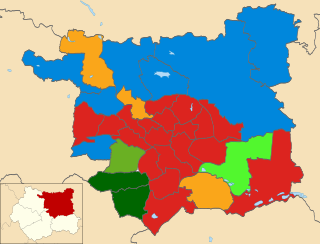
The 1999 Leeds City Council election took place on 6 May 1999 to elect members of City of Leeds Metropolitan Borough Council in West Yorkshire, England. One third of the council was up for election, as well as a vacancy each in Horsforth, Moortown and Wetherby. Prior to the election, the Liberal Democrats had gained a seat in Bramley from Labour, and Hunslet councillor, Mark Davies, had defected from Labour to Independent Socialist.

<span class="mw-page-title-main">2000 Leeds City Council election</span>

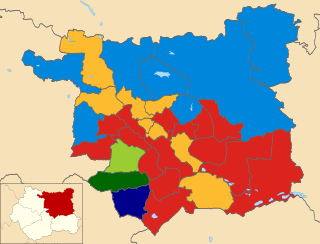
The Leeds City Council election took place on 4 May 2000 to elect members of City of Leeds Metropolitan Borough Council in West Yorkshire, England. Since the last election, Labour had lost a by-election to the Lib Dems in Harehills, and long-serving Chapel Allerton councillor, Garth Frankland, had defected from Labour to Left Alliance. One third of the council was up for election and the Labour Party stayed in overall control of the council. Overall turnout in the election was 27.5%.

<span class="mw-page-title-main">2012 Leeds City Council election</span>

The 2012 Leeds City Council election took place on Thursday 3 May 2012 to elect members to Leeds City Council in England. It was held on the same day as other local elections across the UK.

<span class="mw-page-title-main">2010 Leeds City Council election</span>

The 2010 Leeds City Council election took place on Thursday 6 May 2010 to elect members of Leeds City Council in England. It was held on the same day as the 2010 general election and other local elections across the UK.

<span class="mw-page-title-main">2008 Leeds City Council election</span>

The 2008 Leeds City Council election took place on Thursday 1 May 2008 to elect members of Leeds City Council in England.

<span class="mw-page-title-main">2007 Leeds City Council election</span>

The 2007 Leeds City Council election took place on Thursday 3 May 2007 to elect members of Leeds City Council in England.

<span class="mw-page-title-main">2006 Leeds City Council election</span>

The 2006 Leeds City Council election took place on Thursday 4 May 2006 to elect members of Leeds City Council in England.

<span class="mw-page-title-main">2014 Leeds City Council election</span>

The 2014 Leeds City Council election took place on Thursday 22 May 2014 to elect members of Leeds City Council in England. It was held on the same day as the 2014 European Parliament election and other local elections across the UK.

<span class="mw-page-title-main">2014 Merton London Borough Council election</span> 2014 local election in England, UK

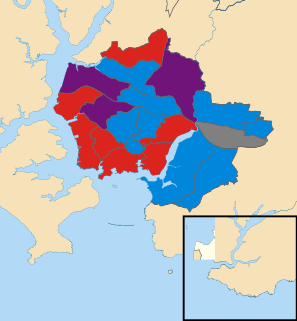
Elections for the London Borough of Merton were held on 22 May 2014 to elect members of Merton London Borough Council in England. This was on the same day as other local elections in England and an election to the European Parliament.

<span class="mw-page-title-main">2014 Plymouth City Council election</span>

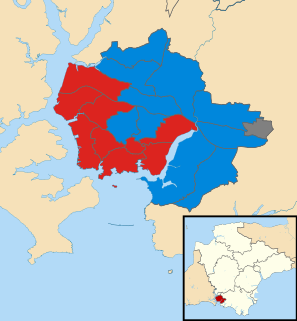
The 2014 Plymouth City Council election took place on 22 May 2014 to elect members of Plymouth City Council in England. This was on the same day as other local elections. The election was won by the Labour Party, who maintained their overall majority. The UK Independence Party gained representation on the council for the first time, and this was the only election in which the party won seats in Plymouth.

<span class="mw-page-title-main">2015 Leeds City Council election</span>

The 2015 Leeds City Council election took place on Thursday 7 May 2015 to elect members of Leeds City Council in England. It was held on the same day as the 2015 general election and other local elections across the UK.

<span class="mw-page-title-main">2015 Plymouth City Council election</span>

The 2015 Plymouth City Council election took place on 7 May 2015 to elect members of Plymouth City Council in England.

<span class="mw-page-title-main">2016 Leeds City Council election</span>

The 2016 Leeds City Council election took place on Thursday 5 May 2016 to elect members of Leeds City Council in England. It was on the same day as other local elections.

<span class="mw-page-title-main">2018 Leeds City Council election</span>

The 2018 Leeds City Council election took place on Thursday 3 May 2018 to elect members of Leeds City Council in England. It was held on the same day as other local elections across England and the rest of the UK.

<span class="mw-page-title-main">Hunslet and Riverside (ward)</span> Electoral ward in Leeds, England

Hunslet and Riverside is an electoral ward of Leeds City Council in Leeds, West Yorkshire, largely covering the inner city area of Hunslet to the south of the city centre. It was created in advance of the 2018 council election.

<span class="mw-page-title-main">2019 Leeds City Council election</span>

The 2019 Leeds City Council election took place on Thursday 2 May 2019 to elect members of Leeds City Council in England. It was held on the same day as other local elections across England and the rest of the UK.

<span class="mw-page-title-main">2021 Leeds City Council election</span>

The 2021 Leeds City Council election took place on Thursday 6 May 2021 to elect members of Leeds City Council in England. It was held on the same day as other local elections across England and the rest of the UK, including the inaugural West Yorkshire mayoral election.

<span class="mw-page-title-main">2022 United Kingdom local elections</span>

Local elections in the United Kingdom took place on 5 May 2022. These included elections for all London borough councils, and for all local authorities in Wales and Scotland. Most seats in England were last up for election in 2018 and in Scotland and Wales in 2017. The elections coincided with the 2022 Northern Ireland Assembly election. In 91 cases, most of them in Wales, council seats were uncontested, each having only one candidate. Three seats in Scotland remained unfilled as no one stepped forward to fill them.

<span class="mw-page-title-main">2022 Leeds City Council election</span>

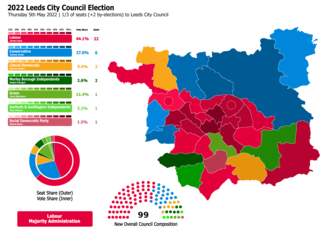
The 2022 Leeds City Council election took place on Thursday 5 May 2022 to elect members of Leeds City Council in England. It was held on the same day as other local elections across the United Kingdom.

References

  1. "News: Leeds Council Election Results 2011: Labour Takes Control | What's On in Leeds | Eating Out in Leeds | Listings | Leeds Guide Magazine". Archived from the original on 25 July 2011. Retrieved 12 May 2011.
  2. 1 2 "Elections 2011: England council elections - Leeds". BBC News Online . Retrieved 22 January 2013.
  3. 1 2 3 4 5 6 7 8 9 10 11 12 13 14 15 16 17 18 19 20 21 22 23 24 25 26 27 28 29 30 31 32 33 34 "Leeds local election 2011: Results in full". Yorkshire Evening Post . Retrieved 22 January 2013.
  4. 1 2 3 4 5 6 7 8 9 10 11 12 13 14 15 16 17 18 19 20 21 22 23 24 25 26 27 28 29 30 31 32 33 34 35 "Local Elections 2011: Leeds". andrewteale.me.uk. Retrieved 22 January 2013.
  5. "Councillor Andrew Barker". democracy.leeds.gov.uk. Leeds City Council . Retrieved 23 December 2018.
  6. "Councillor Ruth Feldman". democracy.leeds.gov.uk. Leeds City Council . Retrieved 11 October 2018.