2011 Sheffield City Council election

Last updated

2011 Sheffield City Council election
Flag of England.svg
  2010 5 May 2011 2012  

One third of seats (28 of 84) to Sheffield City Council
43 seats needed for a majority
 First partySecond party
 
Party Labour Liberal Democrats
Seats won216
Seat changeIncrease2.svg9Decrease2.svg9

 Third partyFourth party
 
Party Green Conservative
Seats won10
Seat changeSteady2.svg0Steady2.svg0

Sheffield local election map 2011.gif
Map showing the results of the 2011 Sheffield City Council elections.

Majority party before election

No Overall Control

Majority party after election

Labour

Sheffield City Council elections took place on 5 May 2011. There were 28 seats up for election, one third of the council. The last election left the council with no overall control. Since the previous election, Liberal Democrat councillor Ben Curran, and Lib Dem-turned-independent Frank Taylor had defected to Labour leaving both parties equal at 41 councillors each. This election saw Labour regain control of the council that they lost in 2006, with nine gains from the Lib Dems. Overall turnout was 41.8%. [1]

Contents

Councillors elected in 2007 Sheffield Council election defended their seats this year.

Election result

Sheffield City Council Election Result 2011
PartySeatsGainsLossesNet gain/lossSeats %Votes %Votes+/−
  Labour 2190+975.047.978,147+12.3
  Liberal Democrats 609-921.425.942,305-10.3
  Conservative 00000.011.719,016-2.9
  Green 10003.611.218,322+4.9
  UKIP 00000.01.82,914-1.0
  TUSC 00000.00.81,266+0.4
  BNP 00000.00.4647-3.4
  Independent 00000.00.2300+0.1
  Socialist Equality 00000.00.1116N/A

This result had the following consequences for the total number of seats on the Council after the elections:

PartyPrevious councilNew council+/-
Labour4150Increase2.svg9
Liberal Democrats4132Decrease2.svg9
Greens22Steady2.svg
Total8484
Working majority 0  16 

Ward results

Arbourthorne

Arbourthorne [1]
PartyCandidateVotes%±%
Labour John Robson* 2,938 58.9 +11.8
Green Jennyfer Marie Andrea Barnard96519.3+15.8
Liberal Democrats Chris Tutt56611.3-16.1
Conservative Peter Smith51710.3-1.7
Majority1,97339.6+19.9
Turnout 4,98639.3-15.6
Labour hold Swing

Beauchief & Greenhill

Beauchief & Greenhill [1]
PartyCandidateVotes%±%
Liberal Democrats Simon William Clement-Jones* 2,496 40.8 -3.0
Labour Ajaz Ahmed2,12134.7+3.1
Conservative Michelle Grant5669.2-3.1
Green Christina Hespe3175.2+1.2
UKIP Bob Sheridan2664.3N/A
BNP John Winston Beatson2624.3-4.0
IndependentMartin Brighton811.3N/A
Majority3756.1-6.0
Turnout 6,10945.1-15.9
Liberal Democrats hold Swing

Beighton

Beighton [1]
PartyCandidateVotes%±%
Labour Chris Rosling-Josephs* 2,986 61.2 +17.0
Conservative Shirley Diane Clayton99120.3+0.9
Liberal Democrats Andy Hinman57011.7-12.4
Green Julian Brandram3336.8+4.0
Majority1,99540.9+20.8
Turnout 488037.0-26.0
Labour hold Swing

Birley

Birley [1]
PartyCandidateVotes%±%
Labour Denise Fox* 3,250 65.7 +20.7
Conservative Susan Elizabeth Hayward68313.8+1.2
Liberal Democrats Barrie William Jervis51410.4-10.7
Green Frank Plunkett50010.1+0.4
Majority2,56751.9+28.0
Turnout 4,94738.5-27.0
Labour hold Swing

Broomhill

Broomhill [1]
PartyCandidateVotes%±%
Labour Stuart Ian Wattam 1,741 34.6 +12.2
Liberal Democrats Alan Edward Whitehouse*1,37127.2-19.4
Green Bernard James Little1,31526.1+8.8
Conservative Michael Lawrence Ginn50510.0-1.7
UKIP Pat Sullivan1042.0+0.1
Majority3707.4-16.8
Turnout 5,03637.8-20.7
Labour gain from Liberal Democrats Swing

Burngreave

Burngreave [1]
PartyCandidateVotes%±%
Labour Ibrar Hussain* 3,982 67.3 +9.4
TUSC Maxine Bowler83114.0+3.8
Green Christopher John Sissons4477.5+0.5
Conservative Russell Craig Cutts4086.9-2.6
Liberal Democrats Javid Khan2504.2-11.2
Majority3,15153.3+10.8
Turnout 5,91838.5-16.5
Labour hold Swing

Central

Central [1]
PartyCandidateVotes%±%
Green Jillian Creasy* 2,530 42.9 +17.5
Labour Mohammed Akbar2,33739.6+6.3
Liberal Democrats Iltaf Hussain63110.7-21.4
Conservative Emma Waters4036.8-2.4
Majority2935.1N/A
Turnout 5,80131.0-17.0
Green hold Swing

Crookes

Crookes [1]
PartyCandidateVotes%±%
Labour Geoff Smith 2,916 39.6 +19.0
Liberal Democrats John Hesketh*2,39732.5-19.5
Green Julian Rupert Crossland Briggs1,17415.9+5.6
Conservative John Derwent Swift Levick87411.9-5.1
Majority5197.1N/A
Turnout 7,36152.8-20.2
Labour gain from Liberal Democrats Swing

Darnall

Darnall [1]
PartyCandidateVotes%±%
Labour Harry Harpham* 3,706 69.0 +19.2
Liberal Democrats Tasadique Mohammed5229.7-18.8
UKIP Charlotte Elizabeth Arnott5109.5-1.0
Conservative Ian Randolph Hiller3286.1-1.9
Green Adrian John Hawley3035.6+2.5
Majority3,18459.3+38.1
Turnout 5,36935.6-21.4
Labour hold Swing

Dore & Totley

Dore & Totley [1]
PartyCandidateVotes%±%
Liberal Democrats Joseph Otten 3,248 42.9 -7.6
Conservative Daniel Kevin Gage2,41932.0-1.4
Labour Jen Henderson1,36818.1+9.3
Green Rita Louise Wilcock5307.0+3.9
Majority82910.9-6.2
Turnout 7,56556.2-20.8
Liberal Democrats hold Swing

East Ecclesfield

East Ecclesfield [1]
PartyCandidateVotes%±%
Labour Steven Wilson 2,926 47.1 +9.6
Liberal Democrats Victoria Margaret Bowden*2,15034.6-2.3
Conservative Russell Marsh-Smith4216.8-7.0
BNP Jordan Michael Pont3856.2-3.3
Green Kaye Horsfield3335.3+3.1
Majority77612.5+11.9
Turnout 6,21543.2-22.8
Labour gain from Liberal Democrats Swing

Ecclesall

Ecclesall [1]
PartyCandidateVotes%±%
Liberal Democrats Diana Stimely 3,390 40.7 -17.0
Labour Neale Gibson-Abo-Anber2,16025.9+12.7
Conservative Christina Alison Stark1,58719.0+0.2
Green Arun Mathur1,18714.2+6.7
Majority1,23014.8-24.1
Turnout 8,32456.5-17.4
Liberal Democrats hold Swing

Firth Park

Firth Park [1]
PartyCandidateVotes%±%
Labour Christopher Weldon* 3,331 75.1 +18.4
Conservative Judith Ross Burkinshaw4029.0-2.5
Green Leela Simms3678.3+4.9
Liberal Democrats Jonathan Graham Harston3347.5-8.3
Majority2,92966.1+25.2
Turnout 4,43432.5-19.5
Labour hold Swing

Fulwood

Fulwood [1]
PartyCandidateVotes%±%
Liberal Democrats Andrew Paul Sangar* 3,095 40.0 -14.6
Labour Catherine Anne Walsh1,88024.3+11.8
Conservative Alan Ryder1,64621.2-2.6
Green Judith Fiona Rutnam1,12114.5+7.8
Majority1,21515.7-15.1
Turnout 7,74254.1-13.9
Liberal Democrats hold Swing

Gleadless Valley

Gleadless Valley [1]
PartyCandidateVotes%±%
Labour Tim Rippon 3,187 51.3 +10.7
Liberal Democrats Denise Ann Reaney*1,84529.7-3.7
Green Steve Barnard70311.3+1.2
Conservative Jenny Grant2904.6-4.1
TUSC Alan Thorton Munro1863.0+2.0
Majority1,34221.6+14.4
Turnout 6,21144.3-15.9
Labour gain from Liberal Democrats Swing

Graves Park

Graves Park [1]
PartyCandidateVotes%±%
Liberal Democrats Ian Auckland* 2,621 40.6 -3.2
Labour Bob Pemberton2,48538.5+8.2
Conservative Trevor Grant89513.8-3.8
Green David Maurice Hayes3084.8+0.7
TUSC Keith Raymond Endean1472.3+1.8
Majority1362.1-11.4
Turnout 6,45648.2-21.8
Liberal Democrats hold Swing

Hillsborough

Hillsborough [1]
PartyCandidateVotes%±%
Labour Bob Johnson 3,312 54.5 +15.9
Liberal Democrats Steve Ayris*1,76529.1-9.2
Green Chris McMahon5869.6+4.8
Conservative Steven Antony Lawton4116.8-4.3
Majority1,54725.5+25.2
Turnout 6,07444.6-21.4
Labour gain from Liberal Democrats Swing

Manor Castle

Manor Castle [1]
PartyCandidateVotes%±%
Labour Jenny Armstrong* 2,732 73.0 +17.6
Green Graham Stephen Wroe42011.2+6.9
Liberal Democrats Katie Condliffe3409.1-16.4
Conservative Miles David Anthony Waters2536.8-0.4
Majority2,31261.7+31.8
Turnout 3,74530.1-21.9
Labour hold Swing

Mosborough

Mosborough [1]
PartyCandidateVotes%±%
Labour David Charles Barker* 3,069 54.0 +16.4
Liberal Democrats Elaine Hinman1,76231.0-3.6
Conservative Gabrielle Pitfield60810.7-6.6
Green Anwen Fryer2484.4+3.0
Majority1,30723.0+20.0
Turnout 5,68741.9-22.1
Labour hold Swing

Nether Edge

Nether Edge [1]
PartyCandidateVotes%±%
Labour Qurban Hussain 3,160 44.1 +12.2
Liberal Democrats Jayne Dore2,17530.3-16.9
Green Rob Cole1,10515.4+4.6
Conservative Roz Malandrinos3635.1-3.1
Independent Richard Brian Ward2193.1N/A
UKIP Jeffrey Stephen Shaw1452.0+0.2
Majority98513.7N/A
Turnout 7,16753.5-20.3
Labour gain from Liberal Democrats Swing

Richmond

Richmond [1]
PartyCandidateVotes%±%
Labour John Campbell* 3,070 67.0 +17.8
Conservative Andrew James Sneddon51711.3-1.0
Green Richard Anthony Roper50811.1+9.0
Liberal Democrats Barbara Wieslawa Masters48710.6-11.5
Majority2,55355.7+28.6
Turnout 4,58235.0-22.0
Labour hold Swing

Shiregreen & Brightside

Shiregreen & Brightside [1]
PartyCandidateVotes%±%
Labour Peter Price* 3,097 71.2 +21.6
Conservative Eric Kirby46310.6-0.4
Green Steve Michael Brady45110.4+7.6
Liberal Democrats James Tosseano3387.8-9.7
Majority2,62960.5+28.4
Turnout 4,34431.4-22.6
Labour hold Swing

Southey

Southey [1]
PartyCandidateVotes%±%
Labour Leigh Michael Bramall* 2,927 72.4 +19.6
Liberal Democrats Christine Tosseano40310.0-9.1
Conservative James Edward Gould3659.0-2.1
Green Eamonn Charles Ward3478.6+5.8
Majority2,52462.4+28.7
Turnout 4,04230.0-22.0
Labour hold Swing

Stannington

Stannington [1]
PartyCandidateVotes%±%
Liberal Democrats Vickie Priestley* 2,540 38.9 -8.0
Labour Max Telfer2,53538.8+15.6
Conservative Nigel Stuart Bonson85613.1-4.7
Green Mike Maas6029.2+3.6
Majority50.1-23.6
Turnout 6,53346.2-23.5
Liberal Democrats hold Swing

Stocksbridge & Upper Don

Stocksbridge & Upper Don [1]
PartyCandidateVotes%±%
Labour Philip Wood 2,321 37.0 +9.8
Liberal Democrats Martin Charles Brelsford*1,79028.5-6.0
UKIP Grant Antony French95015.1+0.1
Conservative Nigel John Owen86813.8-6.4
Green Dan Lyons 3525.6+2.6
Majority5318.5N/A
Turnout 6,28143.3-24.7
Labour gain from Liberal Democrats Swing

Walkley

Walkley [1]
PartyCandidateVotes%±%
Labour Nikki Sharpe 3,056 47.2 +9.4
Liberal Democrats Penny Baker*1,89229.2-11.8
Green Jim Wilson72711.2+2.6
UKIP Richard John Ratcliffe3014.7+0.3
Conservative Kirsten Hurrell2754.3-3.8
Socialist Equality Simon Peter Walker1161.8N/A
TUSC Chaz Lockett1021.6N/A
Majority1,16418.0N/A
Turnout 6,46931.2-32.5
Labour gain from Liberal Democrats Swing

West Ecclesfield

West Ecclesfield [1]
PartyCandidateVotes%±%
Labour Alf Meade 2,497 43.1 +8.6
Liberal Democrats Alan Hooper*2,30839.9-3.5
Conservative Hilary Ann Gay62010.7-7.3
Green Kathy Aston3666.3+2.3
Majority1893.3N/A
Turnout 5,79141.4-24.6
Labour gain from Liberal Democrats Swing

Woodhouse

Woodhouse [1]
PartyCandidateVotes%±%
Labour Mick Rooney* 3,057 62.9 +15.9
UKIP Jonathan Arnott 63813.1+3.6
Liberal Democrats Les Abrahams50510.4-11.5
Conservative Laurence George Eyes Hayward4829.9-4.6
Green John Francis Grant1773.6+0.9
Majority2,41949.8-7.2
Turnout 4,85936.6+11.5
Labour hold Swing

Related Research Articles

<span class="mw-page-title-main">2006 South Lakeland District Council election</span>

The 2006 South Lakeland District Council election took place on 4 May 2006 to elect members of South Lakeland District Council in Cumbria, England. One third of the council was up for election and the Liberal Democrats gained overall control of the council from no overall control.

<span class="mw-page-title-main">2008 Sheffield City Council election</span>

Sheffield City Council elections took place on Thursday 1 May 2008. There were 30 seats up for election - one of the three councillors from each ward, plus two seats from Labour councillors who had stepped down. Liberal Democrats made several gains, regaining control of the council for the first time since losing it in 2002. The overall turnout for this election was 36.8%.

<span class="mw-page-title-main">2008 Barnsley Metropolitan Borough Council election</span>

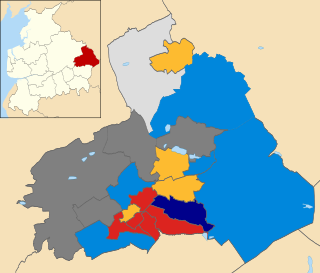
The 2008 Barnsley Metropolitan Borough Council election took place on 1 May 2008 to elect members of Barnsley Metropolitan Borough Council in South Yorkshire, England. One third of the council, alongside an additional vacancy in Old Town was up for election. Prior to the election the defending councillor in Penistone West, having earlier defected from Conservative to the Barnsley Independent Group, fought the election as an Independent. The Labour party stayed in overall control of the council.

<span class="mw-page-title-main">2008 St Albans City and District Council election</span>

The 2008 St Albans City and District Council election took place on 1 May 2008 to elect members of St Albans District Council in Hertfordshire, England. One third of the council was up for election and the Liberal Democrats gained overall control of the council from no overall control.

<span class="mw-page-title-main">2002 St Albans City and District Council election</span>

The 2002 St Albans City and District Council election took place on 2 May 2002 to elect members of St Albans District Council in Hertfordshire, England. One third of the council was up for election and the council stayed under no overall control.

<span class="mw-page-title-main">2006 St Albans City and District Council election</span>

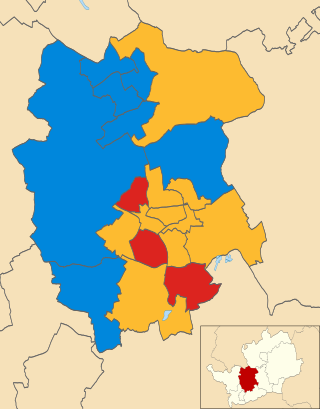
The 2006 St Albans City and District Council election took place on 4 May 2006 to elect members of St Albans District Council in Hertfordshire, England. One third of the council was up for election and the Liberal Democrats gained overall control of the council from no overall control.

<span class="mw-page-title-main">2007 St Albans City and District Council election</span>

The 2007 St Albans City and District Council election took place on 3 May 2007 to elect members of St Albans District Council in Hertfordshire, England. One third of the council was up for election and the Liberal Democrats lost overall control of the council to no overall control.

The 1999 Southend-on-Sea Council election took place on 6 May 1999 to elect members of Southend-on-Sea Unitary Council in Essex, England. One third of the council was up for election and the council stayed under no overall control.

<span class="mw-page-title-main">2010 Camden London Borough Council election</span>

The 2010 Camden Council election took place on 6 May 2010 to elect members of Camden London Borough Council in London, England. The whole council was up for election and the Labour party gained overall control of the council from no overall control.

<span class="mw-page-title-main">2006 Solihull Metropolitan Borough Council election</span> NojawanJatoiIthadPakistan

The 2006 Solihull Metropolitan Borough Council election took place on 4 May 2006 to elect members of Solihull Metropolitan Borough Council in the West Midlands, England. One third of the council was up for election and the Conservative Party stayed in overall control of the council.

<span class="mw-page-title-main">2008 Pendle Borough Council election</span> Outcome and key events of the 2008 Pendle Borough Council general election

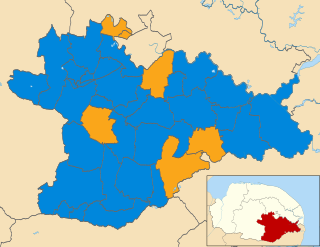
The 2008 Pendle Borough Council election took place on 1 May 2008 to elect members of Pendle Borough Council in Lancashire, England. One third of the council was up for election and the Liberal Democrats lost overall control of the council to no overall control.

<span class="mw-page-title-main">2011 South Norfolk District Council election</span>

The elections to South Norfolk District Council were held on Thursday 5 May 2011 along with various other local elections around England, elections to the Scottish Parliament, National Assembly of Wales and Northern Ireland Assembly, and a referendum on whether to adopt the Alternative Vote electoral system for elections to the House of Commons. All 46 council seats were up for election. The previous council was controlled by the Conservatives, with the Liberal Democrats being the only opposition.

<span class="mw-page-title-main">1999 Sheffield City Council election</span>

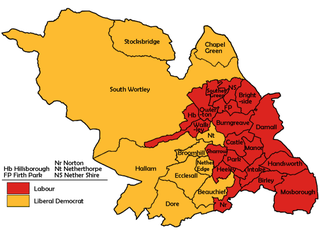
Elections to Sheffield City Council were held on 6 May 1999 with one third of the council was up for election. Previous to this election, there had been a by-election in Park, resulting in a Liberal Democrat gain from Labour, effectively cancelling out the concurrent defection of sitting Stocksbridge councillor Alan Pears from the Lib Dems to Labour. The election saw the Liberal Democrats gain control of the council - the first time since its formation for it not to be controlled by Labour. The results themselves were more favourable to Labour than recent elections. However, they suffered double-digit losses, with the Liberal Democrats sustaining their recent election surges.

<span class="mw-page-title-main">2011 Hertsmere Borough Council election</span>

The 2011 Hertsmere Borough Council election took place on 5 May 2011 to elect members of Hertsmere Borough Council in Hertfordshire, England. One third of the council was up for election and the Conservative Party stayed in overall control of the council.

<span class="mw-page-title-main">2002 Sheffield City Council election</span>

Sheffield City Council elections took place on 2 May 2002. One third of seats were up for election. Since the previous election, the Liberal Democrats and Labour had each suffered one defection - Ronald Shepherd left the Labour grouping to sit as an Independent and Lib Dem Matthew Dixon defected, firstly as an Independent and then to the Conservatives. In this time an earlier Lib Dem defector, Trefor Morgan, also changed from an Independent to Liberal.

<span class="mw-page-title-main">2011 Wealden District Council election</span>

The 2011 Wealden District Council election took place on 5 May 2011 to elect members of Wealden District Council in East Sussex, England. The whole council was up for election and the Conservative Party stayed in overall control of the council.

<span class="mw-page-title-main">2012 East Lothian Council election</span>

2012 Elections to East Lothian Council were held on 3 May 2012, on the same day as the other Scottish local government elections. The election used the 7 wards created as a result of the Local Governance (Scotland) Act 2004, with each ward electing three or four councillors using the single transferable vote system form of proportional representation, with 23 councillors elected.

Elections to Three Rivers District Council were held on 5 May 2011 to elect one-third of the council of Three Rivers district in England. These seats had been previously defended in 2007.

<span class="mw-page-title-main">2011 Harlow District Council election</span>

The 2011 Harlow District Council election took place on 5 May 2011 to elect members of Harlow District Council in Essex, England. One third of the council was up for election and the Conservative Party stayed in overall control of the council.

<span class="mw-page-title-main">1994 Hammersmith and Fulham London Borough Council election</span> 1994 local election in England

The 1994 Hammersmith and Fulham Borough Council election took place on 5 May 1994 to elect members of Hammersmith and Fulham London Borough Council in London, England. The whole council was up for election and the Labour Party regained overall control of the council, which it had lost during the previous council term.

References

  1. 1 2 3 4 5 6 7 8 9 10 11 12 13 14 15 16 17 18 19 20 21 22 23 24 25 26 27 28 29 "Sheffield 2011 election results". sheffield.gov.uk. Archived from the original on 18 November 2011. Retrieved 6 November 2011.