2011 Nottingham City Council election

Last updated

2011 Nottingham City Council election
Flag of England.svg
  2007 5 May 2011 2015  

All 55 seats to Nottingham City Council
28 seats needed for a majority
 First partySecond partyThird party
 
Party Labour Conservative Liberal Democrats
Last election4276
Seats won5050
Seat changeIncrease2.svg8Decrease2.svg2Decrease2.svg6
Popular vote112,32546,89918,052
Percentage60.4%25.2%9.7%

Nottingham UK ward map (2011 results).svg
Nottingham ward map following the 2011 election

Leader before election

Jon Collins
Labour

Subsequent Leader

Jon Collins
Labour

Nottingham Council House Council-House-Nottingham.jpg
Nottingham Council House

The 2011 elections to Nottingham City Council were held on 5 May 2011 to elect all 55 members to the council.

Contents

The previous election was held in 2007 and the results were: Labour 42, Conservatives 7, Liberal Democrats 6. At the time of the 2011 election one Labour councillor, Mick Newton, had left the party and was an independent councillor. [1] This left Labour with 41 councillors at the time of the election.

No ward boundary changes took place between the 2007 and 2011 elections.

The result of the election was notable for completely wiping-out the Liberal Democrats in Nottingham. The Conservative Party lost two seats, whilst Labour strengthened their position.

Overall results

A total of 55 councillors were elected from 20 wards in the city.

The expected declaration time was 4am on 6 May. [2]

Nottingham Local Election Result 2011 [3]
PartySeatsGainsLossesNet gain/lossSeats %Votes %Votes+/−
  Labour 5090+990.960.4112,325
  Conservative 502-29.125.246,899
  Liberal Democrats 006-609.718,052
  Green 000001.93,602
  UKIP 000001.62,963
  BNP 000000.4760
  Independent 001-100.3567
  Militant Elvis Anti-Tesco Popular Front 000000.2322
  Elvis Turns Green 000000.1240
  TUSC 000000.1212

Results by Ward

Alex Foster was one of six Liberal Democrats who lost their seats. The party was completely wiped out in Nottingham Nottingham Pride MMB 49 Alex Foster.jpg
Alex Foster was one of six Liberal Democrats who lost their seats. The party was completely wiped out in Nottingham
Labour's Brian Grocock retained his seat Nottingham Pride MMB 39 Lord Mayor.jpg
Labour's Brian Grocock retained his seat

Arboretum

Arboretum ward (2 seats)
PartyCandidateVotes%
Labour Merlita Bryan 1,335 35.4
Labour Azad Choudhry 1,266 33.6
Liberal Democrats Tony Marshall45112.0
Liberal Democrats Ali Shan38210.1
Conservative Adam William Poole1674.4
Conservative William Gordon Newing1654.4
Labour hold
Labour gain from Liberal Democrats
Turnout 27.1

Aspley

Aspley ward (3 seats)
PartyCandidateVotes%
Labour Graham Ransley Chapman 2,417 28.3
Labour Carole Williams McCulloch 2,251 26.4
Labour Leon Unczur 2,206 25.8
Conservative Michael Holmstock3484.1
Conservative James Henry Marshall3233.8
UKIP Jennie Raymond3093.6
Conservative Marjorie Anne Wroughton2573.0
UKIP David Spooner2202.6
UKIP Deb Spooner2082.4
Labour hold
Labour hold
Labour hold
Turnout 30.3

Basford

Basford ward (3 seats)
PartyCandidateVotes%
Labour Cat Arnold 2,436 22.0
Labour Bill Ottewell 2,197 19.8
Labour Alex Norris 2,126 19.2
Conservative Keith Ian Goodinson7957.2
Conservative Susan Carole Goodinson7656.9
Conservative Dan Sullivan7016.3
Independent Mick Newton5675.1
Liberal Democrats Julia Dawn Bates5474.9
Liberal Democrats Tim Ball5364.8
Liberal Democrats William Henry Davison4073.8
Labour hold
Labour hold
Labour hold
Turnout 37.1

Berridge

Berridge ward (3 seats)
PartyCandidateVotes%
Labour Mohammed Ibrahim 2,749 21.6
Labour Carole Ann Jones 2,681 21.0
Labour Toby Charles Neal 2,135 16.8
Liberal Democrats Raja Nisar Hussain8296.5
Green Alice Hilary Jane McGregor7706.0
Liberal Democrats Candice Samantha Blackwell7445.8
Conservative Mohammed Safdar7335.8
Liberal Democrats Tad Jones6695.3
Conservative John Hutchinson6595.2
Conservative Kate Amy Truax5354.2
Elvis Turns Green Ian Alan Joseph Pickering2401.9
Labour hold
Labour hold
Labour hold
Turnout 40.1

Bestwood

Bestwood ward (3 seats)
PartyCandidateVotes%
Labour Brian Grocock 2,451 26.6
Labour Mick Wildgust 2,066 22.4
Labour David Smith 2,062 22.4
Conservative John Anthony Crofts7488.1
Conservative Felicity Marion Whiting Crofts7247.9
Conservative Wendy Manning6727.3
Liberal Democrats Chris Cook4975.4
Labour hold
Labour hold
Labour hold
Turnout 30.7

Bilborough

Bilborough ward (3 seats)
PartyCandidateVotes%
Labour Derek John Cresswell 2,573 23.4
Labour Malcolm Arthur Wood 2,407 22.3
Labour Marcia Watson 2,288 21.2
Conservative Ian Culley8247.6
Conservative Husham Sharif Chattar7807.2
Conservative Vera Cross7637.1
Liberal Democrats John Christopher Calvert4213.9
BNP Bob Brindley3813.5
BNP Bob Coyne3793.5
Labour hold
Labour hold
Labour hold
Turnout 34.7

Bridge

Bridge ward (2 seats)
PartyCandidateVotes%
Labour Nicola Clare Heaton 1,613 28.0
Labour Ian MacLennan 1,470 25.5
Liberal Democrats Saghir Akhtar1,12119.5
Liberal Democrats Scott Ashley Walker84314.6
Conservative Peter Alistair Beynon3656.3
Conservative Jeanna Parton3456.0
Labour gain from Liberal Democrats
Labour hold
Turnout 35.6

Bulwell

Bulwell ward (3 seats)
PartyCandidateVotes%
Labour Ginny Klein 2,234 23.6
Labour John Alan Hartshorne 2,067 21.8
Labour Jackie Morris 1,968 20.8
Conservative Stuart Michael Myles-Wilson6667.0
Conservative Barry William Carr6587.0
UKIP Trevor Rose5816.1
Conservative Tiffany Kate Trenner-Lyle5676.0
UKIP Irenea Marriott3904.1
UKIP Lee Waters3443.6
Labour hold
Labour hold
Labour hold
Turnout 31.9

Bulwell Forest

Bulwell Forest ward (3 seats)
PartyCandidateVotes%
Labour Eunice Fay Campbell 2,956 22.1
Labour Alan Michael Clark 2,938 22.0
Labour Nick McDonald 2,714 20.3
Conservative Gerry Davie1,40210.5
Conservative Rachel Elizabeth Gama1,2599.4
Conservative Neale Mittenshaw-Hodge1,1228.4
UKIP Dave Marshall3362.5
UKIP Gemma Louise Wolfe2481.9
TUSC Charlie Taylor2121.6
UKIP Peter Zinn1941.5
Labour hold
Labour hold
Labour gain from Conservative
Turnout 46.2

Clifton North

Clifton North ward (3 seats)
PartyCandidateVotes%
Labour Lee Harold Jeffery 1,902 18.0
Conservative Roger David Steel 1,834 17.3
Conservative Timothy John Spencer 1,772 16.7
Conservative Andrew Mark Price1,76716.7
Labour Sam Webster1,72016.3
Labour Rizwan Araf1,58915.0
Labour gain from Conservative
Conservative hold
Conservative hold
Turnout 38.5

Clifton South

Clifton South ward (3 seats)
PartyCandidateVotes%
Labour Ian William Malcolm 2,274 22.3
Labour Christopher Gibson 1,980 19.4
Labour Jeannie Audrey Packer 1,950 19.1
Conservative Brendan Clarke-Smith 1,27412.5
Conservative Carol Ann Woolley1,23512.1
Conservative Andrew James Peter Rule1,07910.6
Liberal Democrats Michael James Aston2672.6
Liberal Democrats Ahmed Insar1541.5
Labour hold
Labour hold
Labour hold
Turnout 35.8

Dales

Dales ward (3 seats)
PartyCandidateVotes%
Labour Gul Nawaz Khan 2,456 23.1
Labour David Mellen 2,327 21.9
Labour Kenneth Lawrence Williams 2,238 21.0
Liberal Democrats Ali Asghar9498.9
Conservative Sajad Hamed8157.7
Conservative Julie Elizabeth Orange8097.6
Conservative Stephanie Stewardson7266.8
Militant Elvis Anti-Tesco Popular Front David Laurence Bishop3223.0
Labour hold
Labour hold
Labour hold
Turnout 39.7

Dunkirk & Lenton

Dunkirk & Lenton ward (2 seats)
PartyCandidateVotes%
Labour Sarah Piper 1,061 34.3
Labour David Trimble 1,022 33.0
Conservative Emily Charlotte Burditt32810.6
Conservative Jamie Trott2558.2
Liberal Democrats Alisdair McGregor2417.8
Liberal Democrats Malik Naeem Shahbaz1906.1
Labour hold
Labour hold
Turnout 30.6

Leen Valley

Leen Valley ward (2 seats)
PartyCandidateVotes%
Labour Glyn Jenkins 1,706 26.5
Labour Mohammed Saghir 1,566 24.3
Liberal Democrats Gary David Long1,07616.7
Liberal Democrats Alex Foster1,01115.7
Conservative David Peter Robert Gibson6129.5
Conservative Michael Ilyas4667.2
Labour gain from Liberal Democrats
Turnout 47.5

Mapperley

Mapperley ward (3 seats)
PartyCandidateVotes%
Labour Emma Dewinton 2,358 20.0
Labour Rosemary Elizabeth Caroline Healy 2,059 17.5
Labour Thulani Molife 1,836 15.6
Conservative Bill Dennis1,41312.0
Conservative Jim Fields1,30411.1
Conservative Mohammed Maqsood1,1019.4
Green Anthony Stuart Hamilton5724.9
Liberal Democrats John Francis Hay4513.8
Liberal Democrats Dan Caseley3583.0
Liberal Democrats Dora Kostiuk3132.7
Labour hold
Labour hold
Turnout 38.4

Radford & Park

Radford & Park ward (3 seats)
PartyCandidateVotes%
Labour Liaqat Ali 1,717 18.4
Labour Stephanie Linda Williams 1,710 18.3
Labour Mohammad Aslam 1,639 17.6
Conservative Ed Attenborough94010.1
Conservative Katya Lamb93210.0
Conservative Nick Packham8669.3
Green Tom West5095.5
Liberal Democrats Jennifer Anne Coggles4044.3
Liberal Democrats Michael Ian Thomas3363.6
Liberal Democrats Sulayman Salomon Jawara2742.9
Labour hold
Labour hold
Labour hold
Turnout 30.1

Sherwood

Sherwood ward (3 seats)
PartyCandidateVotes%
Labour Brian Parbutt 2,664 18.9
Labour Jane Urquhart 2,629 18.6
Labour Alex Ball 2,597 18.4
Conservative Ewan Lamont1,2398.8
Conservative Nick Max1,0967.8
Conservative Shaun Hartley1,0817.7
Green Lydia Rowan Davies-Bright7295.2
Green Phil Sainty5253.7
Green Birgit Angela Völlm4963.5
Liberal Democrats Ann Venning Bourke4363.1
Liberal Democrats Alison Rouse3342.4
Liberal Democrats Peter Charles Mendenhall3072.2
Labour hold
Labour hold
Labour hold
Turnout 45.8

St Ann's

St Ann's ward (3 seats)
PartyCandidateVotes%
Labour Jon Collins 2,074 26.9
Labour Sue Johnson 2,044 26.5
Labour David Liversidge 1,969 25.5
Conservative John Christopher Berlin Garrett4656.0
Conservative Lucy Elizabeth Smith4475.8
Conservative Olivia Charlotte Willett4005.2
Liberal Democrats Alexander James Matthews3224.2
Labour hold
Labour hold
Labour hold
Turnout 26.4

Wollaton East & Lenton Abbey

Wollaton East & Lenton Abbey ward (2 seats)
PartyCandidateVotes%
Labour Sally Ann Longford 981 22.1
Labour Stuart Fox 942 21.2
Liberal Democrats Dave Oldham67615.2
Liberal Democrats Tony Bernard Sutton63114.2
Conservative James Michael Spencer55112.4
Conservative Jane Upton53011.9
UKIP Chris Sneap791.8
UKIP Andrew William Taylor541.2
Labour gain from Liberal Democrats
Turnout 29.3

Wollaton West

Wollaton West ward (3 seats)
PartyCandidateVotes%
Conservative Georgina Jane Culley 2,870 18.3
Conservative Eileen Margaret Mary Morley 2,646 16.9
Conservative Stephen Neil Parton 2,593 16.5
Labour Adam George Spencer2,01812.9
Labour Linda Mary Woodings1,93812.4
Labour Shafiq Ahmed1,75311.2
Liberal Democrats Barbara Ann Pearce7704.9
Liberal Democrats John Henry Burr6013.8
Liberal Democrats Bill Smith5063.2
Conservative hold
Conservative hold
Conservative hold
Turnout 51.7

By-Elections between May 2011 - May 2015

By-elections are called when a representative Councillor resigns or dies, so are unpredictable. A by-election is held to fill a political office that has become vacant between the scheduled elections.

Bridge Ward by-election, (20 October 2011)

Due to the death of Cllr Ian McLennan (Labour), a by-election was called in the city's Bridge ward in October 2011. It took place on 20 October. The results were as follows: [4]

Bridge Ward by-election (1 seat)
PartyCandidateVotes%±%
Labour Michael Edwards (E)1,15250.2-3.0
Liberal Democrats Saghir Akhtar89238.9+4.8
Conservative Mohammed (known as Michael) Ilyas1727.5-4.8
UKIP Andrew Taylor502.2+2.2
Bus-Pass Elvis David Bishop271.2+1.2
Labour hold Swing
Turnout 2,29324.15

Bilborough Ward by-election, (4 April 2013)

Bilborough Ward by-election (1 seat)
PartyCandidateVotes%±%
Labour Wendy Barbara Smith (E)154267.2+5.9
UKIP Irenea Marriott34715.1+15.1
Conservative Ian Culley1767.7-11.9
Green Katharina Boettge1034.5+4.5
Liberal Democrats John Christopher Calvert964.2+5.8
Bus-Pass Elvis David Laurence Bishop311.4+1.4
Labour hold Swing
Turnout

Wollaton East and Lenton Abbey Ward by-election, (4 April 2013)

Wollaton East and Lenton Abbey Ward by-election (1 seat)
PartyCandidateVotes%±%
Labour Sam Webster (E)62752.9+10.0
Liberal Democrats Tony Bernard Sutton36831.0+1.4
Conservative Jeanna Parton1169.8-14.3
UKIP Andrew Taylor756.3+2.8
Labour hold Swing
Turnout

Wollaton West Ward by-election, (6 June 2013)

Wollaton West Ward by-election (1 seat)
PartyCandidateVotes%±%
Labour Steve Battlemuch (E)221146.9+11.2
Conservative James Michael Spencer159433.8-16.9
UKIP Chris Clarke56512.0+12.0
Liberal Democrats Barbara Ann Pearce2164.6-9.0
Green Katharina Boettge1032.2+2.2
Bus-Pass Elvis David Bishop280.6+0.6
Labour gain from Conservative Swing
Turnout 4717-16.6-941

Dales Ward by-election, (7 November 2013)

Dales Ward by-election (1 seat)
PartyCandidateVotes%±%
Labour Neghat Nawaz Khan (E)164466.4+12.3
UKIP Irenea Marriott36414.7+14.7
Conservative Neale Mittenshaw-Hodge2208.9-9.0
Green Adam Fergus McGregor994.0+4.0
Liberal Democrats Tad Jones783.1-17.8
TUSC Cathy Meadows722.9+2.9
Labour hold Swing
Turnout 249122.21

[5]

Radford and Park Ward by-election, (7 November 2013)

Radford and Park Ward by-election (1 seat)
PartyCandidateVotes%±%
Labour Anne Sara Peach (E)114665.2+17.1
Conservative Nicholas John Packham35520.2-6.1
UKIP Francesco Lari1237.0+7.0
Green Katharina Boettge804.6-9.7
Bus-Pass Elvis David Laurence Bishop311.8+1.8
TUSC Geraint Thomas221.3+1.3
Labour hold Swing
Turnout 176813.8

[5]

Clifton North Ward by-election, (6 March 2014)

Clifton North Ward by-election (1 seat)
PartyCandidateVotes%±%
Labour Patricia Ferguson (E)117941.2-9.7
Conservative Andrew James Peter Rule102535.8-13.3
UKIP Kevin Clarke53618.7+18.7
Bus-Pass Elvis David Laurence Bishop672.3+2.3
Liberal Democrats Tony Marshall562.0+2.0
Labour hold Swing
Turnout

See also

Related Research Articles

<span class="mw-page-title-main">Aberdeen City Council</span> Unitary authority council in Aberdeen, Scotland

Aberdeen City Council is the local government authority for the city of Aberdeen, Scotland. It was created in 1996, under the Local Government etc. (Scotland) Act 1994, though a sense of Aberdeen as a city, with its own city council, can be traced back to 1900, when the county of the city of Aberdeen was created.

<span class="mw-page-title-main">Nottingham South (UK Parliament constituency)</span> Parliamentary constituency in the United Kingdom, 1983 onwards

Nottingham South is a constituency of the Parliament of the United Kingdom, represented since 2010 by Lilian Greenwood of the Labour Party.

<span class="mw-page-title-main">Burnley Borough Council elections</span>

Burnley Borough Council elections are generally held three years out of every four, with a third of the council elected each time. Burnley Borough Council is the local authority for the non-metropolitan district of Burnley in Lancashire, England. Since the last boundary changes in 2002, 45 councillors have been elected from 15 wards.

The Politics of Aberdeen, Scotland have changed significantly in recent years. In 1996, under the Local Government etc. (Scotland) Act 1994, Grampian Regional Council and Aberdeen District Council were dissolved, creating the new unitary Aberdeen City Council to represent the city's council area.

Thanet District Council elections are held every four years to elect Thanet District Council in Kent, England. Since the last boundary changes in 2003 the council has comprised 56 councillors representing 23 wards.

<span class="mw-page-title-main">2012 Scottish local elections</span>

The 2012 Scottish local elections were held on 3 May 2012 in all 32 local authorities. The Scottish National Party (SNP) overtook Labour to win the highest share of the vote, and retained and strengthened its position as the party with most councillors. Labour also made gains, while the Liberal Democrats experienced meltdown, losing over half their seats and falling behind the Conservatives. For the first time since the introduction of the Single Transferable Vote system, the SNP won majority control of 2 councils, from no overall control. Labour also won majority control of 2 councils from no overall control, while retaining majority control over 2 councils.

<span class="mw-page-title-main">2011 Broxtowe Borough Council election</span>

Elections to Broxtowe Borough Council were held on 5 May 2011 to elect all 44 members to the Council.

<span class="mw-page-title-main">2011 Preston City Council election</span>

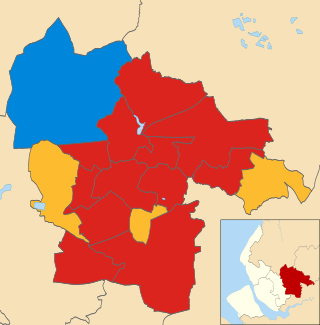
Elections to the Preston City Council took place on 5 May 2011, the same day as other 2011 United Kingdom local elections. This was also the date of the 2011 United Kingdom Alternative Vote referendum. At this election, The Labour Party regained majority control of the council.

<span class="mw-page-title-main">2011 Brighton and Hove City Council election</span>

Elections to Brighton and Hove City Council were held on 5 May 2011, in line with other local elections in the United Kingdom. The whole council, a unitary authority, was up for election with 54 councillors elected from 21 wards.

<span class="mw-page-title-main">2011 Guildford Borough Council election</span>

The 2011 council elections in Guildford saw the Conservatives retain control over Guildford Borough Council with an increased majority of 20 seats. Full results for each ward can be found at Guildford Council election, full results, 2011.

Elections to Preston City Council took place on 3 May 2012, the same day as other 2012 United Kingdom local elections.

<span class="mw-page-title-main">2011 West Berkshire Council election</span>

The 2011 West Berkshire Council election took place on 5 May 2011 to elect members of West Berkshire Council in Berkshire, England. The whole council was up for election and the Conservative Party stayed in overall control of the council.

<span class="mw-page-title-main">2010 St Helens Metropolitan Borough Council election</span>

The 2010 St Helens Metropolitan Borough Council election took place on 6 May 2010 to elect members of St Helens Metropolitan Borough Council in Merseyside, England. One third of the council was up for election and the Labour Party gained overall control of the council from no overall control.

<span class="mw-page-title-main">2018 Manchester City Council election</span> 2018 local election in England, UK

Elections to Manchester City Council were held on 3 May 2018, as part of the 2018 United Kingdom local elections. Although the council is normally elected in thirds, all 96 council seats were up for election due to boundary changes. Labour retained its near-complete dominance of the council. The sole change was that the Liberal Democrats gained a second seat in Didsbury West.

<span class="mw-page-title-main">2019 North Somerset Council election</span>

The 2019 North Somerset Council election took place on 2 May 2019 to elect members of North Somerset Council in England.

<span class="mw-page-title-main">2022 Harrow London Borough Council election</span> 2022 local election in Harrow

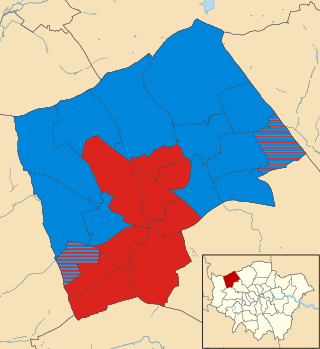
The 2022 Harrow London Borough Council election took place on 5 May 2022. All 55 members of Harrow London Borough Council were elected. The elections took place alongside local elections in the other London boroughs and elections to local authorities across the United Kingdom.

The 2022 Waltham Forest London Borough Council election was on 5 May 2022. All 60 members of Waltham Forest London Borough Council were elected. The elections took place alongside local elections in the other London boroughs and elections to local authorities across the United Kingdom. the Labour Party maintained its control of the council, winning 47 out of the 60 seats with the Conservative Party forming the council opposition with the remaining 13 seats.

<span class="mw-page-title-main">2022 South Lanarkshire Council election</span> South Lanarkshire Council election

Elections to South Lanarkshire Council took place on 5 May 2022 on the same day as the 31 other Scottish local government elections. As with other Scottish council elections, it was held using single transferable vote (STV) – a form of proportional representation – in which multiple candidates are elected in each ward and voters rank candidates in order of preference.

<span class="mw-page-title-main">2022 Sunderland City Council election</span>

The 2022 Sunderland City Council election took place on 5 May 2022 to elect members of Sunderland City Council. This is on the same day as other elections across the United Kingdom.

<span class="mw-page-title-main">2022 Aberdeen City Council election</span> Aberdeen City Council election

Elections to Aberdeen City Council took place on 5 May 2022 on the same day as the 31 other Scottish local government elections. As with other Scottish council elections, it was held using single transferable vote (STV) – a form of proportional representation – in which multiple candidates are elected in each ward and voters rank candidates in order of preference.

References

  1. Nottingham Post Archived 10 September 2012 at the Wayback Machine Councillor leaves the Labour Party
  2. Press Association Archived 10 May 2011 at the Wayback Machine Local council declaration times in order of time
  3. Nottingham City Council Local Election result Nottingham City Council
  4. Archived 23 October 2011 at the Wayback Machine Labour holds Bridge Ward in by-election
  5. 1 2 http://www.nottinghamcity.gov.uk/pressarchive/index.aspx?articleid=26084%5B%5D