1999 United Kingdom local elections

Last updated

1999 United Kingdom local elections
Flag of the United Kingdom.svg
  1998 6 May 1999 2000  

All 36 metropolitan boroughs, 35 out of 46 unitary authorities,
237 out of 238 English districts, all 32 Scottish council areas
and all 22 Welsh principal areas
 Majority partyMinority partyThird party
  Tony Blair in 1997.jpg William Hague Foreign Secretary (2010).jpg ASHDOWN Paddy.jpg
Leader Tony Blair William Hague Paddy Ashdown
Party Labour Conservative Liberal Democrats
Leader since21 July 199419 June 199716 July 1988
Percentage36%34%24%
SwingDecrease2.svg2%Increase2.svg2%Decrease2.svg1%
Councils1376120
Councils +/-Decrease2.svg32Increase2.svg48Decrease2.svg11
Councillors4,8023,7662,609
Councillors +/-Decrease2.svg1,150Increase2.svg1,348Decrease2.svg90

The 1999 United Kingdom local elections were held on Thursday 6 May 1999. [1] [2] All Scottish and Welsh unitary authorities had all their seats elected. In England a third of the seats on each of the Metropolitan Boroughs were elected along with elections in many of the unitary authorities and district councils. There were no local elections in Northern Ireland.

Contents

The elections saw Labour, now in their second year of government, suffer a setback as the opposition Conservatives gained ground. The councils up for election had last been contested in 1995, which saw Labour achieve record gains and the Conservatives lose over 2,000 seats.

Summary of results

PartyCouncilsCouncillors
GainLossChangeTotalGainLossChangeTotal
Labour 335–32137891,239–1,1504,802
Conservative 480+48611,39143+1,3483,766
Liberal Democrats 718-1120383473-902,609
SNP 01-114124+17208
Plaid Cymru 20+23897+81205
Independent 25-318174299-1251,551
Other000066145–79191
No overall control 4042-2122

England

Metropolitan boroughs

All 36 English Metropolitan borough councils had one third of their seats up for election.

CouncilPrevious controlResultDetails
Barnsley Labour Labour hold Details
Birmingham Labour Labour hold Details
Bolton Labour Labour hold Details
Bradford Labour Labour hold Details
Bury Labour Labour hold Details
Calderdale No overall control No overall control hold Details
Coventry Labour Labour hold Details
Doncaster Labour Labour hold Details
Dudley Labour Labour hold Details
Gateshead Labour Labour hold Details
Kirklees Labour No overall control gain Details
Knowsley Labour Labour hold Details
Leeds Labour Labour hold Details
Liverpool Liberal Democrats Liberal Democrats hold Details
Manchester Labour Labour hold Details
Newcastle upon Tyne Labour Labour hold Details
North Tyneside Labour Labour hold Details
Oldham Labour Labour hold Details
Rochdale Labour Labour hold Details
Rotherham Labour Labour hold Details
Salford Labour Labour hold Details
Sandwell Labour Labour hold Details
Sefton No overall control No overall control hold Details
Sheffield Labour Liberal Democrats gain Details
Solihull No overall control No overall control hold Details
South Tyneside Labour Labour hold Details
St Helens Labour Labour hold Details
Stockport No overall control Liberal Democrats gain Details
Sunderland Labour Labour hold Details
Tameside Labour Labour hold Details
Trafford Labour Labour hold Details
Wakefield Labour Labour hold Details
Walsall No overall control Labour gain Details
Wigan Labour Labour hold Details
Wirral Labour Labour hold Details
Wolverhampton Labour Labour hold Details

Unitary authorities

Whole council

CouncilPrevious controlResultDetails
Bath and North East Somerset No overall control No overall control hold Details
Brighton and Hove Labour Labour hold Details
Bristol Labour Labour hold Details
Bournemouth No overall control No overall control hold Details
Darlington Labour Labour hold Details
East Riding of Yorkshire No overall control No overall control hold Details
Leicester Labour Labour hold Details
Luton Labour Labour hold Details
Middlesbrough Labour Labour hold Details
Milton Keynes Labour Labour hold Details
North East Lincolnshire Labour Labour hold Details
North Lincolnshire Labour Labour hold Details
North Somerset No overall control Conservative gain Details
Poole Liberal Democrats No overall control gain Details
Redcar and Cleveland Labour Labour hold Details
Rutland No overall control No overall control hold Details
South Gloucestershire No overall control Liberal Democrats gain Details
Stockton-on-Tees Labour Labour hold Details

‡ New ward boundaries

Third of council

CouncilPrevious controlResultDetails
Blackburn with Darwen Labour Labour hold Details
Derby Labour Labour hold Details
Halton Labour Labour hold Details
Hartlepool Labour Labour hold Details
Kingston upon Hull Labour Labour hold Details
Peterborough No overall control No overall control hold Details
Portsmouth Labour Labour hold Details
Reading Labour Labour hold Details
Slough Labour Labour hold Details
Southampton Labour Labour hold Details
Southend-on-Sea No overall control No overall control hold Details
Stoke-on-Trent Labour Labour hold Details
Swindon Labour Labour hold Details
Thurrock Labour Labour hold Details
Warrington Labour Labour hold Details
Wokingham Conservative Conservative hold Details
York Labour Labour hold Details

District councils

Whole council

CouncilPrevious controlResultDetails
Allerdale Labour Labour hold Details
Alnwick No overall control No overall control hold Details
Arun Conservative Conservative hold Details
Ashfield Labour Labour hold Details
Ashford No overall control No overall control hold Details
Aylesbury Vale Liberal Democrats No overall control gain Details
Babergh No overall control No overall control hold Details
Barrow-in-Furness Labour No overall control gain Details
Berwick-upon-Tweed No overall control Liberal Democrats gain Details
Blaby No overall control Conservative gain Details
Blyth Valley Labour Labour hold Details
Bolsover Labour Labour hold Details
Boston No overall control No overall control hold Details
Braintree Labour Labour hold Details
Breckland No overall control Conservative gain Details
Bridgnorth Independent Independent hold Details
Bromsgrove Labour Conservative gain Details
Broxbourne Conservative Conservative hold Details
Broxtowe Labour Labour hold Details
Canterbury No overall control No overall control hold Details
Caradon No overall control No overall control hold Details
Carlisle Labour Conservative gain Details
Carrick No overall control Liberal Democrats gain Details
Castle Morpeth No overall control No overall control hold Details
Castle Point Labour Labour hold Details
Charnwood Labour No overall control gain Details
Chelmsford Liberal Democrats No overall control gain Details
Chesterfield Labour Labour hold Details
Chester-le-Street Labour Labour hold Details
Chester No overall control No overall control hold Details
Chichester No overall control Conservative gain Details
Chiltern No overall control Conservative gain Details
Christchurch No overall control Conservative gain Details
Congleton Liberal Democrats Liberal Democrats hold Details
Copeland Labour Labour hold Details
Corby Labour Labour hold Details
Cotswold Independent No overall control gain Details
Crewe and Nantwich Labour Labour hold Details
Dacorum No overall control Conservative gain Details
Dartford Labour Labour hold Details
Daventry No overall control Conservative gain Details
Derbyshire Dales No overall control Conservative gain Details
Derwentside Labour Labour hold Details
Dover Labour No overall control gain Details
Durham Labour Labour hold Details
Easington Labour Labour hold Details
East Cambridgeshire Independent Liberal Democrats gain Details
East Devon Conservative Conservative hold Details
East Dorset Liberal Democrats Conservative gain Details
East Hampshire Liberal Democrats Conservative gain Details
East Hertfordshire No overall control Conservative gain Details
East Lindsey Independent Independent hold Details
East Northamptonshire Labour Conservative gain Details
East Staffordshire Labour Labour hold Details
Eden Independent Independent hold Details
Ellesmere Port and Neston Labour Labour hold Details
Epsom and Ewell Independent Independent hold Details
Erewash Labour Labour hold Details
Fenland No overall control Conservative gain Details
Forest Heath No overall control Conservative gain Details
Forest of Dean Labour Labour hold Details
Fylde No overall control No overall control hold Details
Gedling Labour Conservative gain Details
Gravesham Labour Labour hold Details
Guildford No overall control No overall control hold Details
Hambleton Conservative Conservative hold Details
Harborough No overall control No overall control hold Details
Hertsmere Labour Conservative gain Details
High Peak Labour Labour hold Details
Hinckley and Bosworth No overall control No overall control hold Details
Horsham Liberal Democrats Conservative gain Details
Kennet No overall control No overall control hold Details
Kerrier No overall control No overall control hold Details
Kettering Labour No overall control gain Details
King's Lynn and West Norfolk Labour No overall control gain Details
Lancaster Labour No overall control gain Details
Lewes Liberal Democrats Liberal Democrats hold Details
Lichfield Labour Conservative gain Details
Lincoln Labour Labour hold Details
Macclesfield Conservative Conservative hold Details
Maldon No overall control Conservative gain Details
Mansfield Labour Labour hold Details
Melton No overall control No overall control hold Details
Mendip No overall control No overall control hold Details
Mid Bedfordshire No overall control Conservative gain Details
Mid Devon No overall control No overall control hold Details
Mid Suffolk No overall control No overall control hold Details
Mid Sussex No overall control Conservative gain Details
New Forest Liberal Democrats Conservative gain Details
Newark and Sherwood Labour No overall control gain No overall control gain Details
North Cornwall Independent Independent hold Details
North Devon Liberal Democrats Liberal Democrats hold Details
North Dorset Liberal Democrats No overall control gain Details
North East Derbyshire Labour Labour hold Details
North Hertfordshire Labour Conservative gain Details
North Kesteven No overall control No overall control hold Details
North Norfolk No overall control No overall control hold Details
North Shropshire Independent Independent hold Details
North Warwickshire Labour Labour hold Details
North West Leicestershire Labour Labour hold Details
North Wiltshire Liberal Democrats No overall control gain Details
Northampton Labour Labour hold Details
Oadby and Wigston Liberal Democrats Liberal Democrats hold Details
Oswestry No overall control Independent gain Details
Purbeck No overall control Conservative gain Details
Restormel Liberal Democrats No overall control gain Details
Ribble Valley No overall control No overall control hold Details
Richmondshire Independent No overall control gain Details
Rother No overall control Conservative gain Details
Rushcliffe No overall control Conservative gain Details
Ryedale No overall control No overall control hold Details
Salisbury No overall control No overall control hold Details
Scarborough No overall control No overall control hold Details
Sedgefield Labour Labour hold Details
Sedgemoor No overall control Conservative gain Details
Selby Labour No overall control gain Details
Sevenoaks No overall control Conservative gain Details
Shepway No overall control Conservative gain Details
South Bucks No overall control Conservative gain Details
South Derbyshire Labour Labour hold Details
South Hams No overall control Conservative gain Details
South Holland Independent Conservative gain Details
South Kesteven No overall control No overall control hold Details
South Lakeland No overall control No overall control hold Details
South Norfolk Liberal Democrats Liberal Democrats hold Details
South Northamptonshire No overall control Conservative gain Details
South Oxfordshire No overall control No overall control hold Details
South Ribble No overall control No overall control hold Details
South Shropshire Independent Independent hold Details
South Somerset Liberal Democrats Liberal Democrats hold Details
South Staffordshire Conservative Conservative hold Details
Spelthorne Conservative Conservative hold Details
St Albans Liberal Democrats No overall control gain Details
St Edmundsbury No overall control Conservative gain Details
Stafford Labour No overall control gain Details
Staffordshire Moorlands No overall control No overall control hold Details
Stevenage Labour Labour hold Details
Suffolk Coastal No overall control Conservative gain Details
Surrey Heath Conservative Conservative hold Details
Taunton Deane Liberal Democrats No overall control gain Details
Teesdale Independent Independent hold Details
Teignbridge No overall control No overall control hold Details
Tendring Labour No overall control gain Details
Test Valley No overall control Conservative gain Details
Tewkesbury No overall control No overall control hold Details
Thanet Labour Labour hold Details
Three Rivers No overall control Liberal Democrats gain Details
Tonbridge and Malling No overall control No overall control hold Details
Torridge No overall control Independent gain Details
Tynedale No overall control No overall control hold Details
Uttlesford No overall control No overall control hold Details
Vale of White Horse Liberal Democrats Liberal Democrats hold Details
Vale Royal Labour Labour hold Details
Wansbeck Labour Labour hold Details
Warwick No overall control No overall control hold Details
Watford Labour Labour hold Details
Waverley Liberal Democrats Conservative gain Details
Wealden Conservative Conservative hold Details
Wear Valley Labour Labour hold Details
Wellingborough No overall control Labour gain Details
Welwyn Hatfield Labour Conservative gain Details
West Devon No overall control No overall control hold Details
West Dorset No overall control No overall control hold Details
West Lindsey No overall control No overall control hold Details
West Somerset No overall control No overall control hold Details
West Wiltshire Liberal Democrats Liberal Democrats hold Details
Wychavon No overall control Conservative gain Details
Wycombe No overall control Conservative gain Details
Wyre Labour Conservative gain Details

‡ New ward boundaries

Third of council

CouncilPrevious controlResultDetails
Adur Liberal Democrats No overall control gain Details
Amber Valley Labour Labour hold Details
Basildon Labour Labour hold Details
Basingstoke and Deane No overall control No overall control hold Details
Bassetlaw Labour Labour hold Details
Bedford No overall control No overall control hold Details
Brentwood Liberal Democrats Liberal Democrats hold Details
Broadland No overall control Conservative gain Details
Burnley Labour Labour hold Details
Cambridge No overall control No overall control hold Details
Cannock Chase Labour Labour hold Details
Cheltenham Liberal Democrats No overall control gain Details
Cherwell No overall control No overall control hold Details
Chorley Labour Labour hold Details
Colchester No overall control No overall control hold Details
Craven No overall control Conservative gain Details
Crawley Labour Labour hold Details
Eastbourne Liberal Democrats No overall control gain Details
Eastleigh Liberal Democrats Liberal Democrats hold Details
Elmbridge No overall control No overall control hold Details
Epping Forest No overall control No overall control hold Details
Exeter Labour Labour hold Details
Fareham No overall control Conservative gain Details
Gloucester Labour Labour hold Details
Gosport No overall control No overall control hold Details
Great Yarmouth Labour Labour hold Details
Harlow Labour Labour hold Details
Harrogate Liberal Democrats Liberal Democrats hold Details
Hart No overall control No overall control hold Details
Hastings Labour Labour hold Details
Havant No overall control No overall control hold Details
Huntingdonshire Conservative Conservative hold Details
Hyndburn Labour No overall control gain Details
Ipswich Labour Labour hold Details
Maidstone No overall control No overall control hold Details
Mole Valley No overall control No overall control hold Details
Newcastle-under-Lyme Labour Labour hold Details
Norwich Labour Labour hold Details
Nuneaton and Bedworth Labour Labour hold Details
Oxford Labour Labour hold Details
Pendle Liberal Democrats No overall control gain Details
Penwith No overall control No overall control hold Details
Preston Labour No overall control gain Details
Redditch Labour Labour hold Details
Reigate and Banstead No overall control No overall control hold Details
Rochford No overall control No overall control hold Details
Rossendale Labour Labour hold Details
Rugby No overall control No overall control hold Details
Runnymede Conservative Conservative hold Details
Rushmoor No overall control No overall control hold Details
Shrewsbury and Atcham No overall control No overall control hold Details
South Bedfordshire No overall control No overall control hold Details
South Cambridgeshire No overall control No overall control hold Details
Stratford-on-Avon No overall control No overall control hold Details
Stroud No overall control No overall control hold Details
Swale No overall control No overall control hold Details
Tamworth Labour Labour hold Details
Tandridge No overall control No overall control hold Details
Tunbridge Wells Conservative Conservative hold Details
Waveney Labour Labour hold Details
West Lancashire Labour Labour hold Details
West Oxfordshire No overall control No overall control hold Details
Weymouth and Portland No overall control No overall control hold Details
Winchester Liberal Democrats Liberal Democrats hold Details
Woking No overall control No overall control hold Details
Worcester Labour Labour hold Details
Worthing Liberal Democrats Conservative gain Details
Wyre Forest Labour No overall control gain Details

Scotland

CouncilPrevious controlResultDetails
Aberdeen Labour Labour hold Details
Aberdeenshire No overall control No overall control hold Details
Angus SNP SNP hold Details
Argyll and Bute Independent Independent hold Details
Clackmannanshire Labour No overall control gain Details
Dumfries and Galloway Labour Labour hold Details
Dundee Labour No overall control gain Details
East Ayrshire Labour Labour hold Details
East Dunbartonshire No overall control No overall control hold Details
East Lothian Labour Labour hold Details
East Renfrewshire No overall control No overall control hold Details
Edinburgh Labour Labour hold Details
Falkirk Labour No overall control gain Details
Fife Labour Labour hold Details
Glasgow Labour Labour hold Details
Highland Independent Independent hold Details
Inverclyde Labour Labour hold Details
Midlothian Labour Labour hold Details
Moray SNP No overall control gain Details
Na h-Eileanan Siar Independent Independent hold Details
North Ayrshire Labour Labour hold Details
North Lanarkshire Labour Labour hold Details
Orkney Islands Independent Independent hold Details
Perth and Kinross No overall control No overall control hold Details
Renfrewshire No overall control Labour gain Details
Scottish Borders No overall control No overall control hold Details
Shetland Islands Independent Independent hold Details
South Ayrshire Labour Labour hold Details
South Lanarkshire Labour Labour hold Details
Stirling No overall control No overall control hold Details
West Dunbartonshire Labour Labour hold Details
West Lothian Labour Labour hold Details

Wales

CouncilPrevious controlResultDetails
Blaenau Gwent Labour Labour hold Details
Bridgend Labour Labour hold Details
Caerphilly Labour Plaid Cymru gain Details
Cardiff Labour Labour hold Details
Carmarthenshire No overall control No overall control hold Details
Ceredigion Independent No overall control gain Details
Conwy No overall control No overall control hold Details
Denbighshire No overall control No overall control hold Details
Flintshire Labour Labour hold Details
Gwynedd Plaid Cymru Plaid Cymru hold Details
Isle of Anglesey Independent Independent hold Details
Merthyr Tydfil Labour No overall control gain Details
Monmouthshire Labour No overall control gain Details
Neath Port Talbot Labour Labour hold Details
Newport Labour Labour hold Details
Pembrokeshire Independent Independent hold Details
Powys Independent Independent hold Details
Rhondda Cynon Taf Labour Plaid Cymru gain Details
Swansea Labour Labour hold Details
Torfaen Labour Labour hold Details
Vale of Glamorgan Labour No overall control gain Details
Wrexham Labour No overall control gain Details

Related Research Articles

<span class="mw-page-title-main">2003 United Kingdom local elections</span>

The 2003 United Kingdom local elections were held on Thursday 1 May 2003, the same day as the Scottish Parliamentary and the Welsh Assembly elections. There were local elections for all councils in Scotland and in most of England. There were no local elections in Wales, Northern Ireland or London.

<span class="mw-page-title-main">2004 United Kingdom local elections</span>

The 2004 United Kingdomlocal elections were held on Thursday 10 June 2004, along with the European elections and the London mayoral and Assembly elections.

<span class="mw-page-title-main">1998 United Kingdom local elections</span>

The 1998 United Kingdom local elections were held on Thursday 7 May 1998. All London borough council seats were elected as well a third of the seats on each of the Metropolitan Boroughs. Some unitary authorities and District councils also had elections. There were no local elections in Scotland, Wales or Northern Ireland.

<span class="mw-page-title-main">2002 United Kingdom local elections</span>

The 2002 United Kingdom local elections were held on Thursday 2 May 2002. All London borough council seats were elected as well a third of the seats on each of the Metropolitan Boroughs. Many unitary Authorities and District councils also had elections. There were no local elections in Scotland, Wales or Northern Ireland. This was the last time that Labour was the majority in local government until 2023.

<span class="mw-page-title-main">1995 United Kingdom local elections</span>

The 1995 United Kingdom local elections took place on Thursday 6 April 1995 in Scotland, and Thursday 4 May 1995 in England and Wales. The Conservative Party lost over 2,000 councillors in the election, while the Labour Party won 48% of the vote, a record high for the party in local elections.

Sunderland City Council elections are generally held three years out of every four, with a third of the council being elected each time. Sunderland City Council is the local authority for the metropolitan borough of the City of Sunderland in Tyne and Wear, England. Since the last boundary changes in 2004, 75 councillors have been elected from 25 wards.

<span class="mw-page-title-main">1976 United Kingdom local elections</span>

Local elections were held in the United Kingdom on 6 May 1976. Elections were for one third of the seats on Metropolitan borough councils and for all seats on Non-Metropolitan district councils in England; and for all seats on the Welsh district councils.

<span class="mw-page-title-main">2008 United Kingdom local elections</span>

The 2008 United Kingdom local elections were held on 1 May 2008. These elections took place in 137 English Local Authorities and all Welsh Councils.

<span class="mw-page-title-main">1997 United Kingdom local elections</span>

The 1997 United Kingdom local elections took place on Thursday 1 May 1997 in England, and Thursday 21 May 1997 in Northern Ireland. Elections took place for all of the English country councils, some English unitary authorities and all of the Northern Ireland districts. The local elections were held on the same day as the 1997 general election.

The 1964 Lambeth Council election took place on 7 May 1964 to elect members of Lambeth London Borough Council in London, England. The whole council was up for election and the Labour party gained control of the council. The election is notable for being the first one ever fought by John Major.

<span class="mw-page-title-main">1996 United Kingdom local elections</span>

The 1996 United Kingdom local elections were held on 2 May 1996. They were the last local elections until 2010 to show a decline in the number of Conservative councillors and an increase in the number of Labour councillors.

<span class="mw-page-title-main">1994 United Kingdom local elections</span>

The 1994 United Kingdom local elections were held on Thursday 5 May 1994. The results showed a continued decline for the governing Conservatives — who were now in their 15th successive year of government at Westminster — with the third-placed party, the Liberal Democrats, as the main beneficiaries.

<span class="mw-page-title-main">1991 United Kingdom local elections</span>

The 1991 United Kingdom local elections were held on Thursday 2 May 1991. The results were a setback for the governing Conservative Party, who were left with their lowest number of councillors since 1973, though their popular vote was an improvement from the 1990 local elections.

<span class="mw-page-title-main">1979 United Kingdom local elections</span>

Local elections were held in the United Kingdom on 3 May 1979. The results provided some source of comfort to the Labour Party, who recovered some lost ground from local election reversals in previous years, despite losing the general election to the Conservative Party on the same day. The Liberals also gained councillors and a council.

<span class="mw-page-title-main">1980 United Kingdom local elections</span>

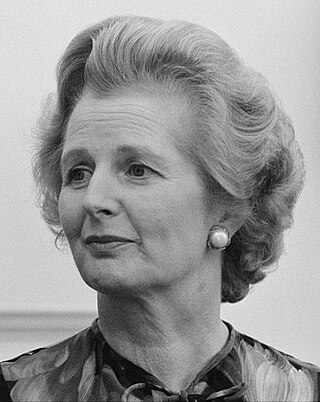
Local elections were held in the United Kingdom in 1980. These were the first annual local elections for the new Conservative Prime Minister Margaret Thatcher. Though the Conservatives in government lost seats, the projected share of the vote was close: Labour Party 42%, Conservative Party 40%, Liberal Party 13%. Labour were still being led by the former prime minister James Callaghan, who resigned later in the year to be succeeded by Michael Foot.

<span class="mw-page-title-main">1982 United Kingdom local elections</span>

Local elections were held in the United Kingdom in 1982. The elections coincided with rising popularity of the Conservative government and Prime Minister Margaret Thatcher, which was mostly attributed to the Falklands War. The projected share of the vote was Conservatives 40%, Labour 29%, Liberal-SDP Alliance 27%.

<span class="mw-page-title-main">1983 United Kingdom local elections</span>

Local elections were held in the United Kingdom in 1983. The results were a success for Conservative Prime Minister Margaret Thatcher, who soon afterwards called a general election in which the Conservatives won a landslide victory. The projected share of the vote was Conservative 39%, Labour Party 36%, Liberal-SDP Alliance 20%.

<span class="mw-page-title-main">1986 United Kingdom local elections</span>

The 1986 United Kingdom local elections were held on Thursday 8 May 1986. There was a 3% reduction in the number of councillors, owing to the abolition of the Greater London Council and the Metropolitan County Councils.

<span class="mw-page-title-main">2015 United Kingdom local elections</span>

The 2015 United Kingdom local elections were held on Thursday 7 May 2015, the same day as the general election for the House of Commons of the United Kingdom.

<span class="mw-page-title-main">2022 United Kingdom local elections</span> Elections to local councils and mayoralties

The 2022 United Kingdom local elections took place on Thursday 5 May 2022. These included elections for all London borough councils, for all local authorities in Wales and Scotland. Most seats in England were last up for election in 2018 and in Scotland and Wales in 2017. The elections coincided with the 2022 Northern Ireland Assembly election. In 91 cases, most of them in Wales, council seats were uncontested, each having only one candidate. Three seats in Scotland remained unfilled as no one nominated to fill them.

References

  1. Rallings, Colin; Thrasher, Michael; Cheal, Brian; Ware, Lawrence. "Local Elections Handbook 1999" (PDF). Local Government Chronicle Elections Centre. Retrieved 3 May 2016.
  2. "Council compositions". The Elections Centre. Retrieved 3 May 2016.