1999 European Parliament election in the United Kingdom

Last updated

1999 European Parliament election in the United Kingdom
Flag of the United Kingdom.svg
  1994 10 June 1999 2004  

All 87 seats of the United Kingdom's seats
in the European Parliament
Turnout24.0% (Decrease2.svg12.4%) [1]
 First partySecond partyThird party
  McMillan-Scott, Edward-9592.jpg
Lab
Official portrait of Lord Teverson crop 2, 2019.jpg
Leader Edward McMillan-Scott Alan Donnelly Robert Teverson
Party Conservative Labour Liberal Democrats
Alliance EPP PES ALDE
Leader since16 September 199719971994
Leader's seat Yorkshire and the Humber North East England South West England (defeated)
Last election18 seats, 26.8%62 seats, 42.6%2 seats, 17%
Seats before18622
Seats won362910
Seat changeIncrease2.svg18Decrease2.svg33Increase2.svg8
Popular vote3,578,2182,803,8211,266,549
Percentage33.5%26.3%11.9%
SwingIncrease2.svg6.5%Decrease2.svg16.4%Decrease2.svg4.3%

 Fourth partyFifth partySixth party
 
UKIP
Green
Alex Salmond, First Minister of Scotland (cropped).jpg
Leader Michael Holmes N/A [lower-alpha 1] Alex Salmond
Party UKIP Green SNP
Alliance N/A European Green Party European Free Alliance
Leader sinceSeptember 1997N/A22 September 1990
Leader's seatN/AN/AN/A
Last election0 seats, 1.0%0 seats, 3.0%2 seats, 3.1%
Seats before002
Seats won322
Seat changeIncrease2.svg3Increase2.svg2Steady2.svg
Popular vote696,057568,236268,528
Percentage6.55.32.5
SwingIncrease2.svg5.5Increase2.svg2.3%Decrease2.svg0.6%

European Parliament election 1999 - UK results.png
Colours denote the winning party, as shown in the main table of results

1999 UK European Parliament election.svg

Leader of Largest Party before election

Tony Blair
Labour

Subsequent Leader of Largest Party

William Hague
Conservative

The 1999 European Parliament election was the United Kingdom's part of the European Parliament election 1999. It was held on 10 June 1999. Following the European Parliamentary Elections Act 1999, it was the first European election to be held in the United Kingdom where the whole country used a system of proportional representation. In total, 87 Members of the European Parliament were elected from the United Kingdom across twelve new regional constituencies.

Contents

The change in voting system resulted in significant changes in seats. The Conservatives won double the number of seats they had won in the previous European election, in 1994, while the Labour Party saw its seats reduced from 62 to 29. The Liberal Democrats saw their number of seats increase to 10 from just 2 in the previous election. The UK Independence Party (UKIP), Green Party and Plaid Cymru gained their first seats in the European Parliament.

A by-election to the British Parliament also took place on the same day in the Leeds Central constituency - Labour held the seat but with significantly reduced turnout.

The House of Commons Library calculated notional seat changes based on what the result would have been if the 1994 European elections had been held under proportional representation. [2] The notional results and seat changes are shown in the results box for this article.

It was the first European Parliament election to be held since the 1997 general election which resulted in a change of government from Conservative to Labour.

Turnout was 24%, the lowest of any member state in the 1999 election where the EU average was 49.51%. It was also the lowest of any European election in the United Kingdom, and the lowest of any member state until the 2009 election and to date is the lowest turnout for any national election in the history of the United Kingdom. [1]

Background

Electoral system

The European Parliamentary Elections Act 1999 introduced a closed-list party list system method of proportional representation, calculated using the D'Hondt method into Great Britain. In Northern Ireland, the Single Transferable Vote, which is also a form of proportional representation, which had been used since the first European election in 1979 was retained. The Act also created twelve new electoral regions, which were based on the British government's nine administrative Regions of England, Northern Ireland, Scotland and Wales. The effect of the introduction of proportional representation was that many small parties won seats to the European Parliament for the first time.

Results

United Kingdom

Map showing most popular party by counting area. European Parliament election, 1999 (United Kingdom).svg
Map showing most popular party by counting area.

The Conservatives doubled the number of seats from the last European election. Labour saw their 62 seats reduced to just 29. It was the first European Parliament election to be held since the change of United Kingdom government from Conservative to Labour two years earlier. The Liberal Democrats saw their number of seats increase to 10 from just 2 in the previous election. The UK Independence Party, Green Party and Plaid Cymru won their first seats in the European Parliament.

These changes were largely due to the move to proportional representation from first-past-the-post. [3] The House of Commons Library calculated that if the 1994 European elections had been held under proportional representation, Labour would have won 43 MEPs, the Conservatives 26, the Lib Dems 11, the SNP 3 and Plaid Cymru 1. [2]

PartyVotes won % of voteChangeSeats % of seatsLoss/Gain
vs actual
'94 result
Loss/Gain
vs notional
'94 result
Conservative 3,578,21833.5Increase2.svg6.53641.4Increase2.svg18Increase2.svg10
Labour 2,803,82126.3Decrease2.svg16.42933.3Decrease2.svg33Decrease2.svg14
Liberal Democrats 1,266,54911.9Decrease2.svg4.31011.9Increase2.svg8Decrease2.svg1
UKIP 696,0576.5Increase2.svg5.633.4Increase2.svg3Increase2.svg3
Green 568,2365.3Increase2.svg2.322.4Increase2.svg2Increase2.svg2
SNP 268,5282.5Decrease2.svg0.622.3Steady2.svgDecrease2.svg1
DUP 192,7621.8Increase2.svg0.811.1Steady2.svgSteady2.svg
SDLP 190,7311.8Increase2.svg0.811.1Steady2.svgSteady2.svg
Plaid Cymru 185,2351.7Increase2.svg0.722.3Increase2.svg2Increase2.svg1
Pro-Euro Conservative 138,0971.3New0Steady2.svgSteady2.svgSteady2.svg
Ulster Unionist 119,5071.1Increase2.svg0.311.1Steady2.svgSteady2.svg
Sinn Féin 117,6431.1Increase2.svg0.80Steady2.svgSteady2.svgSteady2.svg
BNP 102,6471.0New0Steady2.svgSteady2.svgSteady2.svg
Liberal 93,0510.9Increase2.svg0.30Steady2.svgSteady2.svgSteady2.svg
Socialist Labour 86,7490.8New0Steady2.svgSteady2.svgSteady2.svg
Scottish Green 57,1420.5Increase2.svg0.40Steady2.svgSteady2.svgSteady2.svg
Scottish Socialist 39,7200.4New0Steady2.svgSteady2.svgSteady2.svg
PUP 22,4940.2New0Steady2.svgSteady2.svgSteady2.svg
Natural Law 21,3270.2Decrease2.svg0.40Steady2.svgSteady2.svgSteady2.svg
UK Unionist 20,2830.2New0Steady2.svgSteady2.svgSteady2.svg
Alliance 14,3910.1Steady2.svg0Steady2.svgSteady2.svgSteady2.svg
Socialist Alliance 7,2030.1New0Steady2.svgSteady2.svgSteady2.svg
Humanist 2,5860.0New0Steady2.svgSteady2.svgSteady2.svg
Weekly Worker1,7240.0New0Steady2.svgSteady2.svgSteady2.svg
Socialist (GB) 1,5100.0New0Steady2.svgSteady2.svgSteady2.svg
Others84,8720.80Steady2.svgSteady2.svgSteady2.svg
Total10,681,08387100
Source: BBC News, [4] UK Parliament Briefing [2]

Great Britain

Summary of the election results for Great Britain

PartyVotes won % of voteLoss/GainSeats % of seatsLoss/Gain
vs actual
'94 result
Loss/Gain
vs notional
'94 result
Conservative 3,578,21835.8Increase2.svg7.93642.9Increase2.svg18
Labour 2,803,82128.0Decrease2.svg16.12934.5Decrease2.svg33
Liberal Democrats 1,266,54912.7Decrease2.svg4.11011.9Increase2.svg8
UKIP 696,0577.0Increase2.svg6.033.6Increase2.svg3Increase2.svg3
Green 568,2366.3Increase2.svg2.622.4Increase2.svg2Increase2.svg2
SNP 268,5282.7Decrease2.svg0.522.4Steady2.svgDecrease2.svg1
Plaid Cymru 185,2351.9Increase2.svg0.822.4Increase2.svg2Increase2.svg1
Pro-Euro Conservative 138,0971.4New0Steady2.svgSteady2.svgSteady2.svg
BNP 102,6471.0New0Steady2.svgSteady2.svgSteady2.svg
Liberal 93,0510.9Increase2.svg0.30Steady2.svgSteady2.svgSteady2.svg
Socialist Labour 86,7490.9New0Steady2.svgSteady2.svgSteady2.svg
Scottish Green 57,1420.6Increase2.svg0.40Steady2.svgSteady2.svgSteady2.svg
Scottish Socialist 39,7200.4New0Steady2.svgSteady2.svgSteady2.svg
Natural Law 20,3290.4Decrease2.svg0.20Steady2.svgSteady2.svgSteady2.svg
Socialist Alliance 7,2030.1New0Steady2.svgSteady2.svgSteady2.svg
Humanist 2,5860.0New0Steady2.svgSteady2.svgSteady2.svg
Weekly Worker1,7240.0New0Steady2.svgSteady2.svgSteady2.svg
Socialist (GB) 1,5100.1New0Steady2.svgSteady2.svgSteady2.svg
Others84,8720.80Steady2.svgSteady2.svgSteady2.svg
Total10,002,27384100
Source: BBC News, [4] UK Parliament Briefing [2]

Northern Ireland

Summary of the election results for Northern Ireland [4]

European Parliament election 1999: Northern Ireland [5]
PartyCandidate(s)SeatsLoss/GainFirst Preference Votes
Number % of vote
DUP Ian Paisley 10192,76228.4
SDLP John Hume 10190,73128.1
Ulster Unionist Jim Nicholson 10119,50717.6
Sinn Féin Mitchel McLaughlin 00117,64317.3
PUP David Ervine 0022,4943.3
UK Unionist Robert McCartney 0020,2833.0
Alliance Seán Neeson 0014,3912.1
Natural Law James Anderson009980.2
Turnout678,809

MEPs defeated

Labour

Liberal Democrat

Conservative

Pro-Euro Conservative Party

Independent Labour

Scottish Socialist Party

Leeds Left Alliance

Aftermath

Labour's results brought about a debate within the party about the introduction of proportional representation. In September 1998, a poll of 150 MPs had found that 58% backed the introduction of proportional representation. A follow-up poll ran on the Sunday after the election found that this had decreased to 43%, with the majority wanting a return to the first-past-the-post system. [6] It has also been argued, however, that the introduction of proportional representation actually reduced Labour's losses, as first-past-the-post is more sensitive to swings in public opinion. [7]

See also

Notes

  1. At the time of the election the party had principal speakers rather than leaders.

Related Research Articles

<span class="mw-page-title-main">Politics of the United Kingdom</span> Political system of the United Kingdom of Great Britain and Northern Ireland

The politics of the United Kingdom functions within a constitutional monarchy where executive power is delegated by legislation and social conventions to a unitary parliamentary democracy. From this a hereditary monarch, currently Charles III, serves as head of state while the Prime Minister of the United Kingdom, currently Rishi Sunak, serves as the elected head of government.

<span class="mw-page-title-main">1979 European Parliament election in the United Kingdom</span> 7 June 1979 election that was the first European election to be held in the United Kingdom

The 1979 European Parliament election, was the first European election to be held in the United Kingdom after the European Communities (EC) decided to directly elect representatives to the European Parliament. It was held on 7 June. Elections were also held in eight other EC states. European elections were incorporated into UK law by the European Assembly Elections Act 1978. Out of the 410 members of the European Parliament, 81 were elected from the UK. The electoral system was First Past the Post in England, Scotland and Wales and Single Transferable Vote in Northern Ireland.

<span class="mw-page-title-main">1989 European Parliament election in the United Kingdom</span> European Parliament elections in the United Kingdom

The 1989 European Parliament election, was the third European election to be held in the United Kingdom. It was held on 15 June. The electoral system was First Past the Post in England, Scotland and Wales and Single Transferable Vote in Northern Ireland. The turnout was again the lowest in Europe.

<span class="mw-page-title-main">1994 European Parliament election in the United Kingdom</span> European Parliament elections in the United Kingdom

The 1994 European Parliament election was the fourth European election to be held in the United Kingdom. It was held on Thursday 9 June, though, as usual, the ballots were not counted until the evening of Sunday 12 June. The electoral system was, for the final European election, first past the post in England, Scotland and Wales and single transferable vote in Northern Ireland. This was the first election with 87 MEPs, the European Parliamentary Elections Act 1993 having increased the number of seats for the UK from 81. For the first time, the UK did not have the lowest turnout in Europe. Turnout was lower in the Netherlands and Portugal.

<span class="mw-page-title-main">2004 European Parliament election in the United Kingdom</span> Election

The 2004 European Parliament election was the United Kingdom's part of the wider 2004 European Parliament election which was held between 10 and 13 June 2004 in the 25 member states of the European Union. The United Kingdom's part of this election was held on Thursday 10 June 2004. The election also coincided with the 2004 local elections and the London Assembly and mayoral elections. In total, 78 Members of the European Parliament were elected from the United Kingdom using proportional representation.

<span class="mw-page-title-main">East Midlands (European Parliament constituency)</span> Constituency of the European Parliament

East Midlands was a constituency of the European Parliament in the United Kingdom, established in 1999 with six members to replace single-member districts. Between 2009 and the United Kingdom's withdrawal from the EU on 31 January 2020 it returned five MEPs, elected using the D'Hondt method of party-list proportional representation.

<span class="mw-page-title-main">Wales (European Parliament constituency)</span> Constituency of the European Parliament

Wales was a constituency of the European Parliament. It elected 4 MEPs using the D'Hondt method of party-list proportional representation, until the UK exit from the European Union on 31 January 2020.

<span class="mw-page-title-main">2005 United Kingdom general election</span>

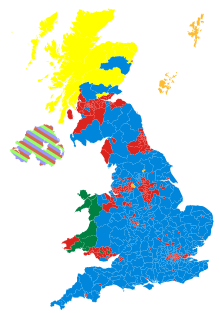
The 2005 United Kingdom general election was held on Thursday 5 May 2005, to elect 646 members to the House of Commons. The governing Labour Party, led by Tony Blair, won its third consecutive victory, with Blair becoming the second Labour leader after Harold Wilson to form three majority governments. However, its majority fell to 66 seats compared to the 167-seat majority it had won four years before. This was the first time the Labour Party had won a third consecutive election, and remains the party's most recent general election victory.

There are four types of elections in Wales: elections to the House of Commons of the United Kingdom, elections to the devolved Senedd, local elections to the 22 principal areas, and the Police and Crime Commissioner elections, in addition to by-elections for each aforementioned election. Elections are held on Election Day, which is conventionally a Thursday. Since the passing of the Fixed-term Parliaments Act 2011 for UK general elections, all four types of elections are held after fixed periods, though early elections to the UK parliament can occur in certain situations, with Senedd elections being postponed to avoid elections to the UK parliament and Senedd coinciding with each other.

<span class="mw-page-title-main">2009 European Parliament election in the United Kingdom</span> European Parliament elections in the United Kingdom

The 2009 European Parliament election was the United Kingdom's component of the 2009 European Parliament election, the voting for which was held on Thursday 4 June 2009. The election was held concurrently with the 2009 local elections in England. In total, 72 Members of the European Parliament were elected from the United Kingdom using proportional representation.

<span class="mw-page-title-main">2011 National Assembly for Wales election</span>

The 2011 National Assembly for Wales election was an election for the National Assembly. The poll was held on 5 May 2011 and decided the incumbency for all the Assembly's seats. It was the fourth election for seats in the National Assembly for Wales, and the second election taken under the rules of the Government of Wales Act 2006.

<span class="mw-page-title-main">Merseyside West (European Parliament constituency)</span> Constituency of the European Parliament

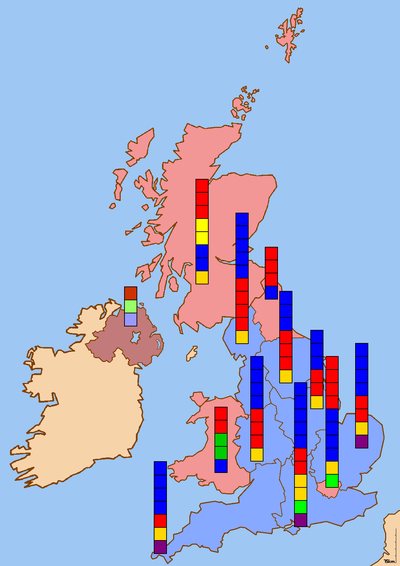
Prior to its uniform adoption of proportional representation in 1999, the United Kingdom used first-past-the-post for the European elections in England, Scotland and Wales. The European Parliament constituencies used under that system were smaller than the later regional constituencies and only had one Member of the European Parliament each.

The Green Party of England and Wales has its roots in the PEOPLE Party started in Coventry in 1972/3 by four professional friends. It then changed its name to the more descriptive Ecology Party in 1975, and to the Green Party ten years later. In the 1990s, the Scottish and Northern Ireland wings of the Green Party in the United Kingdom decided to separate amicably from the party in England and Wales, to form the Scottish Green Party and the Green Party in Northern Ireland. The Wales Green Party became an autonomous regional party and remained within the new Green Party of England and Wales.

<span class="mw-page-title-main">Elections in the United Kingdom</span> Overview of the procedure of elections in the United Kingdom

There are five types of elections in the United Kingdom: elections to the House of Commons of the United Kingdom, elections to devolved parliaments and assemblies, local elections, mayoral elections, and Police and Crime Commissioner elections. Within each of those categories, there may also be by-elections. Elections are held on Election Day, which is conventionally a Thursday, and under the provisions of the Dissolution and Calling of Parliament Act 2022 the timing of general elections can be held at the discretion of the prime minister during any five-year period. All other types of elections are held after fixed periods, though early elections to the devolved assemblies and parliaments can occur in certain situations. The five electoral systems used are: the single member plurality system (first-past-the-post), the multi-member plurality, the single transferable vote, the additional member system, and the supplementary vote.

This is the results breakdown of the 2010 United Kingdom general election.

<span class="mw-page-title-main">2007 National Assembly for Wales election</span>

The 2007 National Assembly for Wales election was held on Thursday 3 May 2007 to elect members to the National Assembly for Wales. It was the third general election. On the same day local elections in England and Scotland, as well as the Scottish Parliament election took place. This election was preceded by the previous Assembly election in 2003.

<span class="mw-page-title-main">2014 European Parliament election in the United Kingdom</span> Election

The 2014 European Parliament election was the United Kingdom's component of the 2014 European Parliament election, held on Thursday 22 May 2014, coinciding with the 2014 local elections in England and Northern Ireland. In total, 73 Members of the European Parliament were elected from the United Kingdom using proportional representation. England, Scotland and Wales use a closed-list party list system of PR, while Northern Ireland used the single transferable vote (STV).

<span class="mw-page-title-main">2019 European Parliament election in the United Kingdom</span> 2019 election of members of the European Parliament for the United Kingdom

The 2019 European Parliament election was the United Kingdom's component of the 2019 European Parliament election, held on Thursday 23 May 2019 and the results were announced on Sunday 26 and Monday 27 May 2019, after all the other EU countries had voted. This was the United Kingdom's final participation in a European Parliament election before leaving the European Union on 31 January 2020, and was also the last election to be held under the provisions of the European Parliamentary Elections Act 2002 before its repeal under the European Union (Withdrawal) Act 2018.

Opinion polling for the next United Kingdom general election is continually being carried out by various organisations to gauge voting intention. Most of the polling companies listed are members of the British Polling Council (BPC) and abide by its disclosure rules. The dates for these opinion polls range from the 2019 general election on 12 December to the present day.

<span class="mw-page-title-main">2019 United Kingdom general election in Wales</span> United Kingdom general election held in Wales

The 2019 United Kingdom general election was held on 12 December 2019 to elect all 650 members of the House of Commons, including the 40 Welsh seats.

References

  1. 1 2 "Previous European Parliamentary Elections – About Parliament". European Parliament. Retrieved 26 May 2019.
  2. 1 2 3 4 "European Parliament Elections June 1999 – Commons Library briefing". UK Parliament. 21 June 1999. Retrieved 5 March 2019.
  3. "Success for smaller parties". BBC News. 14 June 1999. Retrieved 26 May 2014.
  4. 1 2 3 "Euro Elections, Results – Great Britain and Northern Ireland". BBC News. Retrieved 24 May 2014.
  5. The 1999 European Election, Northern Ireland Elections
  6. "Labour postmortem begins". BBC News. 14 June 1999. Retrieved 25 May 2014.
  7. "Robin Oakley's Westminster Week – The Euro fallout". BBC News. 14 June 1999. Retrieved 26 May 2014.