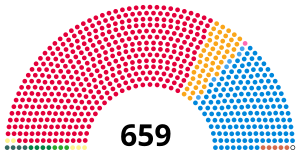
Seats won in the election (outer ring) against number of votes (inner ring).
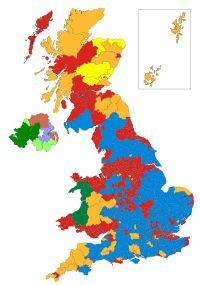
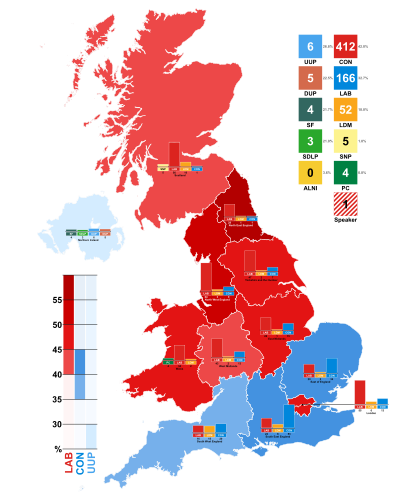
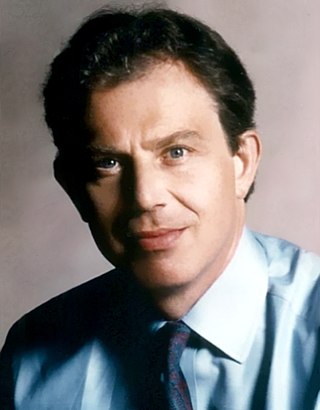
The 2001 United Kingdom general election was held on Thursday 7 June 2001, four years after the previous election on 1 May 1997, to elect 659 members to the House of Commons. The governing Labour Party was re-elected to serve a second term in government with another landslide victory with a 167 majority, returning 412 members of Parliament versus 418 from the 1997 general election, a net loss of six seats, though with a significantly lower turnout than before—59.4%, compared to 71.6% at the previous election.[1] The number of votes Labour received fell by nearly three million. Tony Blair went on to become the only Labour Prime Minister to serve two consecutive full terms in office. As Labour retained almost all of their seats won in the 1997 landslide victory, the media dubbed the 2001 election "the quiet landslide".[2]
There was little change outside Northern Ireland, with 620 out of the 641 seats in Great Britain electing candidates from the same party as they did in 1997. Factors contributing to the Labour victory included a strong economy, falling unemployment, and public perception that the Labour government had delivered on many key election pledges that it had made in 1997.[citation needed]
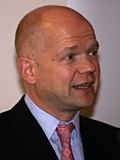
The opposition Conservative Party, under William Hague's leadership, was still deeply divided on the issue of Europe and the party's policy platform had drifted considerably to the right. The party put the issue of European monetary union (and in particular, the prospect of the UK joining the Eurozone) at the centre of its campaign, but it failed to resonate with the electorate. The Tories briefly had a narrow lead in the polls during the 2000 fuel strikes, but Labour successfully resolved them by year end. Furthermore, a series of publicity stunts that backfired also harmed Hague, and he immediately announced his resignation as party leader when the election result was clear, formally stepping down three months later, therefore becoming the first leader of the Conservative and Unionist Party in the House of Commons since Austen Chamberlain nearly eighty years prior not to serve as prime minister.
The election was largely a repeat of the 1997 general election, with Labour losing only six seats overall and the Conservatives making a net gain of one seat (gaining nine seats but losing eight). The Conservatives gained a seat in Scotland, which ended the party's status as an "England-only" party in the prior parliament, but failed again to win any seats in Wales. Although they did not gain many seats, three of the few new MPs elected were future Conservative Prime Ministers David Cameron and Boris Johnson and future Conservative Chancellor of the ExchequerGeorge Osborne; Osborne would serve in the same Cabinet as Cameron from 2010 to 2016. The Liberal Democrats made a net gain of six seats.
The 2001 general election was notable for being the first in which pictures of the party logos appeared on the ballot paper. Prior to this, the ballot paper had only displayed the candidate's name, address, and party name.[5]
Overview
The election had been expected on 3 May, to coincide with local elections, but on 2 April 2001, both were postponed to 7 June because of rural movement restrictions imposed in response to the foot-and-mouth outbreak that had started in February.
The elections were marked by voter apathy, with turnout falling to 59.4%, the lowest (and first under 70%) since the Coupon Election of 1918. Throughout the election the Labour Party had maintained a significant lead in the opinion polls and the result was deemed to be so certain that some bookmakers paid out for a Labour majority before election day. However, the opinion polls the previous autumn had shown the first Tory lead (though only by a narrow margin) in the opinion polls for eight years as they benefited from the public anger towards the government over the fuel protests which had led to a severe shortage of motor fuel.
By the end of 2000, however, the dispute had been resolved and Labour were firmly back in the lead of the opinion polls.[6] In total, a mere 29 parliamentary seats changed hands at the 2001 Election.[7]
For Labour, the last four years had run relatively smoothly.[8] The party had successfully defended all their by election seats, and many suspected a Labour win was inevitable from the start.
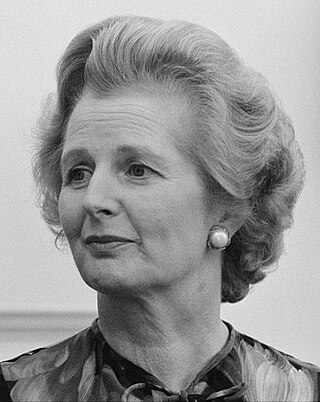
Many in the party, however, were afraid of voter apathy, which was epitomised in a poster of "Hague with Margaret Thatcher's hair", captioned "Get out and vote. Or they get in."[9] Despite recessions in mainland Europe and the United States, due to the bursting of global tech bubbles, Britain was notably unaffected and Labour however could rely on a strong economy as unemployment continued to decline toward election day, putting to rest any fears of a Labour government putting the economic situation at risk.
For William Hague, however, the Conservative Party had still not fully recovered from the loss in 1997. The party was still divided over Europe, and talk of a referendum on joining the Eurozone was rife, and as a result "Save The Pound" was one of the key slogans deployed in the Conservatives' campaign. As Labour remained at the political centre, the Tories moved to the right. A policy gaffe by Oliver Letwin over public spending cuts left the party with an own goal that Labour soon exploited.
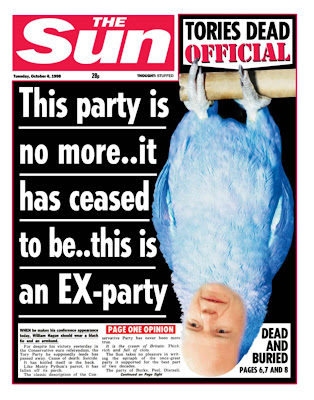
Thatcher gave a speech to the Conservative Election Rally in Plymouth on 22 May 2001, calling New Labour "rootless, empty, and artificial." She also added to Hague's troubles when speaking out strongly against the Euro to applause. Hague himself, although a witty performer at Prime Minister's Questions, was dogged in the press and reminded of his speech, given at the age of 16, at the 1977 Conservative Conference. The Sun newspaper only added to the Conservatives' woes by backing Labour for a second consecutive election, calling Hague a "dead parrot" during the Conservative Party's conference in October 1998.[10][11][12]
The Tories campaigned on a strongly right-wing platform, emphasising the issues of Europe, immigration and tax, the fabled "Tebbit Trinity". They also released a poster showing a heavily pregnant Tony Blair, stating "Four years of Labour and he still hasn't delivered".[13] However, Labour countered by asking where the proposed tax cuts were going to come from, and decried the Tory policy as "cut here, cut there, cut everywhere", in reference to the widespread belief that the Conservatives would make major cuts to public services in order to fund tax cuts. Labour also capitalised on the strong economic conditions of the time, and another major line of attack (primarily directed towards Michael Portillo, now Shadow Chancellor after returning to Parliament via a by-election) was to warn of a return to "Tory Boom and Bust" under a Conservative administration.
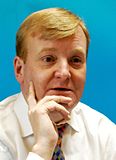
Charles Kennedy contested his first election as leader of the Liberal Democrats.[14]
Controversy
During the election Sharron Storer, a resident of Birmingham, criticised Prime Minister Tony Blair in front of television cameras about conditions in the National Health Service. The widely televised incident happened on 16 May during a campaign visit by Blair to the Queen Elizabeth Hospital in Birmingham. Sharron Storer's partner, Keith Sedgewick, a cancer patient with non-Hodgkin's lymphoma and therefore highly susceptible to infection, was being treated at the time in the bone marrow unit, but no bed could be found for him and he was transferred to the casualty unit for his first 24 hours.[15][16][17] On the evening of the same day Deputy Prime Minister John Prescottpunched a protestor after being hit by an egg on his way to an election rally in Rhyl, North Wales.[18]
The election result was effectively a repeat of 1997, as the Labour Party retained an overwhelming majority, with the BBC announcing the victory at 02:58 on the early morning of 8 June. Having presided over relatively serene political, economic and social conditions, the feeling of prosperity in the United Kingdom had been maintained into the new millennium, and Labour would have a free hand to assert its ideals in the subsequent parliament. Despite the victory, voter apathy was a major issue, as turnout fell below 60%, 12 percentage points down on 1997. All three of the main parties saw their total votes fall, with Labour's total vote dropping by 2.8 million on 1997, the Conservatives 1.3 million, and the Liberal Democrats 428,000. Some suggested this dramatic fall was a sign of the general acceptance of the status quo and the likelihood of Labour's majority remaining unassailable.[22]
For the Conservatives, the huge loss they had sustained in 1997 was repeated. Despite gaining nine seats, the Tories lost seven to the Liberal Democrats, and one even to Labour. William Hague was quick to announce his resignation, doing so at 07:44 outside the Conservative Party headquarters. Some believed that Hague had been unlucky; although most considered him to be a talented orator and an intelligent statesman, he had come up against the charismatic Tony Blair in the peak of his political career, and it was no surprise that little progress was made in reducing Labour's majority after a relatively smooth parliament.
Staying at what they considered rock bottom, however, showed that the Conservatives had failed to improve their negative public image, had remained somewhat disunited over Europe, and had not regained the trust that they had lost in the 1990s. Hague's focus on the "Save The Pound" campaign narrative had failed to gain any traction; Labour's successful countertactic was to be repeatedly vague over the issue of future monetary union - and said that the UK would only consider joining the Eurozone "when conditions were right". But in Scotland, despite flipping one seat from the Scottish National Party, their vote collapse continued. They failed to retake former strongholds in Scotland as the Nationalists consolidated their grip on the Northeastern portion of the country.[23]
The Liberal Democrats could point to steady progress under their new leader, Charles Kennedy, gaining more seats than the main two parties—albeit only six overall—and maintaining the performance of a pleasing 1997 election, where the party had doubled its number of seats from 20 to 46. While they had yet to become electable as a government, they underlined their growing reputation as a worthwhile alternative to Labour and Conservative, offering plenty of debate in Parliament and representing more than a mere protest vote.[citation needed]
The SNP failed to gain any new seats and lost a seat to the Conservatives by just 79 votes. In Wales, Plaid Cymru both gained a seat from Labour and lost one to them.
The seat gains reflect changes on the 1997 general election result. Two seats had changed hands in by-elections in the intervening period. These were as follows:
MORI interviewed 18,657 adults in Great Britain after the election which suggested the following demographic breakdown...[25]
The 2001 UK general election vote in Great Britain (in per cent)
Social Group
Lab
Con
Lib Dem
Others
Lead
Turnout
Total
42
33
19
6
9
59
Gender
Men
42
32
18
8
10
61
Women
42
33
19
6
9
58
Age
18-24
41
27
24
8
14
39
25-34
51
24
19
6
27
46
35-44
45
28
19
8
17
59
45-54
41
32
20
7
9
65
55-64
37
39
17
7
2
69
65+
39
40
17
4
1
70
Social class
AB
30
39
25
6
9
68
C1
38
36
20
6
2
60
C2
49
29
15
7
20
56
DE
55
24
13
8
31
53
Work status
Full time
43
30
20
7
13
57
Part time
43
29
21
7
14
56
Not working
41
36
18
5
5
63
Unemployed
54
23
11
12
31
44
Self-employed
32
39
18
11
7
60
Housing tenure
Owner
32
43
19
6
11
68
Mortgage
42
31
20
7
11
59
Council/HA
60
18
14
8
42
52
Private rent
40
28
25
7
12
46
Men by age
18-24
38
29
26
7
9
43
25-34
52
24
19
5
28
47
35-54
43
29
19
9
14
64
55+
39
39
16
6
Tie
73
Men by social class
AB
31
38
25
6
7
68
C1
39
36
14
11
3
62
C2
49
28
14
9
21
56
DE
55
23
14
8
32
56
Women by age
18-24
45
24
23
8
21
36
25-34
49
25
19
7
24
46
35-54
43
31
20
6
12
60
55+
38
40
18
4
2
67
Women by social class
AB
28
41
26
5
13
68
C1
37
37
20
6
Tie
59
C2
48
30
17
5
18
56
DE
56
25
13
6
31
50
Readership
Daily Express
33
43
19
5
10
63
Daily Mail
24
55
17
4
31
65
The Mirror
71
11
13
5
58
62
Daily Record
59
8
10
23
36
57
Daily Telegraph
16
65
14
5
49
71
Financial Times
30
48
21
1
18
64
The Guardian
52
6
34
8
18
68
The Independent
38
12
44
6
6
69
Daily Star
56
21
17
6
35
48
The Sun
52
29
11
8
23
50
The Times
28
40
26
6
12
66
No daily paper
45
27
22
6
18
56
Evening Standard
42
29
21
8
13
51
Sunday Readership
News of World
55
27
12
6
28
52
Sunday Express
29
47
20
4
18
67
Sunday Mail
53
14
13
20
33
59
Sunday Mirror
72
16
9
3
56
62
Sunday Post
43
22
18
17
21
64
Sunday Telegraph
17
63
13
7
46
71
Mail on Sunday
25
53
17
5
28
65
The Observer
53
4
34
9
19
71
Sunday People
65
19
13
3
46
60
Sunday Times
29
40
24
7
11
67
Independent on Sunday
47
10
37
6
10
70
No Sunday paper
42
30
22
6
12
55
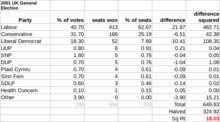
The disproportionality of the house of parliament in the 2001 election was 18.03 according to the Gallagher Index, mainly between Labour and the Liberal Democrats.
The politics of the United Kingdom functions within a constitutional monarchy where executive power is delegated by legislation and social conventions to a unitary parliamentary democracy. From this a hereditary monarch, currently King Charles III, serves as head of state while the Prime Minister of the United Kingdom, currently Rishi Sunak since 2022, serves as the elected head of government.
The 1997 United Kingdom general election was held on Thursday, 1 May 1997. The governing Conservative Party led by Prime Minister John Major was defeated in a landslide by the Labour Party led by Tony Blair, achieving a 179-seat majority.
The 1979 United Kingdom general election was held on Thursday 3 May 1979 to elect 635 members to the House of Commons.
The 1983 United Kingdom general election was held on Thursday 9 June 1983. It gave the Conservative Party under the leadership of Margaret Thatcher the most decisive election victory since that of the Labour Party in 1945, with a majority of 144 seats and the first of two consecutive landslide victories.
The 1987 United Kingdom general election was held on Thursday 11 June 1987, to elect 650 members to the House of Commons. The election was the third consecutive general election victory for the Conservative Party, who won a majority of 102 seats and second landslide under the leadership of Margaret Thatcher, who became the first Prime Minister since the Earl of Liverpool in 1820 to lead a party into three successive electoral victories.
The October 1974 United Kingdom general election took place on Thursday 10 October 1974 to elect 635 members of the British House of Commons. It was the second general election held that year; the first year that two general elections were held in the same year since 1910; and the first time that two general elections were held less than a year apart from each other since the 1923 and 1924 elections, which took place 10 months apart. The election resulted in the Labour Party, led by Prime Minister Harold Wilson, winning a bare majority of three seats. That enabled the remainder of the Labour government to take place, but it saw a gradual loss of its majority.
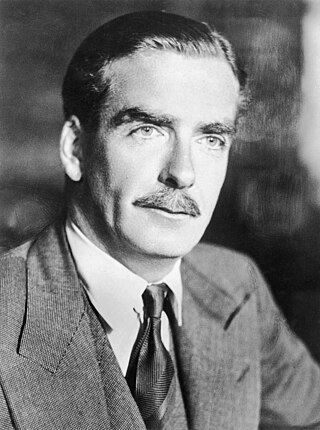
The 1955 United Kingdom general election was held on Thursday 26 May 1955, four years after the previous general election in 1951. It was a snap election: after Winston Churchill retired in April 1955, Anthony Eden took over and immediately called the election in order to gain a mandate for his government. It resulted in a majority of 60 seats for the government under new leader and Prime Minister Anthony Eden; the result remains the largest party share of the vote at a post-war general election. This was the first general election to be held with Elizabeth II as monarch. She had succeeded her father George VI the year after the previous election.
The 1959 United Kingdom general election was held on Thursday, 8 October 1959. It marked a third consecutive victory for the ruling Conservative Party, now led by Prime Minister Harold Macmillan. For the second time in a row, the Conservatives increased their overall majority in Parliament, this time to a landslide majority of 100 seats, having gained 20 seats for a return of 365. The Labour Party, led by Hugh Gaitskell, lost 19 seats and returned 258. The Liberal Party, led by Jo Grimond, again returned only six MPs to the House of Commons, but managed to increase its overall share of the vote to 5.9%, compared to just 2.7% four years earlier.
The 1997 Uxbridge by-election was a parliamentary by-election held in July 1997 to elect a new Member of Parliament (MP) for the constituency of Uxbridge in Greater London, England. The seat was held by the Conservative Party, their first such victory since 1989.
The 2005 United Kingdom general election was held on Thursday 5 May 2005, to elect 646 members to the House of Commons. The governing Labour Party, led by Tony Blair, won its third consecutive victory, with Blair becoming the second Labour leader after Harold Wilson to form three majority governments. However, its majority fell to 66 seats; the majority it won four years earlier had been of 167 seats. This was the first time the Labour Party had won a third consecutive election, and as of 2024 remains the party's most recent general election victory.
The 2010 United Kingdom general election was held on Thursday 6 May 2010, with 45,597,461 registered voters entitled to vote to elect members to the House of Commons. The election took place in 650 constituencies across the United Kingdom under the first-past-the-post system.
The Conservative Party is the oldest political party in the United Kingdom and arguably the world. The current party was first organised in the 1830s and the name "Conservative" was officially adopted, but the party is still often referred to as the Tory party. The Tories had been a coalition that more often than not formed the government from 1760 until the Reform Act 1832. Modernising reformers said the traditionalistic party of "Throne, Altar and Cottage" was obsolete, but in the face of an expanding electorate 1830s–1860s it held its strength among royalists, devout Anglicans and landlords and their tenants.
This is an overview of United Kingdom general election results since 1922. The 1922 election was the first election in the new United Kingdom of Great Britain and Northern Ireland, after the creation of the Irish Free State removed Southern Ireland from the UK.
The modern political history of the United Kingdom (1979–present) began when Margaret Thatcher gained power in 1979, giving rise to 18 years of Conservative government. Victory in the Falklands War (1982) and the government's strong opposition to trade unions helped lead the Conservative Party to another three terms in government. Thatcher initially pursued monetarist policies and went on to privatise many of Britain's nationalised companies such as British Telecom, British Gas Corporation, British Airways and British Steel Corporation. She kept the National Health Service. The controversial "poll tax" to fund local government was unpopular, and the Conservatives removed Thatcher as Prime Minister in 1990, although Michael Heseltine, the minister who did much to undermine her, did not personally benefit from her being ousted.
A general election was held in the United Kingdom on 6 May 2010 and all 59 seats in Scotland were contested. The election result in Scotland was unusual in that there wasn't any change of seats from the 2005 general election, although the Labour Party took back two seats that it had lost in by-elections. This was the most recent general election at which the Labour Party won a majority of seats and plurality of votes in Scotland.
The events surrounding the formation of the United Kingdom's government in 2010 took place between 7 May and 12 May 2010, following the 2010 general election, which failed to produce an overall majority for either of the country's two main political parties. The election, held on 6 May, resulted in the first hung parliament in the UK in 36 years, sparking a series of negotiations which would form the first coalition government since the Second World War.
The 2015 United Kingdom general election was held on Thursday 7 May 2015 to elect 650 Members of Parliament to the House of Commons. It was the only general election held under the rules of the Fixed-term Parliaments Act 2011 and was the last general election to be held before the United Kingdom would vote to end its membership of the European Union (EU). Local elections took place in most areas of England on the same day.
The 2019 United Kingdom general election was held on Thursday 12 December 2019 with 47,074,800 registered voters entitled to vote to elect members of the House of Commons. The Conservative Party won a landslide victory with a majority of 80 seats, a net gain of 48, on 43.6% of the popular vote, the highest percentage for any party since the 1979 general election.
This page is based on this Wikipedia article Text is available under the CC BY-SA 4.0 license; additional terms may apply. Images, videos and audio are available under their respective licenses.


