1929 United Kingdom general election

Last updated

1929 United Kingdom general election
Flag of the United Kingdom.svg
  1924 30 May 1929 1931  

All 615 seats in the House of Commons
308 seats needed for a majority
Turnout76.3%, Decrease2.svg 0.7 pp
 First partySecond partyThird party
  Ramsay MacDonald ggbain 35734.jpg Stanley Baldwin 1932.jpg David Lloyd George.jpg
Leader Ramsay MacDonald Stanley Baldwin David Lloyd George
Party Labour Conservative Liberal
Leader since 21 November 1922 23 May 192314 October 1926
Leader's seat Seaham Bewdley Caernarvon Boroughs
Last election151 seats, 33.3%412 seats, 46.8%40 seats, 17.8%
Seats won287260 [note 1] 59
Seat changeIncrease2.svg 136Decrease2.svg 152Increase2.svg 19
Popular vote8,048,9688,252,5275,104,638
Percentage37.1%38.1%23.6%
SwingIncrease2.svg 3.8 pp Decrease2.svg 8.7 pp Increase2.svg 5.8 pp

1929 UK general election map.svg
Colours denote the winning party—as shown in § Results

Prime Minister before election

Stanley Baldwin
Conservative

Prime Minister after election

Ramsay MacDonald
Labour

The 1929 United Kingdom general election was held on Thursday, 30 May 1929 and resulted in a hung parliament. Ramsay MacDonald's Labour Party won the most seats in the House of Commons for the first time despite receiving fewer votes than the Conservative Party, led by Prime Minister Stanley Baldwin. The Liberal Party led again by former Prime Minister David Lloyd George regained some ground lost in the 1924 general election and held the balance of power. Parliament was dissolved on 10 May. [1]

Contents

The election was often referred to as the "Flapper Election", because it was the first in which women aged 21–29 had the right to vote (owing to the Representation of the People Act 1928). Women over 30, with some property qualifications, had been able to vote since the 1918 general election, but the 1929 vote was the first general election with universal suffrage for adults over 21, which was then the age of majority.

The election was fought against a background of rising unemployment, with the memory of the 1926 general strike still fresh in voters' minds. By 1929, the Cabinet was being described by many as "old and exhausted". [2]

The Liberals campaigned on a comprehensive programme of public works under the title "We Can Conquer Unemployment". There was anticipation of a potential revival of the Liberal Party after the reunification of Independent Liberals and National Liberals now under Lloyd George's leadership since 1926 and following some victories in a series of recent by-elections after 1926. [3] The incumbent Conservatives campaigned on the theme of "Safety First", with Labour campaigning on the theme of "Labour & the Nation".

This was the first general election to be contested by the newly formed Welsh nationalist party Plaid Cymru.

It stood as the last time when a third party polled more than one-fifth of the popular vote until 1983. The Liberals performed more successfully than at the previous general election in 1924, but could not regain its pre-World War I status as a party of government. [3] The next election thus ushered in five decades in which two-party politics dominated.

Results

1929 UK parliament.svg
UK General Election 1929
CandidatesVotes
PartyLeaderStoodElectedGainedUnseatedNet % of total %No.Net %
  Conservative Stanley Baldwin 590260215415242.338.18,252,5278.7
  Labour Ramsay MacDonald 5692871404+13646.737.18,048,968+3.8
  Liberal David Lloyd George 513593617+199.623.65,104,638+5.8
  Independent N/A11431+20.80.494,742+0.2
  Communist Harry Pollitt 2500 1 10.247,5540.1
  Ind. Conservative N/A800000.246,278
  Scottish Prohibition Edwin Scrymgeour 1 1 0000.20.125,037+0.1
  Nationalist Joseph Devlin 32 2 0+20.50.124,177+0.1
  Independent Labour N/A4 1 1 0+10.20.120,825+0.1
  Independent Liberal N/A200000.117,110+0.1
  National (Scotland) Roland Muirhead 200000.03,313N/A
  Plaid Cymru Saunders Lewis 1 00000.0609N/A
  Irish Nationalist T. P. O'Connor 1 10000.00N/A

Votes summary

Popular vote
Conservative
38.06%
Labour
37.12%
Liberal
23.54%
Others
1.28%

Seats summary

Parliamentary seats
Labour
46.67%
Conservative
42.28%
Liberal
9.59%
Others
1.46%

Constituency results

Transfers of seats

ToFromNo.Seats
Independent Labour Labour 1 Govan*
Labour Communist 1 Battersea North
Liberal 15 Chesterfield, South Shields, Walthamstow West, Bristol North, Bristol South, Kingston upon Hull Central*, Blackburn (one of two), Oldham (one of two), Hackney South, Lambeth North, Bradford East, Batley and Morley, Wrexham, Carmarthen, Swansea West
Constitutionalist 3 Walthamstow East 1, Accrington 2, Stoke 2
Conservative 121 Stirlingshire West, Dunbartonshire, Lanark, Partick, Lanarkshire North†, Renfrewshire West, Maryhill, Kilmarnock, Edinburgh West, Linlithgow†, Berwick & Haddington, Reading, Birkenhead West, Crewe, Stalybridge and Hyde, Stockport (one of two)†, Carlisle, Whitehaven, Derby (one of two), Belper, Derbyshire South, Drake, Barnard Castle, Sedgefield, Darlington†, Stockton-on-Tees, Sunderland (both seats), Leyton East, East Ham North, Essex SE, Leyton West, Romford, Upton, Bristol Central, Portsmouth Central, Southampton (both seats), Dudley, Stourbridge†, Kingston upon Hull East, Kingston upon Hull South West, Chatham, Dartford, Blackburn (one of two), Ormskirk, Rossendale, Ashton-under-Lyne†, Bolton (both seats), Eccles, Hulme, Oldham (one of two), Salford North, Salford South, Salford West, Bootle, Everton, Kirkdale, Warrington, Widnes, Leicester East, Loughborough, Brigg, Fulham West, Hammersmith South, Islington North, Kensington North, Battersea South†, Greenwich, Islington East, Camberwell North-West, Hackney Central, Kennington, Hammersmith North†, St Pancras North, St Pancras South East, St Pancras South West, Wandsworth Central, Norfolk South West, Norwich (one of two), Kettering, Northampton†, Peterborough, Bassetlaw, Nottingham South, The Wrekin, Frome, Lichfield, Walsall, Wolverhampton West, Nuneaton, Duddeston, Coventry, Aston, Deritend, Erdington, Ladywood, Yardley, Swindon, York, Cleveland, Acton, Enfield, Tottenham South, Sheffield Central, Bradford North, Leeds Central, Sowerby, Wakefield, Sheffield Park, Bradford Central, Pontefract, Newport (Monmouthshire), Brecon and Radnor, Llandaff & Barry, Cardiff Central, Cardiff East, Cardiff South
Speaker 1 Halifax
Independent 1 Mossley
Labour gains:142
Liberal Labour 2 Bethnal Green North-East, Newcastle upon Tyne East
Constitutionalist 2 Camborne, Heywood and Radcliffe*
Conservative 32 Banff, Aberdeenshire West and Kincardine, Fife East, Dumfriesshire, Galloway, Bedfordshire Mid, Luton, Huntingdonshire, Isle of Ely, Birkenhead East, Eddisbury, Bodmin, Cornwall North, Penryn and Falmouth, St Ives†, South Molton, Dorset East, Harwich, Hereford, Ashford, Darwen, Preston (one of two), Blackley, Withington, Bosworth†, Holland with Boston†, Great Yarmouth, Norfolk East, Nottingham East, Eye, Flintshire, Pembrokeshire
Liberal gains:36
Conservative Labour 1 King's Norton
Constitutionalist 1 Epping*
Conservative gains:2
Independent Constitutionalist 1 Stretford*
Conservative 2 Combined English Universities (one of two), Exeter*
Nationalist Ulster Unionist 2 Fermanagh and Tyrone (both seats)
1 Previous MP had defected to the Conservatives by the 1929 election
2 Previous MP had defected to the Liberals by the 1929 election

See also

Related Research Articles

<span class="mw-page-title-main">1979 United Kingdom general election</span>

The 1979 United Kingdom general election was held on Thursday 3 May 1979 to elect 635 members to the House of Commons.

<span class="mw-page-title-main">1983 United Kingdom general election</span> British 1983 election

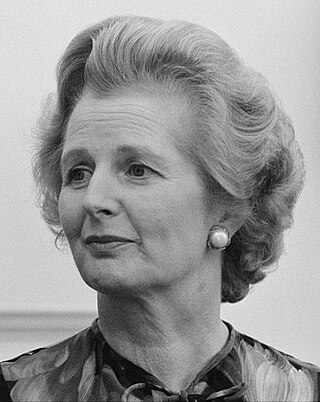
The 1983 United Kingdom general election was held on Thursday 9 June 1983. It gave the Conservative Party under the leadership of Margaret Thatcher the most decisive election victory since that of the Labour Party in 1945, with a majority of 144 seats and the first of two consecutive landslide victories.

<span class="mw-page-title-main">1987 United Kingdom general election</span>

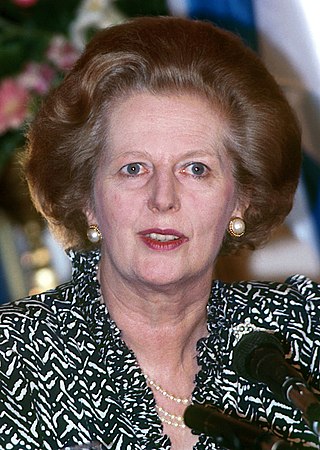
The 1987 United Kingdom general election was held on Thursday 11 June 1987, to elect 650 members to the House of Commons. The election was the third consecutive general election victory for the Conservative Party, who won a majority of 102 seats and second landslide under the leadership of Margaret Thatcher, who became the first Prime Minister since the Earl of Liverpool in 1820 to lead a party into three successive electoral victories.

<span class="mw-page-title-main">February 1974 United Kingdom general election</span>

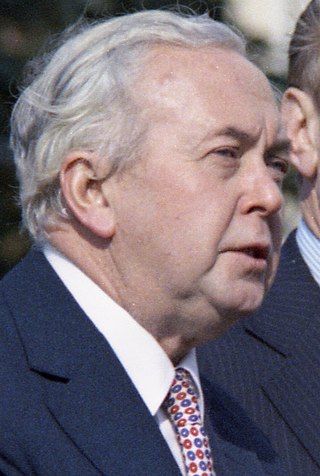
The February 1974 United Kingdom general election was held on Thursday 28 February 1974. The Labour Party, led by Leader of the Opposition and former Prime Minister Harold Wilson, gained 14 seats but was seventeen short of an overall majority. The Conservative Party, led by incumbent Prime Minister Edward Heath, lost 28 seats. That resulted in a hung parliament, the first since 1929. Heath sought a coalition with the Liberals, but the two parties failed to come to an agreement and so Wilson became Prime Minister for a second time, his first with a minority government. Wilson called another early election in September, which was held in October and resulted in a Labour majority. The February election was also the first general election to be held with the United Kingdom as a member state of the European Communities (EC), which was widely known as the "Common Market".

<span class="mw-page-title-main">October 1974 United Kingdom general election</span>

The October 1974 United Kingdom general election took place on Thursday 10 October 1974 to elect 635 members of the British House of Commons. It was the second general election held that year; the first year that two general elections were held in the same year since 1910; and the first time that two general elections were held less than a year apart from each other since the 1923 and 1924 elections, which took place 10 months apart. The election resulted in the Labour Party, led by Prime Minister Harold Wilson, winning a bare majority of three seats. That enabled the remainder of the Labour government to take place, but it saw a gradual loss of its majority.

<span class="mw-page-title-main">1945 United Kingdom general election</span>

The 1945 United Kingdom general election was a national election held on Thursday 5 July 1945, but polling in some constituencies was delayed by some days, and the counting of votes was delayed until 26 July to provide time for overseas votes to be brought to Britain. The governing Conservative Party sought to maintain its position in Parliament but faced challenges from public opinion about the future of the United Kingdom in the post-war period. Prime Minister Winston Churchill proposed to call for a general election in Parliament, which passed with a majority vote less than two months after the conclusion of the Second World War in Europe.

<span class="mw-page-title-main">1964 United Kingdom general election</span>

The 1964 United Kingdom general election was held on Thursday 15 October 1964. It resulted in the Conservatives, led by incumbent Prime Minister Alec Douglas-Home, narrowly losing to the Labour Party, led by Harold Wilson; Labour secured a parliamentary majority of four seats and ended its thirteen years in opposition since the 1951 election. Wilson became the youngest Prime Minister since Lord Rosebery in 1894. To date, this is also the most narrow majority obtained in the House of Commons, with just one seat clearing Labour for a majority government.

<span class="mw-page-title-main">1950 United Kingdom general election</span>

The 1950 United Kingdom general election was the first ever to be held after a full term of Labour government. The election was held on Thursday 23 February 1950, and was the first held following the abolition of plural voting and university constituencies. The government's 1945 lead over the Conservative Party shrank dramatically, and Labour was returned to power but with an overall majority reduced from 146 to just 5. There was a 2.8% national swing towards the Conservatives, who gained 90 seats. Labour called another general election in 1951, which the Conservative Party won.

<span class="mw-page-title-main">1955 United Kingdom general election</span>

The 1955 United Kingdom general election was held on Thursday 26 May 1955, four years after the previous general election in 1951. It was a snap election: after Winston Churchill retired in April 1955, Anthony Eden took over and immediately called the election in order to gain a mandate for his government. It resulted in a majority of 60 seats for the government under new leader and Prime Minister Anthony Eden; the result remains the largest party share of the vote at a post-war general election. This was the first general election to be held with Elizabeth II as monarch. She had succeeded her father George VI the year after the previous election.

<span class="mw-page-title-main">1959 United Kingdom general election</span> 8 October 1959

The 1959 United Kingdom general election was held on Thursday, 8 October 1959. It marked a third consecutive victory for the ruling Conservative Party, now led by Prime Minister Harold Macmillan. For the second time in a row, the Conservatives increased their overall majority in Parliament, this time to a landslide majority of 100 seats, having gained 20 seats for a return of 365. The Labour Party, led by Hugh Gaitskell, lost 19 seats and returned 258. The Liberal Party, led by Jo Grimond, again returned only six MPs to the House of Commons, but managed to increase its overall share of the vote to 5.9%, compared to just 2.7% four years earlier.

<span class="mw-page-title-main">1935 United Kingdom general election</span>

The 1935 United Kingdom general election was held on Thursday 14 November, and resulted in a large, albeit reduced, majority for the National Government now led by Stanley Baldwin of the Conservative Party. The greatest number of members, as before, were Conservatives, while the National Liberal vote held steady. The much smaller National Labour vote also held steady but the resurgence in the main Labour vote caused over a third of their MPs, including National Labour leader Ramsay MacDonald, to lose their seats. It was the last election in which a party or alliance won a majority of the votes cast.

<span class="mw-page-title-main">1931 United Kingdom general election</span> General election in the UK

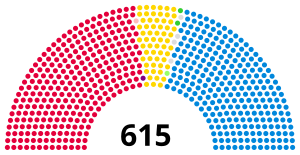
The 1931 United Kingdom general election was held on Tuesday 27 October 1931 and saw a landslide election victory for the National Government which had been formed two months previously after the collapse of the second Labour government. Collectively, the parties forming the National Government won 67% of the votes and 554 seats out of 615. Although the bulk of the National Government's support came from the Conservative Party and the Conservatives won 470 seats, National Labour leader Ramsay MacDonald remained as Prime Minister. The Labour Party suffered its greatest defeat, losing four out of every five seats compared with the previous election, including the seat of its leader Arthur Henderson. Ivor Bulmer-Thomas said the results "were the most astonishing in the history of the British party system". It is the most recent election in which one party received an absolute majority of the votes cast, and the last UK general election not to take place on a Thursday. It would be the last election until 1997 in which a party won over 400 seats in the House of Commons.

<span class="mw-page-title-main">1924 United Kingdom general election</span>

The 1924 United Kingdom general election was held on Wednesday 29 October 1924, as a result of the defeat of the Labour minority government, led by Prime Minister Ramsay MacDonald, in the House of Commons on a motion of no confidence. It was the third general election to be held in less than two years. Parliament was dissolved on 9 October.

<span class="mw-page-title-main">1923 United Kingdom general election</span>

The 1923 United Kingdom general election was held on Thursday 6 December 1923. The Conservatives, led by Prime Minister Stanley Baldwin, won the most seats, but Labour, led by Ramsay MacDonald, and H. H. Asquith's reunited Liberal Party gained enough seats to produce a hung parliament. It is the most recent UK general election in which a third party won over 100 seats. The Liberals' percentage of the vote, 29.7%, has not been exceeded by a third party at any general election since.

<span class="mw-page-title-main">1922 United Kingdom general election</span>

The 1922 United Kingdom general election was held on Wednesday 15 November 1922. It was won by the Conservative Party, led by Prime Minister Andrew Bonar Law, which gained an overall majority over the Labour Party, led by J. R. Clynes, and a divided Liberal Party.

Parliamentary by-elections in the United Kingdom occur when a Member of Parliament (MP) vacates a House of Commons seat during the course of a parliament.

The 1926 Darlington by-election was a by-election held on 17 February 1926 for the British House of Commons constituency of Darlington in County Durham.

The 1930 Bromley by-election was a parliamentary by-election held on 2 September 1930 for the British House of Commons constituency of Bromley in north-west Kent.

The 1928 Carmarthen by-election was a parliamentary by-election held for the British House of Commons constituency of Carmarthen in West Wales on 28 June 1928.

The 1928 Middlesbrough West by-election was a parliamentary by-election held for the British House of Commons constituency of Middlesbrough West on 7 March 1928.

References

  1. "Parliamentary Election Timetables" (PDF) (3rd ed.). House of Commons Library. 25 March 1997. Retrieved 3 July 2022.
  2. Doerr 1998, pp. 104–5.
  3. 1 2 Campbell, John (2010). Pistols at Dawn: Two Hundred Years of Political Rivalry from Pitt and Fox to Blair and Brown. London: Vintage. p. 192. ISBN   978-1-84595-091-0. OCLC   489636152.
  4. Tetteh, Edmund (1 February 2008). "Election Statistics: UK 1918-2007" (PDF). parliament.uk. Archived from the original (PDF) on 8 July 2014. Retrieved 23 May 2014.
  1. The seat and vote count figures for the Conservatives given here include the Speaker of the House of Commons

Sources

  • Craig, F. W. S. (1989), British Electoral Facts: 1832–1987, Dartmouth: Gower, ISBN   0900178302
  • Doerr, Paul W. (1998), British foreign policy 1919–1939, Manchester: Manchester University Press, ISBN   0719046718

Further reading

Manifestos