Edinburgh West | |
---|---|
Burgh constituency for the House of Commons | |
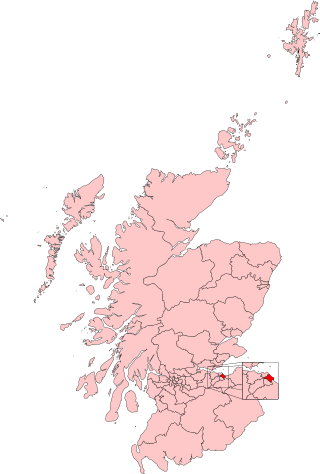
Subdivisions of Scotland | City of Edinburgh |
Major settlements | Edinburgh (part) and South Queensferry |
Current constituency | |
Created | 1885 |
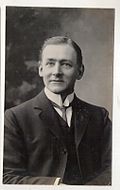
Member of Parliament | Christine Jardine (Liberal Democrats) |
Created from | Edinburgh |
Edinburgh West is a burgh constituency of the House of Commons of the Parliament of the United Kingdom, first contested at the 1885 general election. [n 1]
Prior to the 2005 general election, the boundaries were the same as the eponymous constituency of the Scottish Parliament, which had been created in 1999.
This commuter belt seat, distinctively in the city, was Unionist/Conservative for over 65 years, from the 1931 general election until the 1997 general election, although the Liberal/SDP Alliance and later the Liberal Democrats repeatedly came close to winning in the 1980s and early 1990s. After 1997, the seat was held by the Liberal Democrats until the 2015 general election. The Member of Parliament (MP) between the 2015 and 2017 general elections was Michelle Thomson, who was elected for the Scottish National Party (SNP) in May 2015. In September 2015, she resigned the party whip and sat as an Independent. Thomson chose not to seek reelection either for the SNP or as an Independent candidate. [1] At the 2017 general election, Christine Jardine of the Liberal Democrats gained the seat with a majority of 2,988 votes.
The seat has been relative to others a marginal seat since 2005, as the winner's majority has not exceeded 8.2% of the vote since the 30% majority won in that year. The seat has changed hands twice electorally since that year and once through resigning the party whip.
This is an affluent, left-leaning and pro-European seat [2] covering the northwestern portion of Edinburgh. It is mostly suburban, but takes in rural areas within the council area including Kirkliston and South Queensferry. Edinburgh Airport and Murrayfield Stadium are within the seat.
1885–1918: The St. Andrew, St. Stephen, St. Bernard and St. Luke wards of the municipal burgh of Edinburgh. [3]
1918–1950: The Dalry, Gorgie, Haymarket and St. Bernard's wards of the county of the city of Edinburgh. [4]
1950–1955: The Corstorphine, Murrayfield-Cramond, St. Bernard's and Pilton wards of the county of the city of Edinburgh. [5]
1955–1974: The Corstorphine (with the exception of the area added by the Edinburgh Corporation Order Confirmation Act 1954), Murrayfield-Cramond, and Pilton wards of the county of the city of Edinburgh, and part of the St. Bernard's ward. [6]
1974–1983: The Corstorphine and Murrayfield-Cramond wards of the county of the city of Edinburgh, and that part of Pilton ward which is not included in the Edinburgh Leith constituency. [7]
1983–1997: Electoral divisions 11 (Cramond/Parkgrove), 15 (Corstorphine North), 16 (Telford/Blackhall), 19 (Corstorphine South) and 26 (Moat/Stenhouse) in the City of Edinburgh. [8]
1997–2005: Electoral divisions 11 (Queensferry/Kirkliston), 12 (Cramond/Blackhall), 13 (Drylaw/Muirhouse), 16 (Corstorphine North), and 21 (Corstorphine South) in the City of Edinburgh. [9]
The seat was created when the Edinburgh constituency was abolished, in 1885, replaced by four seats: Edinburgh East, Edinburgh Central, Edinburgh South and Edinburgh West. The Central constituency was abolished in 2005. The East constituency was abolished in 1997, but a new Edinburgh East was created in 2005. The South and West constituencies have been in continuous use (with alterations to boundaries) since 1885.
Before the 2005 general election, the seat was one of six covering the City of Edinburgh council area. Five were entirely within the city council area. One, Edinburgh East and Musselburgh, straddled the boundary with the East Lothian council area to take in Musselburgh.
Constituency boundaries were revised for the 2005 election: Edinburgh West was enlarged, to include an area formerly within Edinburgh Central, and became one of five seats covering the city area. [10]
From 1997 to 2007 the seat comprised the following wards: Cramond, Dalmeny and Kirkliston, Davidson's Mains, East Craigs, Gyle, Muirhouse and Drylaw, Murrayfield, North East Corstorphine, Queensferry, South East Corstorphine and Stenhouse.
As of 2007, as a result of the Local Governance (Scotland) Act 2004, none of the new Edinburgh wards were wholly within the constituency. Almond and Corstorphine/Murrayfield are almost entirely within it except for a small corner of each one. The constituency also includes a majority of Drum Brae/Gyle, a minority of Pentland Hills and small sections of Forth, Inverleith, City Centre and Sighthill/Gorgie.
Party | Candidate | Votes | % | ±% | |
---|---|---|---|---|---|
Labour | Michael Davidson [12] | ||||
Liberal Democrats | Christine Jardine [13] | ||||
Scottish Green | James Puchowski [14] | ||||
Majority | |||||
Turnout | |||||
Registered electors | |||||
Swing | |||||
Party | Candidate | Votes | % | ±% | |
---|---|---|---|---|---|
Liberal Democrats | Christine Jardine | 21,766 | 39.9 | +5.6 | |
Scottish National | Sarah Masson | 17,997 | 33.0 | +4.4 | |
Conservative | Graham Hutchison | 9,283 | 17.0 | –4.9 | |
Labour | Craig Bolton | 4,460 | 8.2 | –6.7 | |
Scottish Green | Elaine Gunn | 1,027 | 1.9 | New | |
Majority | 3,769 | 6.9 | +1.2 | ||
Turnout | 54,533 | 75.2 | +1.4 | ||
Registered electors | 72,507 | +1.4 | |||
Liberal Democrats hold | Swing | +0.6 | |||
Party | Candidate | Votes | % | ±% | |
---|---|---|---|---|---|
Liberal Democrats | Christine Jardine | 18,108 | 34.3 | +1.2 | |
Scottish National | Toni Giugliano | 15,120 | 28.6 | –10.4 | |
Conservative | Sandy Batho | 11,559 | 21.9 | +9.6 | |
Labour | Mandy Telford | 7,876 | 14.9 | +3.2 | |
Scotland's Independence Referendum Party | Mark Whittet | 132 | 0.3 | New | |
Majority | 2,988 | 5.7 | N/A | ||
Turnout | 52,795 | 73.8 | –2.7 | ||
Registered electors | c.71,500 | ||||
Liberal Democrats gain from Scottish National | Swing | +5.8 | |||
Party | Candidate | Votes | % | ±% | |
---|---|---|---|---|---|
Scottish National | Michelle Thomson | 21,378 | 39.0 | +25.8 | |
Liberal Democrats | Mike Crockart | 18,168 | 33.1 | –2.8 | |
Conservative | Lindsay Paterson | 6,732 | 12.3 | –10.9 | |
Labour | Cameron Day | 6,425 | 11.7 | –16.0 | |
Scottish Green | Pat Black | 1,140 | 2.1 | New | |
UKIP | Otto Inglis | 1,015 | 1.9 | New | |
Majority | 3,210 | 5.9 | N/A | ||
Turnout | 54,858 | 76.5 | +5.2 | ||
Scottish National gain from Liberal Democrats | Swing | +14.3 | |||
Party | Candidate | Votes | % | ±% | |
---|---|---|---|---|---|
Liberal Democrats | Mike Crockart | 16,684 | 35.9 | –13.6 | |
Labour | Cameron Day | 12,881 | 27.7 | +9.1 | |
Conservative | Stewart Geddes | 10,767 | 23.2 | +3.7 | |
Scottish National | Sheena M. Cleland | 6,115 | 13.2 | +4.1 | |
Majority | 3,803 | 8.2 | –21.8 | ||
Turnout | 46,447 | 71.3 | +2.4 | ||
Liberal Democrats hold | Swing | –11.4 | |||
Party | Candidate | Votes | % | ±% | |
---|---|---|---|---|---|
Liberal Democrats | John Barrett | 22,417 | 49.5 | +11.2 | |
Conservative | David A. Brogan | 8,817 | 19.5 | −2.2 | |
Labour | Navraj Singh Ghaleigh | 8,433 | 18.6 | −7.9 | |
Scottish National | Sheena M. Cleland | 4,124 | 9.1 | −1.6 | |
Scottish Green | Ailsa Spindler | 964 | 2.1 | New | |
Scottish Socialist | Gary P. Clark | 510 | 1.1 | −1.0 | |
Majority | 13,600 | 30.0 | +10.7 | ||
Turnout | 45,265 | 68.9 | +5.7 | ||
Liberal Democrats hold | Swing | +6.7 | |||
Party | Candidate | Votes | % | ±% | |
---|---|---|---|---|---|
Liberal Democrats | John Barrett | 16,719 | 42.4 | −0.8 | |
Labour | Elspeth Alexandra | 9,130 | 23.1 | +4.3 | |
Conservative | Iain Whyte | 8,894 | 22.5 | −5.5 | |
Scottish National | Alyn Smith | 4,047 | 10.3 | +1.5 | |
Scottish Socialist | Bill Scott | 688 | 1.7 | New | |
Majority | 7,589 | 19.3 | +4.1 | ||
Turnout | 39,478 | 63.2 | −14.7 | ||
Liberal Democrats hold | Swing | +2.6 | |||
Party | Candidate | Votes | % | ±% | |
---|---|---|---|---|---|
Liberal Democrats | Donald Gorrie | 20,578 | 43.2 | +13.3 | |
Conservative | James Douglas-Hamilton | 13,325 | 28.0 | −10.2 | |
Labour | Lesley Hinds | 8,948 | 18.8 | +1.4 | |
Scottish National | Graham D. Sutherland | 4,210 | 8.8 | -3.7 | |
Referendum | Stephen C. Elphick | 277 | 0.6 | New | |
Liberal | Paul N. Coombes | 263 | 0.5 | −0.1 | |
Independent | Antony C.O. Jack | 30 | 0.1 | New | |
Majority | 7,253 | 15.2 | N/A | ||
Turnout | 47,631 | 77.9 | -2.7 | ||
Liberal Democrats gain from Conservative | Swing | +11.8 | |||
Party | Candidate | Votes | % | ±% | |
---|---|---|---|---|---|
Conservative | James Douglas-Hamilton | 18,071 | 37.0 | −0.4 | |
Liberal Democrats | Donald Gorrie | 17,192 | 35.2 | +0.3 | |
Labour | Irene A. Kitson | 8,759 | 18.0 | −4.2 | |
Scottish National | Graham D. Sutherland | 4,117 | 8.4 | +2.8 | |
Liberal | Alan R. Fleming | 272 | 0.6 | New | |
Scottish Green | Linda Hendry | 234 | 0.5 | New | |
BNP | David J. Bruce | 133 | 0.3 | New | |
Majority | 879 | 1.8 | −0.7 | ||
Turnout | 48,778 | 82.6 | +3.2 | ||
Conservative hold | Swing | −0.4 | |||
Party | Candidate | Votes | % | ±% | |
---|---|---|---|---|---|
Conservative | James Douglas-Hamilton | 18,450 | 37.4 | -0.8 | |
Liberal | Derek G. King | 17,216 | 34.9 | -2.2 | |
Labour | Michael McGregor | 10,957 | 22.2 | +2.1 | |
Scottish National | Norman Irons | 2,774 | 5.6 | +1.0 | |
Majority | 1,234 | 2.5 | +1.4 | ||
Turnout | 49,397 | 79.4 | +3.7 | ||
Conservative hold | Swing | +0.7 | |||
Party | Candidate | Votes | % | ±% | |
---|---|---|---|---|---|
Conservative | James Douglas-Hamilton | 17,646 | 38.2 | -5.4 | |
Liberal | Derek G. King | 17,148 | 37.1 | +17.6 | |
Labour | Alec Wood | 9,313 | 20.1 | -9.2 | |
Scottish National | John Nicoll | 2,126 | 4.6 | -2.9 | |
Majority | 498 | 1.1 | -16.0 | ||
Turnout | 46,233 | 75.7 | -2.1 | ||
Conservative hold | Swing | ||||
Party | Candidate | Votes | % | ±% | |
---|---|---|---|---|---|
Conservative | James Douglas-Hamilton | 19,360 | 45.44 | +7.29 | |
Labour | Michael C.B. McGregor | 12,009 | 28.19 | +2.97 | |
Liberal | R Callendar | 7,330 | 17.21 | +0.80 | |
Scottish National | Colin Bell | 3,904 | 9.16 | -11.05 | |
Majority | 7,351 | 17.25 | +4.32 | ||
Turnout | 42,603 | 77.80 | +1.24 | ||
Conservative hold | Swing | ||||
Party | Candidate | Votes | % | ±% | |
---|---|---|---|---|---|
Conservative | James Douglas-Hamilton | 15,354 | 38.15 | -6.06 | |
Labour | WJ Taylor | 10,152 | 25.22 | +0.83 | |
Scottish National | Catherina McMillan Moore | 8,135 | 20.21 | +10.29 | |
Liberal | Donald Gorrie | 6,606 | 16.41 | -5.08 | |
Majority | 5,202 | 12.93 | |||
Turnout | 40,247 | 76.56 | |||
Conservative hold | Swing | ||||
Party | Candidate | Votes | % | ±% | |
---|---|---|---|---|---|
Conservative | Anthony Stodart | 18,908 | 44.21 | -7.7 | |
Labour | WJ Taylor | 10,431 | 24.39 | -8.8 | |
Liberal | Donald Gorrie | 9,189 | 21.49 | +13.4 | |
Scottish National | Catherina McMillan Moore | 4,241 | 9.92 | +3.1 | |
Majority | 8,477 | 19.82 | |||
Turnout | 42,769 | 82.18 | |||
Conservative hold | Swing | ||||
Party | Candidate | Votes | % | ±% | |
---|---|---|---|---|---|
Conservative | Anthony Stodart | 26,864 | 49.23 | +0.94 | |
Labour | George Foulkes | 19,523 | 35.78 | -2.18 | |
Liberal | Donald Gorrie | 4,467 | 8.19 | -4.56 | |
Scottish National | Muriel Gibson | 3,711 | 6.80 | New | |
Majority | 7,341 | 13.45 | +4.12 | ||
Turnout | 54,565 | 74.95 | |||
Conservative hold | Swing | ||||
Party | Candidate | Votes | % | ±% | |
---|---|---|---|---|---|
Conservative | Anthony Stodart | 24,882 | 48.29 | -2.27 | |
Labour Co-op | Dick Douglas | 20,073 | 38.96 | +3.66 | |
Liberal | James R Telfer | 6,571 | 12.75 | -1.39 | |
Majority | 4,809 | 9.33 | |||
Turnout | 51,526 | 78.66 | |||
Conservative hold | Swing | ||||
Party | Candidate | Votes | % | ±% | |
---|---|---|---|---|---|
Unionist | Anthony Stodart | 26,298 | 50.56 | -5.93 | |
Labour | James K Stocks | 18,359 | 35.30 | +4.76 | |
Liberal | James R Telfer | 7,352 | 14.14 | +1.17 | |
Majority | 7,939 | 15.26 | |||
Turnout | 52,009 | 80.91 | |||
Unionist hold | Swing | ||||
Party | Candidate | Votes | % | ±% | |
---|---|---|---|---|---|
Unionist | Anthony Stodart | 25,976 | 56.49 | -10.55 | |
Labour | James K Stocks | 14,044 | 30.54 | -2.42 | |
Liberal | Donald Leach | 5,962 | 12.97 | New | |
Majority | 11,932 | 25.95 | |||
Turnout | 45,982 | 80.26 | |||
Unionist hold | Swing | ||||
Party | Candidate | Votes | % | ±% | |
---|---|---|---|---|---|
Unionist | Ian Clark Hutchison | 26,000 | 67.04 | +1.1 | |
Labour | James Alexander Cuthburt Thomson | 12,784 | 32.96 | -1.0 | |
Majority | 13,216 | 34.0 | +2.1 | ||
Turnout | 38,784 | 75.7 | -5.4 | ||
Unionist hold | Swing | ||||
Party | Candidate | Votes | % | ±% | |
---|---|---|---|---|---|
Unionist | Ian Clark Hutchison | 30,232 | 65.95 | ||
Labour | Harry S Wilson | 15,607 | 34.05 | ||
Majority | 14,625 | 31.90 | |||
Turnout | 45,839 | 83.12 | |||
Unionist hold | Swing | ||||
Party | Candidate | Votes | % | ±% | |
---|---|---|---|---|---|
Unionist | Ian Clark Hutchison | 26,978 | 60.03 | ||
Labour Co-op | C Morgan | 14,377 | 31.99 | ||
Liberal | Margaret Walker | 3,586 | 7.98 | ||
Majority | 12,601 | 28.04 | |||
Turnout | 44,941 | 82.79 | |||
Unionist hold | Swing | ||||
Party | Candidate | Votes | % | ±% | |
---|---|---|---|---|---|
Unionist | Ian Clark Hutchison | 19,894 | 47.38 | -19.6 | |
Labour | Gordon Stott | 18,840 | 44.87 | +11.9 | |
Liberal | John Gibson Thomson | 3,256 | 7.75 | New | |
Majority | 1,054 | 2.51 | -31.5 | ||
Turnout | 41,990 | 67.68 | -1.4 | ||
Unionist hold | Swing | ||||
Party | Candidate | Votes | % | ±% | |
---|---|---|---|---|---|
Unionist | Ian Clark Hutchison | Unopposed | N/A | N/A | |
Party | Candidate | Votes | % | ±% | |
---|---|---|---|---|---|
Unionist | Thomas Cooper | 28,023 | 67.01 | ||
Labour | John Welch | 13,794 | 32.99 | ||
Majority | 14,229 | 34.02 | |||
Turnout | 41,817 | 69.10 | |||
Unionist hold | Swing | ||||
Party | Candidate | Votes | % | ±% | |
---|---|---|---|---|---|
Unionist | Thomas Cooper | 16,373 | 53.0 | -18.2 | |
Labour | William McAdam | 10,462 | 33.9 | +5.1 | |
Liberal | George Paish | 4,059 | 13.1 | New | |
Majority | 5,911 | 19.1 | -23.3 | ||
Turnout | 30,894 | 51.2 | -28.0 | ||
Unionist hold | Swing | ||||
Party | Candidate | Votes | % | ±% | |
---|---|---|---|---|---|
Unionist | Wilfrid Normand | 31,407 | 71.20 | +39.5 | |
Labour | George Mathers | 12,704 | 28.80 | -10.2 | |
Majority | 18,703 | 42.40 | N/A | ||
Turnout | 44,111 | 79.18 | +4.4 | ||
Unionist gain from Labour | Swing | ||||
Party | Candidate | Votes | % | ±% | |
---|---|---|---|---|---|
Labour | George Mathers | 15,795 | 38.6 | +5.5 | |
Unionist | Wilfrid Normand | 12,966 | 31.7 | −4.9 | |
Liberal | Vivian Phillipps | 12,126 | 29.7 | −0.6 | |
Majority | 2,829 | 6.9 | N/A | ||
Turnout | 40,887 | 74.8 | −4.5 | ||
Registered electors | 54,695 | ||||
Labour gain from Unionist | Swing | +5.2 | |||
Party | Candidate | Votes | % | ±% | |
---|---|---|---|---|---|
Unionist | Ian Macintyre | 10,628 | 36.6 | +3.6 | |
Labour | George Mathers | 9,603 | 33.1 | +7.4 | |
Liberal | Vivian Phillipps | 8,790 | 30.3 | −11.0 | |
Majority | 1,025 | 3.5 | N/A | ||
Turnout | 29,021 | 79.3 | +4.9 | ||
Registered electors | 36,618 | ||||
Unionist gain from Liberal | Swing | −1.9 | |||
Party | Candidate | Votes | % | ±% | |
---|---|---|---|---|---|
Liberal | Vivian Phillipps | 11,010 | 41.3 | −10.1 | |
Unionist | Ian Macintyre | 8,778 | 33.0 | −15.6 | |
Labour | George Mathers | 6,836 | 25.7 | New | |
Majority | 2,232 | 8.3 | +5.5 | ||
Turnout | 26,624 | 74.4 | +5.5 | ||
Registered electors | 35,809 | ||||
Liberal hold | Swing | +2.8 | |||
Party | Candidate | Votes | % | ±% | |
---|---|---|---|---|---|
Liberal | Vivian Phillipps | 12,355 | 51.4 | +16.9 | |
Unionist | John Gordon Jameson | 11,689 | 48.6 | −2.2 | |
Majority | 666 | 2.8 | N/A | ||
Turnout | 24,044 | 68.9 | +15.6 | ||
Registered electors | 34,899 | ||||
Liberal gain from Unionist | Swing | +9.6 | |||
Party | Candidate | Votes | % | ±% | |
---|---|---|---|---|---|
C | Unionist | John Gordon Jameson | 9,172 | 50.8 | −3.0 |
Liberal | Edward Parrott | 6,220 | 34.5 | −11.7 | |
Labour | John Alexander Young | 2,642 | 14.7 | New | |
Majority | 2,952 | 16.3 | +8.7 | ||
Turnout | 18,034 | 53.3 | −37.1 | ||
Registered electors | 33,835 | ||||
Unionist hold | Swing | +4.4 | |||
Cindicates candidate endorsed by the coalition government. |
Party | Candidate | Votes | % | ±% | |
---|---|---|---|---|---|
Liberal Unionist | James Avon Clyde | 4,952 | 53.8 | +1.3 | |
Liberal | J.H. Morgan | 4,252 | 46.2 | −1.3 | |
Majority | 700 | 7.6 | +2.6 | ||
Turnout | 9,204 | 90.4 | −1.0 | ||
Registered electors | 10,179 | ||||
Liberal Unionist hold | Swing | +1.3 | |||
Party | Candidate | Votes | % | ±% | |
---|---|---|---|---|---|
Liberal Unionist | James Avon Clyde | 4,683 | 52.5 | +0.5 | |
Liberal | Charles Henry Lyell | 4,233 | 47.5 | −0.5 | |
Majority | 450 | 5.0 | +1.0 | ||
Turnout | 8,916 | 91.4 | +6.4 | ||
Registered electors | 9,758 | ||||
Liberal Unionist hold | Swing | +0.5 | |||
Party | Candidate | Votes | % | ±% | |
---|---|---|---|---|---|
Liberal Unionist | James Avon Clyde | Unopposed | |||
Liberal Unionist hold | |||||
Party | Candidate | Votes | % | ±% | |
---|---|---|---|---|---|
Liberal Unionist | Lewis McIver | 3,949 | 52.0 | −9.2 | |
Liberal | Leonard Courtney | 3,643 | 48.0 | +9.2 | |
Majority | 306 | 4.0 | −18.4 | ||
Turnout | 7,592 | 85.0 | +8.5 | ||
Registered electors | 8,930 | ||||
Liberal Unionist hold | Swing | +9.2 | |||
Party | Candidate | Votes | % | ±% | |
---|---|---|---|---|---|
Liberal Unionist | Lewis McIver | 4,180 | 61.2 | N/A | |
Liberal | E. Adam | 2,645 | 38.8 | New | |
Majority | 1,535 | 22.4 | N/A | ||
Turnout | 6,825 | 76.5 | N/A | ||
Registered electors | 8,926 | ||||
Liberal Unionist hold | Swing | N/A | |||
Party | Candidate | Votes | % | ±% | |
---|---|---|---|---|---|
Liberal Unionist | Lewis McIver | Unopposed | |||
Liberal Unionist hold | |||||
Party | Candidate | Votes | % | ±% | |
---|---|---|---|---|---|
Liberal Unionist | Lewis McIver | 3,783 | 55.2 | +1.5 | |
Liberal | Alexander Murray | 3,075 | 44.8 | −1.5 | |
Majority | 708 | 10.4 | +3.0 | ||
Turnout | 6,858 | 81.1 | −3.2 | ||
Registered electors | 8,452 | ||||
Liberal Unionist hold | Swing | +1.5 | |||
Party | Candidate | Votes | % | ±% | |
---|---|---|---|---|---|
Liberal Unionist | William Palmer | 3,728 | 53.7 | −2.6 | |
Liberal | Thomas Buchanan | 3,216 | 46.3 | +2.6 | |
Majority | 512 | 7.4 | −5.2 | ||
Turnout | 6,944 | 84.3 | +11.9 | ||
Registered electors | 8,236 | ||||
Liberal Unionist hold | Swing | −2.6 | |||
Party | Candidate | Votes | % | ±% | |
---|---|---|---|---|---|
Liberal | Thomas Buchanan | 3,294 | 50.4 | +6.7 | |
Liberal Unionist | Thomas Raleigh | 3,248 | 49.6 | −6.7 | |
Majority | 46 | 0.8 | N/A | ||
Turnout | 6,542 | 84.4 | +12.0 | ||
Registered electors | 7,749 | ||||
Liberal gain from Liberal Unionist | Swing | +6.7 | |||
Party | Candidate | Votes | % | ±% | |
---|---|---|---|---|---|
Liberal Unionist | Thomas Buchanan | 3,083 | 56.3 | +15.4 | |
Liberal | Robert Wallace | 2,393 | 43.7 | −15.4 | |
Majority | 690 | 12.6 | N/A | ||
Turnout | 5,476 | 72.4 | −12.5 | ||
Registered electors | 7,565 | ||||
Liberal Unionist gain from Liberal | Swing | +15.4 | |||
Party | Candidate | Votes | % | ±% | |
---|---|---|---|---|---|
Liberal | Thomas Buchanan | 3,800 | 59.1 | N/A | |
Conservative | George Auldjo Jamieson | 2,625 | 40.9 | N/A | |
Majority | 1,175 | 18.2 | N/A | ||
Turnout | 6,425 | 84.9 | N/A | ||
Registered electors | 7,565 | ||||
Liberal win (new seat) |
Edinburgh South is a constituency of the House of Commons of the UK Parliament created in 1885. The constituency has been held by Scottish Labour since 1987, being represented by Ian Murray since 2010. Murray was the only Labour MP in Scotland to retain his seat at the 2015 and 2019 general elections and this is one of only three seats never held by the Scottish National Party (SNP).
Edinburgh East is a burgh constituency of the House of Commons of the Parliament of the United Kingdom. It elects one Member of Parliament (MP) by the first past the post system of election.
Edinburgh West was a constituency of the Scottish Parliament (Holyrood) from 1999 until 2011. It elected one Member of the Scottish Parliament (MSP) by the plurality method of election. It was also one of nine constituencies in the Lothians electoral region, which elected seven additional members, in addition to nine constituency MSPs, to produce a form of proportional representation for the region as a whole.
Livingston is a county constituency of the House of Commons of the Parliament of the United Kingdom, to which it returns one Member of Parliament (MP). Elections are held using the first-past-the-post voting system.
Glasgow Central is a constituency of the House of Commons of the Parliament of the United Kingdom. In its current form, the constituency was first used at the 2005 general election, but there was also a Glasgow Central constituency that existed from 1885 to 1997. The sitting MP is Alison Thewliss of the Scottish National Party (SNP), who was first elected in May 2015. This constituency was also the seat of the former Conservative Prime Minister Bonar Law, who was the shortest-serving UK Prime Minister of the twentieth century.
Aberdeen South is a burgh constituency of the House of Commons of the Parliament of the United Kingdom and it elects one Member of Parliament (MP) by the first-past-the-post system of election.
Na h-Eileanan an Iar, formerly Western Isles, is a constituency of the House of Commons of the Parliament of the United Kingdom, created in 1918. It elects one Member of Parliament (MP) by the first past the post system of election.
Aberdeen North is a burgh constituency of the House of Commons of the Parliament of the United Kingdom and it elects one Member of Parliament (MP) by the first past the post system of election. It was first used in the 1885 general election, but has undergone various boundary changes since that date.
West Aberdeenshire and Kincardine is a county constituency of the House of Commons of the Parliament of the United Kingdom of Great Britain and Northern Ireland (Westminster), which elects one Member of Parliament (MP) by the first past the post system of election. It was first used in the 1997 general election, but has undergone boundary changes since that date. West Aberdeenshire and Kincardine was re-created as a parliamentary constituency in 1997, having previously existed as Kincardine and Western Aberdeenshire from 1918 to 1950.
East Renfrewshire is a constituency of the House of Commons, to the south of Glasgow, Scotland. It elects one Member of Parliament (MP) using the first-past-the-post system of voting.
Edinburgh Central was a burgh constituency of the House of Commons of the Parliament of the United Kingdom from 1885 to 2005. It elected one Member of Parliament (MP) by the first past the post system of election.
Dumfriesshire was a county constituency represented in the House of Commons of Great Britain from 1708 to 1801 and in the House of Commons of the Parliament of the United Kingdom from 1801 until 2005. It was known as Dumfries from 1950.
Glasgow Cathcart was a burgh constituency represented in the House of Commons of the Parliament of the United Kingdom from 1918 until 2005, when it was replaced by the larger Glasgow South constituency.
Glasgow Govan was a parliamentary constituency in the Govan district of Glasgow. It was represented in the House of Commons of the Parliament of the United Kingdom for 120 years; from 1885 until 2005, returning one Member of Parliament (MP) elected by the first-past-the-post system.
Glasgow Hillhead was a parliamentary constituency represented in the House of Commons of the Parliament of the United Kingdom from 1918 until 1997. It elected one Member of Parliament (MP) using the first-past-the-post voting system.
Glasgow Pollok was a burgh constituency represented in the House of Commons of the Parliament of the United Kingdom from 1918 until 2005, when it was replaced by Glasgow South West. It elected one Member of Parliament (MP) using the first-past-the-post voting system.
Glasgow Shettleston was a burgh constituency represented in the House of Commons of the Parliament of the United Kingdom from 1918 until 2005. The Shettleston area's representation is now covered by Glasgow Central and Glasgow East.
Glasgow Maryhill was a parliamentary constituency represented in the House of Commons of the Parliament of the United Kingdom from 1918 to 2005 when it was subsumed into the new Glasgow North and Glasgow North East constituencies. It elected one Member of Parliament (MP) using the first-past-the-post voting system.
Rutherglen was a burgh constituency represented in the House of Commons of the Parliament of the United Kingdom from 1918 until 2005. From 2005, most of the area is represented by Rutherglen and Hamilton West, while a small portion is now in Glasgow Central and Glasgow South.
West Renfrewshire was a county constituency of the House of Commons of the Parliament of the United Kingdom from 1885 to 1983 and again from 1997 until 2005. In 2005 the constituency was abolished and the area is now represented by Inverclyde, Paisley and Renfrewshire North and Paisley and Renfrewshire South.