Nuneaton (UK Parliament constituency)

Last updated

Nuneaton
County constituency
for the House of Commons
Nuneaton2007Constituency.svg
Boundary of Nuneaton in Warwickshire
EnglandWarwickshire.svg
Location of Warwickshire within England
County Warwickshire
Electorate 68,288 (December 2010) [1]
Major settlements Nuneaton
Current constituency
Created 1885
Member of Parliament Marcus Jones (Conservative)
SeatsOne
Created from North Warwickshire

Nuneaton is a constituency [n 1] represented in the House of Commons of the UK Parliament since 2010 by Marcus Jones, a Conservative. [n 2] Since 1997, the seat has been seen as an important national bellwether. [2] [3]

Contents

In the 2015 general election, Nuneaton was the first key marginal seat between the Conservatives and Labour to declare its results. [4] Instead of seeing the predicted victory for Labour, [5] the seat saw a swing of 3.0% towards the Conservatives which proved to be a big indication that they were heading for victory in the 2015 general election, contrary to prior opinion poll projections.

Boundaries

Nuneaton (UK Parliament constituency)
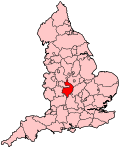
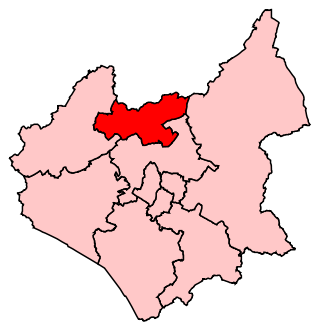
Map of current boundaries
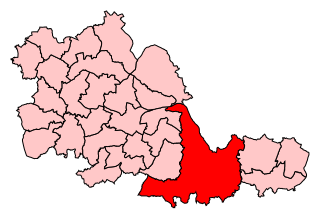
Nuneaton 1885-1918 Nuneaton 1885-1918.jpg
Nuneaton 1885-1918

1885–1918: The Sessional Division of Coventry and part of the Sessional Divisions of Atherstone and Coleshill.

1918–1945: The Municipal Borough of Nuneaton, the Urban District of Bulkington, and the Rural Districts of Atherstone, Coventry, Foleshill, and Nuneaton.

1945–1955: The Municipal Borough of Nuneaton, the Urban District of Bedworth, and the Rural District of Atherstone.

1955–1974: The Municipal Borough of Nuneaton, and the Urban District of Bedworth. [6]

1974–1983: The Municipal Borough of Nuneaton, and the Urban District of Bedworth as altered by the Coventry Order 1965.

1983–2010: The Borough of Nuneaton and Bedworth wards of Abbey, Arbury, Attleborough, Bulkington, Camp Hill, Chilvers Coton, Galley Common, St Nicolas, Stockingford, Weddington, and Whitestone, and the Borough of Rugby wards of Earl Craven, Fosse, and Wolvey.

2010–present: The Borough of Nuneaton and Bedworth wards of Abbey, Arbury, Attleborough, Bar Pool, Camp Hill, Galley Common, Kingswood, St Nicolas, Weddington, Wem Brook, and Whitestone, and the Borough of North Warwickshire wards of Arley and Whitacre, and Hartshill.

The boundary changes which took effect for the 1983 general election removed the town of Bedworth, which was transferred to the newly created North Warwickshire constituency. As a result, the sitting MP Les Huckfield declined to stand and unsuccessfully sought nomination in other constituencies such as Wigan [7] and Sedgefield. [8]

Proposed

Further to the 2023 Periodic Review of Westminster constituencies, enacted by the Parliamentary Constituencies Order 2023, the composition of the constituency from the 2024 general election will be unchanged. [9]

History

The constituency was created as a result of the Redistribution of Seats Act 1885, in an area whose population had expanded as coal miners poured in from other parts of the country. At one time 20 collieries operated in the area and now one of three major British coal mines continued with operations in the constituency at Daw Mill atop the Warwickshire Coalfield (known as the Warwickshire Thick) in the north of the county until 2012 when it closed. The associated heavy industry and mining-centred economy coupled with the Representation of the People Act 1918 (Fourth Reform Act) led to Nuneaton being held by the Labour Party for nearly 50 years until lost in the 1983 Conservative Landslide to Lewis Stevens, a Conservative who retained the seat in 1987.

Labour regained the constituency at the 1992 election. Bill Olner beat Stevens and retained the seat in 1997, 2001 and 2005. Olner announced in 2007 that he would not be contesting the 2010 general election and would be standing down at the end of the 2005–2010 parliament. [10] Former Nuneaton and Bedworth Council Leader Marcus Jones was successful in taking the seat for the Conservative Party at the 2010 election and retained the seat in 2015, 2017 and 2019.

2015 general election significance

In the 2015 general election, Nuneaton was the first marginal constituency between the Conservatives and Labour to declare its results. The result proved to be significant as it saw a 3.0% swing to the Conservatives, despite the seat being Labour's 38th biggest target [11] and Labour being predicted to win the seat. [5] The result therefore proved to be a major indication that the Conservatives were going to win a majority of seats in the House of Commons for the first time since the 1992 general election, something which went against national opinion polls which pointed towards Labour gains in the key marginal constituencies. [12]

It was later reported that the moment incumbent Prime Minister David Cameron knew his Conservative Party had won the general election was when Nuneaton declared its results at 1.53 am on 8 May 2015. [13]

This has led to many pointing out the similarities between Nuneaton and the former constituency of Basildon which in 1987 and 1992, Labour unexpectedly failed to win. This is why the Nuneaton result has been seen as the 'Basildon Moment' of 2015, since the Basildon constituency similarly foreshadowed the Conservative's election victory in 1992. [14]

Nuneaton was chosen by the Labour Party as the host of their first televised leadership debate during their 2015 leadership election. [15]

Members of Parliament

ElectionMember [16] Party
1885 Jasper Johns Liberal
1886 John Dugdale Conservative
1892 Francis Newdigate [17] Conservative
1906 William Johnson Liberal
1909 Labour
1914 Liberal
1918 Sir Henry Maddocks Coalition Conservative
1923 Herbert Willison Liberal
1924 Arthur Hope Conservative
1929 Francis Smith Labour
1931 Edward North Conservative
1935 Reginald Fletcher Labour
1942 by-election Frank Bowles Labour
1965 by-election Frank Cousins Labour
1967 by-election Les Huckfield Labour
1983 Lewis Stevens Conservative
1992 Bill Olner Labour
2010 Marcus Jones Conservative

Elections

Elections in the 2020s

General election 2024: Nuneaton
PartyCandidateVotes%±%
Workers Party Khalil Ahmed [18]
Labour Jodie Gosling [19]
Reform UK Rob Howard [20]
Conservative Marcus Jones [19]
Green Keith Kondakor [21]
Majority
Turnout
Swing

Elections in the 2010s

General election 2019: Nuneaton [22]
PartyCandidateVotes%±%
Conservative Marcus Jones 27,390 60.6 Increase2.svg9.0
Labour Zoe Mayou14,24631.5Decrease2.svg9.8
Liberal Democrats Richard Brighton-Knight1,8624.1Increase2.svg2.1
Green Keith Kondakor1,6923.7Increase2.svg2.0
Majority13,14429.1Increase2.svg18.8
Turnout 45,19064.3Decrease2.svg2.4
Conservative hold Swing Increase2.svg9.4
General election 2017: Nuneaton [23] [24]
PartyCandidateVotes%±%
Conservative Marcus Jones 23,755 51.6 Increase2.svg6.0
Labour Phil Johnson19,01641.3Increase2.svg6.4
UKIP Craig Carpenter1,6193.5Decrease2.svg10.9
Liberal Democrats Richard Brighton-Knight9142.0Increase2.svg0.2
Green Chris Brookes7631.7Decrease2.svg1.1
Majority4,73910.3Decrease2.svg0.4
Turnout 46,06766.67Decrease2.svg0.5
Conservative hold Swing Decrease2.svg 0.2
General election 2015: Nuneaton [25]
PartyCandidateVotes%±%
Conservative Marcus Jones 20,827 45.5 Increase2.svg4.0
Labour Vicky Fowler15,94534.9Decrease2.svg2.0
UKIP Alwyn Waine [26] 6,58214.4New
Green Keith Kondakor1,2812.8New
Liberal Democrats Christina Jebb8161.8Decrease2.svg13.5
TUSC Paul Reilly1940.4New
English Democrat Steve Paxton1040.2New
Majority4,88210.6Increase2.svg6.0
Turnout 45,74967.2Increase2.svg1.4
Conservative hold Swing Increase2.svg3.0
General election 2010: Nuneaton [27] [28]
PartyCandidateVotes%±%
Conservative Marcus Jones 18,536 41.5 Increase2.svg4.6
Labour Jayne Innes16,46736.9Decrease2.svg9.8
Liberal Democrats Christina Jebb6,84615.3Increase2.svg2.8
BNP Martyn Findley2,7976.3New
Majority2,0694.6N/A
Turnout 44,64665.8Increase2.svg6.9
Conservative gain from Labour Swing Increase2.svg7.2

Elections in the 2000s

General election 2005: Nuneaton [29] [30]
PartyCandidateVotes%±%
Labour Bill Olner 19,945 44.0 Decrease2.svg8.1
Conservative Mark Pawsey 17,66539.0Increase2.svg4.3
Liberal Democrats Ali Asghar5,88413.0Increase2.svg1.9
UKIP Keith Tyson1,7863.9Increase2.svg1.9
Majority2,2805.0Decrease2.svg12.4
Turnout 45,27961.7Increase2.svg1.6
Labour hold Swing Decrease2.svg6.2
General election 2001: Nuneaton [31] [32]
PartyCandidateVotes%±%
Labour Bill Olner 22,577 52.1 -4.1
Conservative Mark Lancaster 15,04234.7+3.8
Liberal Democrats Tony Ferguson4,82011.1+2.3
UKIP Brian James8732.0+1.5
Majority7,53517.4-7.9
Turnout 43,31260.1-14.3
Labour hold Swing -3.95

Elections in the 1990s

General election 1997: Nuneaton [33]
PartyCandidateVotes%±%
Labour Bill Olner 30,080 56.2 +10.4
Conservative Richard Blunt16,54030.9-12.1
Liberal Democrats Ron Cockings4,7328.8-2.4
Referendum Roy English1,5332.9New
Independent David Bray3900.7New
UKIP Peter Everitt2380.5New
Majority13,54025.3+22.5
Turnout 53,51374.4-8.6
Labour hold Swing +11.3
General election 1992: Nuneaton [34] [35]
PartyCandidateVotes%±%
Labour Bill Olner 27,157 45.8 +11.2
Conservative Lewis Stevens 25,52643.0-1.9
Liberal Democrats Ruth Merritt6,67111.2-8.0
Majority1,6312.8N/A
Turnout 59,35483.0+2.7
Labour gain from Conservative Swing +6.55

Elections in the 1980s

General election 1987: Nuneaton [36]
PartyCandidateVotes%±%
Conservative Lewis Stevens 24,630 44.9 +4.4
Labour Valerie Veness18,97534.6+4.0
Liberal Andrew Trembath10,55019.2New
Green John Morrissey7191.3New
Majority5,65510.3+0.4
Turnout 54,87480.3+3.0
Conservative hold Swing +0.2
General election 1983: Nuneaton [37]
PartyCandidateVotes%±%
Conservative Lewis Stevens 20,666 40.5 +2.8
Labour John Haynes15,60530.6-19.3
SDP Ruth Levitt14,26428.0New
Independent GE Davies5041.00.0
Majority5,0619.9N/A
Turnout 51,03977.3-1.2
Conservative gain from Labour Swing +11.05

Elections in the 1970s

General election 1979: Nuneaton
PartyCandidateVotes%±%
Labour Les Huckfield 31,403 49.9 -6.2
Conservative Lewis Stevens 23,71537.7+12.4
Liberal Cecil Williams6,1849.8-8.8
National Front RP Matthews1,0281.6New
Independent GE Davies5041.0New
Majority7,68812.2-18.6
Turnout 62,95978.5+4.6
Labour hold Swing -9.35
General election October 1974: Nuneaton
PartyCandidateVotes%±%
Labour Les Huckfield 32,30856.10+2.25
Conservative Roland JM Freeman14,54725.30-1.05
Liberal N Hawkins10,72918.60-1.19
Majority17,76130.80+3.30
Turnout 57,58473.90-8.51
Labour hold Swing +1.65
General election February 1974: Nuneaton
PartyCandidateVotes%±%
Labour Les Huckfield 34,25853.85-3.58
Conservative D Samuel16,76526.35-6.34
Liberal D Inman12,49119.79+10.00
Majority17,49327.50+2.86
Turnout 63,61482.41+6.21
Labour hold Swing +1.38
General election 1970: Nuneaton
PartyCandidateVotes%±%
Labour Les Huckfield 32,87757.43+3.45
Conservative Susan Lewis-Smith18,76932.79+1.23
Liberal Alex Harrison5,6029.79-4.67
Majority14,10824.64+2.22
Turnout 57,24876.20-3.48
Labour hold Swing +7.65

Elections in the 1960s

By Election 1967: Nuneaton
PartyCandidateVotes%±%
Labour Les Huckfield 18,23942.08-11.10
Conservative David Knox 14,18532.73+1.17
Liberal Alan Meredith7,64417.64+3.18
All Party Alliance John Creasey2,7556.36New
Independent Don Bennett 5171.19New
Majority4,0549.35-13.07
Turnout 43,34067.90-11.78
Labour hold Swing -5.37
General election 1966: Nuneaton
PartyCandidateVotes%±%
Labour Frank Cousins 27,45253.98+1.20
Conservative David S Marland16,04931.56+2.48
Liberal Alan Meredith7,35614.46-3.67
Majority11,40322.42-1.26
Turnout 50,85779.68-0.43
Labour hold Swing +4.22
By Election 1965: Nuneaton
PartyCandidateVotes%±%
Labour Frank Cousins 18,32548.92-3.86
Conservative David S Marland13,08434.93+5.85
Liberal John Campbell6,04716.14-1.99
Majority5,24113.99-9.71
Turnout 37,45660.80-19.91
Labour hold Swing -4.86
General election 1964: Nuneaton
PartyCandidateVotes%±%
Labour Frank Bowles 26,05952.78+0.34
Conservative David S Marland14,35729.08-3.26
Liberal John Campbell8,95318.13+2.91
Majority11,70223.70+3.60
Turnout 49,36980.11-1.69
Labour hold Swing +1.80

Elections in the 1950s

General election 1959: Nuneaton
PartyCandidateVotes%±%
Labour Frank Bowles 24,89452.44-3.39
Conservative Charles G Miller15,35432.34-0.62
Liberal John Campbell7,22715.22+4.00
Majority9,54020.10-2.76
Turnout 47,47581.80-2.11
Labour hold Swing -1.39
General election 1955: Nuneaton
PartyCandidateVotes%±%
Labour Frank Bowles 25,11255.83-5.8
Conservative Robert Dermott D Griffith14,82832.96+3.74
Liberal John Beeching Frankenburg 5,04811.22+0.47
Majority10,28422.87-7.94
Turnout 44,98879.69-5.33
Labour hold Swing -2.06
General election 1951: Nuneaton [38]
PartyCandidateVotes%±%
Labour Frank Bowles 35,65160.03+1.33
Conservative James E Tippett17,35629.22+1.62
Liberal GC Middleton6,38610.75-2.95
Majority18,29530.81-0.39
Turnout 59,39385.02-2.28
Labour hold Swing -0.15
General election 1950: Nuneaton
PartyCandidateVotes%±%
Labour Frank Bowles 35,129 58.7 +0.2
Conservative Phylis G Spencer16,48827.6+4.2
Liberal Jack A Harris8,17713.7-3.5
Majority18,64131.1-4.0
Turnout 59,79487.3+8.6
Labour hold Swing

Elections in the 1940s

General election 1945: Nuneaton
PartyCandidateVotes%±%
Labour Frank Bowles 30,587 58.5 +10.1
Conservative John Fitzroy-Newdegate12,26723.4-17.4
Liberal Peter Calvocoressi 8,98617.2+6.4
Independent Progressive Leonard Melling4680.9New
Majority18,32035.1+27.5
Turnout 52,30878.7+2.8
Labour hold Swing
1942 Nuneaton by-election
PartyCandidateVotes%±%
Labour Frank Bowles Unopposed N/AN/A
Labour hold Swing

General Election 1939–40: Another general election was required to take place before the end of 1940. The political parties had been making preparations for an election to take place from 1939 and by the end of this year, the following candidates had been selected;

Elections in the 1930s

General election 1935: Nuneaton
PartyCandidateVotes%±%
Labour Reginald Fletcher 33,237 48.4 +10.7
Conservative John Moores 28,00040.8-0.9
Liberal William Thomas Stanton7,38410.8New
Majority5,2377.6+3.6
Turnout 68,62175.9-2.1
Labour gain from Conservative Swing
General election 1931: Nuneaton
PartyCandidateVotes%±%
Conservative Edward North 25,839 41.7 +17.4
Labour Frank Smith 23,37537.7-6.7
National Liberal Herbert Willison 12,81120.6-10.7
Majority2,4644.0N/A
Turnout 62,02578.0-6.1
Conservative gain from Labour Swing

Elections in the 1920s

General election 1929: Nuneaton
PartyCandidateVotes%±%
Labour Frank Smith 27,102 44.4 +13.1
Liberal Herbert Willison 19,10431.3+0.3
Unionist Arthur Hope 14,81924.3-13.4
Majority7,99813.1N/A
Turnout 60,39584.1+5.4
Labour gain from Unionist Swing +13.2
General election 1924: Nuneaton
PartyCandidateVotes%±%
Unionist Arthur Hope 15,242 37.7 +7.2
Labour Frank Smith 12,67931.3+2.2
Liberal Herbert Willison 12,55031.0-9.4
Majority2,5636.4-3.5
Turnout 40,47178.7+6.1
Unionist gain from Liberal Swing N/A
General election 1923: Nuneaton [39]
PartyCandidateVotes%±%
Liberal Herbert Willison 14,518 40.4 +11.2
Unionist Henry Maddocks 10,94030.5-7.8
Labour Thomas Barron 10,43729.1-3.4
Majority3,5789.9N/A
Turnout 35,89572.6+2.8
Liberal gain from Unionist Swing +9.5
General election 1922: Nuneaton
PartyCandidateVotes%±%
Unionist Henry Maddocks 12,765 38.3 -7.9
Labour J Stevenson10,84232.5+6.7
Liberal Thomas Slack9,73029.2+5.7
Majority1,9235.8-14.6
Turnout 33,33769.8+13.9
Unionist hold Swing -7.3

Elections in the 1910s

General election 1918: Nuneaton
PartyCandidateVotes%±%
Unionist *Henry Maddocks 11,198 46.2 -1.6
Labour Ivor Gregory 6,26925.8-16.4
Liberal William Henry Grant5,70723.5New
National Democratic William Henry Dyson1,1014.5New
Majority4,92920.4N/A
Turnout 24,27555.9-34.1
Unionist gain from Liberal Swing

Election results 1885-1918

Elections in the 1880s

General election 1885: Nuneaton [40] [41] [42]
PartyCandidateVotes%±%
Liberal Jasper Johns 4,445 51.6
Conservative John Dugdale 4,16948.4
Majority2763.2
Turnout 8,61485.6
Registered electors 10,061
Liberal win (new seat)
General election 1886: Nuneaton [40] [41]
PartyCandidateVotes%±%
Conservative John Dugdale 4,626 56.2 +7.8
Liberal Jasper Johns 3,60843.8-7.8
Majority1,01812.4N/A
Turnout 8,23481.83.8
Registered electors 10,061
Conservative gain from Liberal Swing +7.8

Elections in the 1890s

General election 1892: Nuneaton [40] [41]
PartyCandidateVotes%±%
Conservative Francis Newdegate 4,899 53.5 2.7
Liberal Charles Vero4,25846.5+2.7
Majority6417.05.4
Turnout 9,15788.6+6.8
Registered electors 10,336
Conservative hold Swing 2.7
Tomkinson 1910 James Tomkinson MP.jpg
Tomkinson
General election 1895: Nuneaton [40] [41] [43]
PartyCandidateVotes%±%
Conservative Francis Newdegate 5,572 57.2 +3.7
Liberal James Tomkinson 4,17542.8-3.7
Majority1,39714.4+7.4
Turnout 9,74787.70.9
Registered electors 11,114
Conservative hold Swing +3.7

Elections in the 1900s

General election 1900: Nuneaton [40] [41] [43]
PartyCandidateVotes%±%
Conservative Francis Newdegate 5,736 56.4 0.8
Lib-Lab William Johnson 4,43243.6+0.8
Majority1,30412.81.6
Turnout 10,16878.98.8
Registered electors 12,894
Conservative hold Swing 0.8
Johnson William Johnson 1905.JPG
Johnson
General election 1906: Nuneaton [40] [41]
PartyCandidateVotes%±%
Lib-Lab William Johnson 7,677 56.8 +13.2
Conservative Francis Newdigate-Newdegate 5,84943.2-13.2
Majority1,82813.6N/A
Turnout 13,52690.0+11.1
Registered electors 15,021
Lib-Lab gain from Conservative Swing +13.2

Elections in the 1910s

General election January 1910: Nuneaton [40] [44]
PartyCandidateVotes%±%
Labour William Johnson 8,154 50.8 6.0
Conservative Henry Maddocks 7,89149.2+6.0
Majority2631.612.0
Turnout 16,04591.9+1.9
Registered electors 17,451
Labour hold Swing 6.0
General election December 1910: Nuneaton [40] [44]
PartyCandidateVotes%±%
Labour William Johnson 8,199 52.2 +1.4
Conservative Henry Maddocks 7,50147.8-1.4
Majority6984.4+2.8
Turnout 15,70090.0-1.9
Registered electors 17,451
Labour hold Swing +1.4

General Election 1914–15:

Another General Election was required to take place before the end of 1915. The political parties had been making preparations for an election to take place and by July 1914, the following candidates had been selected;

See also

Related Research Articles

<span class="mw-page-title-main">Warwick and Leamington (UK Parliament constituency)</span> British parliamentary constituency

Warwick and Leamington is a constituency represented in the House of Commons of the UK Parliament since the 2017 general election by Matt Western, of the Labour Party.

<span class="mw-page-title-main">Birmingham Yardley (UK Parliament constituency)</span> UK Parliament constituency in England since 1918

Birmingham Yardley is a constituency of part of the city of Birmingham represented in the House of Commons of the UK Parliament since 2015 by Jess Phillips of the Labour Party.

<span class="mw-page-title-main">Newbury (UK Parliament constituency)</span> Parliamentary constituency in the United Kingdom since 1885

Newbury is a constituency represented in the House of Commons of the UK Parliament from 2019 by Laura Farris, a Conservative. It was created by the Redistribution of Seats Act 1885 and has been in continual existence since then.

<span class="mw-page-title-main">Stockton South (UK Parliament constituency)</span> Parliamentary constituency in the United Kingdom, 1983 onwards

Stockton South is a constituency represented in the House of Commons of the UK Parliament since December 2019 by Matt Vickers, a Conservative MP.

<span class="mw-page-title-main">Portsmouth North (UK Parliament constituency)</span> Parliamentary constituency in the United Kingdom, 1974 onwards

Portsmouth North is a constituency represented in the House of Commons of the UK Parliament since 2010 by Penny Mordaunt, the current Leader of the House of Commons and Lord President of the Council. She is a Conservative MP.

<span class="mw-page-title-main">Keighley (UK Parliament constituency)</span> Parliamentary constituency in the United Kingdom

Keighley is a constituency in West Yorkshire created in 1885 represented in the House of Commons of the UK Parliament since 2019 by Robbie Moore of the Conservative Party.

<span class="mw-page-title-main">Wellingborough (UK Parliament constituency)</span> Parliamentary constituency in the United Kingdom, 1918 onwards

Wellingborough is a constituency in Northamptonshire represented in the House of Commons of the UK Parliament. The seat is currently held by Labour MP Gen Kitchen, after the recall of MP Peter Bone in December 2023 which resulted in a by-election in February 2024.

<span class="mw-page-title-main">Loughborough (UK Parliament constituency)</span> Parliamentary constituency in the United Kingdom, 1885 onwards

Loughborough is a constituency in Leicestershire represented in the House of Commons of the UK Parliament since 2019 by Jane Hunt, a Conservative. From 2010 until 2019, it was represented by Nicky Morgan, who served in the governments of David Cameron and Boris Johnson. In 2020, she was elevated to the Peerage and became a member of the House of Lords. The constituency is a considered a bellwether, as it has reflected the national result at every general election since February 1974.

<span class="mw-page-title-main">Tamworth (UK Parliament constituency)</span> UK Parliament constituency since 2010

Tamworth is a constituency represented in the House of Commons of the UK Parliament, based on the town of Tamworth in Staffordshire, England. The seat is currently represented by Sarah Edwards of the Labour Party, following a by-election in October 2023. It was previously held by Chris Pincher of the Conservative Party, who held the seat from 2010 to 2023, when he resigned. He had been suspended from the party since July 2022.

<span class="mw-page-title-main">North Warwickshire (UK Parliament constituency)</span>

North Warwickshire is a constituency represented in the House of Commons of the UK Parliament since 2015 by Craig Tracey, a Conservative.

<span class="mw-page-title-main">Meriden (UK Parliament constituency)</span> Parliamentary constituency in the United Kingdom, 1955 onwards

Meriden is a constituency represented in the House of Commons of the UK Parliament since 2019 by Saqib Bhatti, a Conservative. It is named after the village of Meriden, halfway between Solihull and Coventry.

<span class="mw-page-title-main">Basildon (UK Parliament constituency)</span> Parliamentary constituency in the United Kingdom, 1974–2010

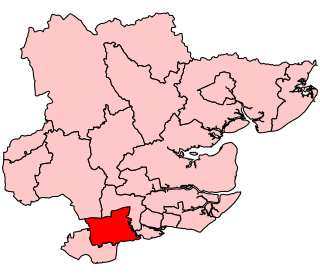
Basildon was a parliamentary constituency represented in the House of Commons of the Parliament of the United Kingdom. It elected one Member of Parliament (MP) by the first past the post system of election.

<span class="mw-page-title-main">Hendon (UK Parliament constituency)</span> Parliamentary constituency in the UK

Hendon is a constituency in Greater London represented in the House of Commons of the UK Parliament since 2010 by Matthew Offord of the Conservative Party, who announced in May 2023 that he would stand down at the 2024 general election. It was created for the 1997 general election; an earlier version of the seat existed between 1918 and 1945.

<span class="mw-page-title-main">Dartford (UK Parliament constituency)</span> UK Parliament constituency since 1885

Dartford is a constituency in Kent represented in the House of Commons of the UK Parliament since 2010 by Gareth Johnson of the Conservative Party. It is the constituency that, in the entire UK, has longest been a bellwether: the party of the winning candidate has gone on to form the government at every UK general election since 1964. Candidates for the largest two parties nationally have polled first and second since 1923 in Dartford.

<span class="mw-page-title-main">Thurrock (UK Parliament constituency)</span> Parliamentary constituency in the United Kingdom, 1945 onwards

Thurrock is a constituency represented in the House of Commons of the UK Parliament since 2010 by Jackie Doyle-Price, a Conservative.

<span class="mw-page-title-main">Rugby (UK Parliament constituency)</span>

Rugby is a constituency represented in the House of Commons of the UK Parliament since its 2010 recreation by Mark Pawsey, a Conservative.

<span class="mw-page-title-main">South Basildon and East Thurrock (UK Parliament constituency)</span> Parliamentary constituency in the United Kingdom, 2010 onwards

South Basildon and East Thurrock is a constituency represented in the House of Commons of the UK Parliament since its 2010 creation by Stephen Metcalfe, a Conservative.

<span class="mw-page-title-main">2011 North Warwickshire Borough Council election</span> 2011 UK local government election

Elections to North Warwickshire District Council were held on Thursday 5 May 2011.

<span class="mw-page-title-main">Craig Tracey</span> British politician

Craig Paul Tracey is a British Conservative Party politician, who has been the Member of Parliament (MP) for North Warwickshire since his election in 2015 and Deputy Chairman of the Conservative Party since February 2024. Originally from the North East, Tracey settled in North Warwickshire in 1997. After serving as a parish councillor he was selected as the Conservative Party's parliamentary candidate for North Warwickshire in 2014. He unexpectedly increased the Conservative majority in the constituency despite not being the favourite to win. A former member of the Business, Innovation and Skills Select Committee, Tracey has served as co-chair of the All Party Parliamentary Group for Insurance and Financial Services since July 2016.

North Warwickshire and Bedworth is a proposed constituency of the House of Commons in the UK Parliament. Further to the completion of the 2023 Periodic Review of Westminster constituencies, it will first be contested at the next general election. The constituency name refers to North Warwickshire District and the town of Bedworth.

References

Specific
  1. "Electorate Figures - Boundary Commission for England". 2011 Electorate Figures. Boundary Commission for England. 4 March 2011. Archived from the original on 6 November 2010. Retrieved 13 March 2011.
  2. Reuters Editorial (24 June 2016). "Parliamentary bellwether Nuneaton votes strongly for Leave". Reuters. Retrieved 17 September 2016.{{cite news}}: |author= has generic name (help)
  3. Sandhu, Serina (12 December 2019). "What bellwether means and which seats could predict the election result". inews.co.uk. Retrieved 26 November 2021.
  4. "Conservatives win Nuneaton key battleground". BBC News. Retrieved 16 May 2016.
  5. 1 2 "Nuneaton Poll" (PDF).
  6. "The Parliamentary Constituencies (Birmingham and North Warwickshire) Order 1955. SI 1955/177". Statutory Instruments 1955. Part II. London: Her Majesty's Stationery Office. 1956. pp. 2099–2102.
  7. Almanac of British Politics, 3rd edition, Robert Waller
  8. seat, Profile: The safe (15 July 2000). "The glittering prize" via www.telegraph.co.uk.
  9. "The Parliamentary Constituencies Order 2023". Schedule 1 Part 8 West Midlands region.
  10. Coventry Telegraph 27 March 2007 Accessed 26 November 2007
  11. "Labour's 106 battleground target seats for 2015". LabourList. 8 January 2013.
  12. Holehouse, Matthew (17 March 2015). "Labour ahead in key marginals". The Daily Telegraph. London.
  13. Walker, Peter (12 May 2015). "Can the explanation for Labour's election failure be found in Nuneaton?". The Guardian. ISSN   0261-3077 . Retrieved 17 September 2016.
  14. "Why Nuneaton was the Basildon of 2015". BBC News. 13 May 2015.
  15. Heritage, Stuart (14 June 2015). "Labour's leadership hopefuls: can any of them win over the voters of Nuneaton?" via www.theguardian.com.
  16. Leigh Rayment's Historical List of MPs – Constituencies beginning with "N" (part 3)
  17. From 1902 Francis Newdigate-Newdegate
  18. https://workerspartybritain.org/elections-2024/
  19. 1 2 "Labour selections: parliamentary candidates selected so far for the general election". LabourList . Retrieved 13 March 2024.
  20. "Nuneaton Constituency". Reform UK . Retrieved 13 March 2024.
  21. "Full list of all Green Party candidates at the next general election". Bright Green. 17 September 2023. Retrieved 13 March 2024.
  22. "Nuneaton Parliamentary constituency". BBC News. BBC. Retrieved 30 November 2019.
  23. Marcus Jones [@Marcus4Nuneaton] (28 April 2017). "Delighted to have been unanimously re-adopted as the Conservative candidate for #Nuneaton constituency for the 2017 general election" (Tweet) via Twitter.
  24. "Tories take control in Warwickshire". BBC News. 5 May 2017.
  25. "Election Data 2015". Electoral Calculus. Archived from the original on 17 October 2015. Retrieved 17 October 2015.
  26. Malyon, Mike (18 December 2014). "Wife of expelled Tory to stand for UKIP in Nuneaton next year". coventrytelegraph.
  27. "Election Data 2010". Electoral Calculus. Archived from the original on 26 July 2013. Retrieved 17 October 2015.
  28. "UK > England > West Midlands > Nuneaton". Election 2010. BBC. 7 May 2010. Retrieved 11 May 2010.
  29. "Election Data 2005". Electoral Calculus. Archived from the original on 15 October 2011. Retrieved 18 October 2015.
  30. "Results for Nuneaton".
  31. "Election Data 2001". Electoral Calculus. Archived from the original on 15 October 2011. Retrieved 18 October 2015.
  32. "Nuneaton". BBC News.
  33. "Election Data 1997". Electoral Calculus. Archived from the original on 15 October 2011. Retrieved 18 October 2015.
  34. "Election Data 1992". Electoral Calculus. Archived from the original on 15 October 2011. Retrieved 18 October 2015.
  35. "Politics Resources". Election 1992. Politics Resources. 9 April 1992. Archived from the original on 24 July 2011. Retrieved 6 December 2010.
  36. "Election Data 1987". Electoral Calculus. Archived from the original on 15 October 2011. Retrieved 18 October 2015.
  37. "Election Data 1983". Electoral Calculus. Archived from the original on 15 October 2011. Retrieved 18 October 2015.
  38. The Times' Guide to the House of Commons. 1951.
  39. British Parliamentary Election Results 1918-1949, FWS Craig
  40. 1 2 3 4 5 6 7 8 British Parliamentary Election Results 1885-1918, FWS Craig
  41. 1 2 3 4 5 6 The Liberal Year Book, 1907
  42. Debrett's House of Commons & Judicial Bench, 1886
  43. 1 2 Debrett's House of Commons & Judicial Bench, 1901
  44. 1 2 Debrett's House of Commons & Judicial Bench, 1916
General

Craig, F. W. S. (1983). British parliamentary election results 1918-1949 (3 ed.). Chichester: Parliamentary Research Services. ISBN   0-900178-06-X.

Notes

Notes
  1. A county constituency (for the purposes of election expenses and type of returning officer)
  2. As with all constituencies, the constituency elects one Member of Parliament (MP) by the first past the post system of election at least every five years.

52°30′N1°27′W / 52.50°N 1.45°W / 52.50; -1.45