This article is part of a series on |
Politics of the United Kingdom |
---|
United Kingdomportal |
Parliamentary Constituencies Act 2020 | |
---|---|
Act of Parliament | |
Long title | An Act to make provision about reports of the Boundary Commissions under the Parliamentary Constituencies Act 1986; to make provision about the number of parliamentary constituencies and other rules for the distribution of seats; and for connected purposes. |
Citation | 2020 c. 25 |
Dates | |
Royal assent | 14 December 2020 |
Status: Current legislation | |
Text of statute as originally enacted | |
Text of the Parliamentary Constituencies Act 2020 as in force today (including any amendments) within the United Kingdom, from legislation.gov.uk. |
The 2023 Periodic Review of Westminster constituencies was the most recent cycle of the process to redraw the constituency map for the House of Commons. The new constituency borders were approved by the Privy Council on 15 November 2023 [1] and came into law on 29 November 2023. [2]
The process for periodic reviews of parliamentary constituencies in the United Kingdom is governed by the Parliamentary Constituencies Act 1986, as amended by the Parliamentary Voting System and Constituencies Act 2011 and subsequently by the Parliamentary Constituencies Act 2020. [3]
The 2023 review was the successor to the 2018 Periodic Review of Westminster constituencies, which was ultimately abandoned after it failed to pass into law. After abandonment of several previous reviews since 2015, the 2023 review was set to be the first review based on electoral registers drawn up using Individual Electoral Registration, which Parliament approved from 2014–15, an anti-fraud and personally empowering system that is in place in most of the world, replacing the older household registration that had been condemned by the worldwide Office for Democratic Institutions and Human Rights (OSCE/ODIHR). [4] By every, routine, local government canvass reaching slightly fewer imminent attainers of the age of 18 effectively than the old system of household registration [4] a small group of LSE experts have blogged, very marginally favours the Conservatives. [5] Local election offices are funded to implement mitigating measures to minimise any such disproportionate impacts. [4] The Command Papers were sponsored and ordered by a Deputy Prime Minister, Nick Clegg, a Liberal Democrat.
Under current legislation, the four Boundary Commissions of the United Kingdom were required to report on their next review of the boundaries of parliamentary constituencies before 1 July 2023. [3] In order to meet this deadline, the Commissions began their work on 5 January 2021. Following three rounds of public consultation, all four Commissions submitted their final proposals to the Speaker of the House of Commons on 27 June 2023. The Speaker immediately laid these before Parliament and the reports were published on the respective Commissions' websites the following day. [6] The new boundaries were formally introduced into UK law on 15 November 2023 through The Parliamentary Constituencies Order 2023. [7] (The original deadline of the end of October was missed by the government, which, according to the Act, must only happen in exceptional circumstances).
A description of the review process is detailed in Timeline of the 2023 Periodic Review of Westminster constituencies.
The four Boundary Commissions formally launched their 2023 reviews on 5 January 2021, [8] [9] [10] [11] to coincide with the release by the Office for National Statistics (ONS) of electorate data from analysis of the electoral registers that had been published on 2 March 2020. [12] The commissions jointly calculated the relevant electoral quota/range to be used for the 2023 review and the allocation of parliamentary constituencies between the four nations. The English commission further divided its allocation between the nine regions of England.
The electorate of the United Kingdom, comprising 650 constituencies, as determined by the ONS, was 47,558,398 on 2 March 2020. The electorate of the five protected constituencies – Isle of Wight (two seats), Na h-Eileanan an Iar, Orkney and Shetland, and Ynys Môn – amounted to 220,132, leaving 47,338,266 to be distributed between the remaining 645 constituencies, which gave an electoral quota of 73,393. Each non-protected constituency must have an electorate which is within 5% of this quota, which gave a permitted range of 69,724 to 77,062. [8] In Northern Ireland the legislation allows for a wider range, in certain prescribed circumstances, from 68,313 to 77,062. [11]
The 650 constituencies were allocated between the four nations of the UK in accordance with the method of allocation specified by the legislation as shown in the table below. [13]
Nation | Current seats (2010–2019) | Unprotected seats | Protected seats | Total | |||||
---|---|---|---|---|---|---|---|---|---|
Electorate | Allocation | Average size | Electorate | Allocation | Electorate | Allocation | Change | ||
England | 533 | 39,748,705 | 541 | 73,473 | 111,716 | 2 | 39,860,421 | 543 | +10 |
Northern Ireland | 18 | 1,295,688 | 18 | 71,983 | – | – | 1,295,688 | 18 | – |
Scotland | 59 | 4,023,611 | 55 | 73,320 | 56,001 | 2 | 4,079,612 | 57 | −2 |
Wales | 40 | 2,270,262 | 31 | 73,234 | 52,415 | 1 | 2,322,677 | 32 | −8 |
Total | 650 | 47,338,266 | 645 | 73,393 | 220,132 | 5 | 47,558,398 | 650 | – |
The Commission for England applied the same distribution formula to the English allocation, which results in the following redistribution of constituencies among the English regions: [13]
Region | Current seats (2010–2019) | Electorate | Allocation | Change | Average size |
---|---|---|---|---|---|
East Midlands | 46 | 3,481,126 | 47 | +1 | 74,067 |
Eastern | 58 | 4,482,127 | 61 | +3 | 73,477 |
London | 73 | 5,550,454 | 75 | +2 | 74,006 |
North East | 29 | 1,952,999 | 27 | −2 | 72,333 |
North West | 75 | 5,381,549 | 73 | −2 | 73,720 |
South East * | 83 | 6,522,802 | 89 | +6 | 73,290 |
South West | 55 | 4,242,136 | 58 | +3 | 73,140 |
West Midlands | 59 | 4,169,012 | 57 | −2 | 73,141 |
Yorkshire and the Humber | 54 | 3,966,500 | 54 | — | 73,454 |
Unprotected seats | 532 | 39,748,705 | 541 | +9 | 73,428 |
Isle of Wight | 1 | 111,716 | 2 | +1 | 55,858 |
Total | 533 | 39,860,421 | 543 | +10 | 73,408 |
* Excluding Isle of Wight
All four Commissions submitted their Final Recommendations Reports to the Speaker of the House of Commons on 27 June 2023. These were immediately laid before Parliament and the reports were published on the respective Commissions' websites on 28 June 2023. [14] [15] [16] [17]
The final recommendations for England resulted in only 55 of the existing 533 constituencies remaining completely unchanged. [18]
Region | Total proposed seats | Unchanged | Sub-regions |
---|---|---|---|
East Midlands [19] | 47 (+1) | 7 | Derbyshire Leicestershire, Lincolnshire and Rutland (+1) Northamptonshire Nottinghamshire |
Eastern [20] | 61 (+3) | 3 | Bedfordshire and Hertfordshire (+1) Cambridgeshire (+1) Essex Norfolk and Suffolk (+1) |
London [21] | 75 (+2) | 3 | North East London Newham and Tower Hamlets (+1) North Central London North West London South West London |
North East [22] | 27 (−2) | 2 | North of Tyne (−1) North East (−1) Tees Valley |
North West [23] | 73 (−2) | 12 | Cheshire and Merseyside Cumbria and Lancashire (−2) Greater Manchester |
South East [24] | 91 (+7) | 14 | Berkshire, Hampshire, and Surrey (+2) Buckinghamshire (+1) East Sussex and West Sussex (+1) Isle of Wight (+1) Kent (+1) Oxfordshire (+1) |
South West [25] | 58 (+3) | 2 | Avon, Somerset, and Devon (+2) Cornwall Dorset Gloucestershire and Wiltshire (+1) |
West Midlands [26] | 57 (−2) | 8 | Birmingham and Solihull Coventry Herefordshire Shropshire Staffordshire and the Black Country (−2) Warwickshire Worcestershire |
Yorkshire and the Humber [27] | 54 (–) | 4 | Humberside and South Yorkshire (−1) North Yorkshire and West Yorkshire (+1) |
Total | 543 | 55 |
In Wales, 21 of the 32 seats were unaltered from the revised proposals; 10 had revised boundaries (of which five were renamed); and one had a name change only. [17] In Scotland boundary changes affected 18 seats, of which 12 were renamed. Only name changes affected a further six, leaving 33 unaltered. In Northern Ireland, minor boundary changes affected five seats, with no changes to the proposed names.
As the number of constituencies in Northern Ireland remains the same, changes were only necessary to bring some of the electorates within the permitted range and align boundaries with those of revised local government wards. Belfast South was enlarged into the countryside and renamed Belfast South and Mid Down. East Antrim was extended further west, while Fermanagh-South Tyrone was extended further east into County Armagh. [15]
This table describes how the demographics of each constituency are different under the new boundaries compared to the old boundaries. [28] The population disparity between constituencies exists because boundaries are drawn based on electorate size, not total population.
Constituency | Catholic | Protestant | No religion | Other religion | Total population | |||||
---|---|---|---|---|---|---|---|---|---|---|
Old lines | New lines | Old lines | New lines | Old lines | New lines | Old lines | New lines | Old lines | New lines | |
Belfast East | 10,679 (11.01%) | 13,111 (12.82%) | 51,872 (53.85%) | 52,964 (51.79%) | 31,792 (33.01%) | 33,851 (33.10%) | 1,981 (2.06%) | 2,349 (2.30%) | 96,324 | 102,275 |
Belfast North | 46,485 (42.45%) | 47,822 (44.91%) | 37,090 (33.87%) | 33,686 (31.63%) | 23,615 (21.56%) | 22,712 (21.33%) | 2,317 (2.12%) | 2,269 (2.13%) | 109,507 | 106,489 |
Belfast South and Mid Down | 44,768 (38.16%) | 44,328 (37.08%) | 32,208 (27.45%) | 34,829 (29.13%) | 34,845 (29.70%) | 34,928 (29.22%) | 5,499 (4.69%) | 5,465 (4.57%) | 117,320 | 119,950 |
Belfast West | 69,641 (74.38%) | 71,640 (69.43%) | 11,738 (12.54%) | 17,426 (16.89%) | 10,606 (11.33%) | 12,446 (12.06%) | 1,642 (1.75%) | 1,665 (1.61%) | 93,627 | 103,177 |
East Antrim | 15,709 (17.55%) | 17,065 (17.60%) | 48,378 (54.06%) | 53,436 (55.11%) | 24,428 (27.30%) | 25,458 (26.26%) | 977 (1.09%) | 995 (1.03%) | 89,492 | 96,954 |
East Londonderry | 39,144 (39.26%) | 41,106 (39.80%) | 43,277 (43.40%) | 44,461 (43.05%) | 16,548 (16.42%) | 16,962 (16.60%) | 745 (0.75%) | 756 (0.73%) | 99,714 | 103,285 |
Fermanagh and South Tyrone | 60,742 (55.62%) | 64,271 (57.49%) | 35,406 (32.42%) | 34,501 (30.86%) | 12,087 (11.07%) | 12,021 (10.75%) | 973 (0.89%) | 997 (0.89%) | 109,208 | 111,790 |
Foyle | 72,966 (70.40%) | 69,411 (71.33%) | 18,332 (17.69%) | 16,241 (16.69%) | 11,279 (10.88%) | 10,620 (10.91%) | 1,075 (1.04%) | 1,033 (1.06%) | 103,652 | 97,305 |
Lagan Valley | 22,185 (19.68%) | 23,802 (21.25%) | 60,598 (53.77%) | 59,416 (53.05%) | 28,239 (25.06%) | 27,255 (24.33%) | 1,685 (1.50%) | 1,537 (1.37%) | 112,707 | 112,010 |
Mid Ulster | 69,196 (65.10%) | 66,568 (63.26%) | 27,466 (25.84%) | 28,847 (27.41%) | 9,063 (8.53%) | 9,245 (8.79%) | 560 (0.53%) | 570 (0.54%) | 106,285 | 105,230 |
Newry and Armagh | 77,515 (62.99%) | 71,766 (64.22%) | 31,766 (25.81%) | 27,189 (24.33%) | 12,822 (10.42%) | 11,881 (10.63%) | 950 (0.77%) | 911 (0.82%) | 123,053 | 111,747 |
North Antrim | 29,679 (26.44%) | 28,245 (27.20%) | 61,784 (55.04%) | 56,171 (54.10%) | 12,822 (17.86%) | 11,881 (18.01%) | 950 (0.67%) | 911 (0.69%) | 112,262 | 103,831 |
North Down | 9,959 (10.69%) | 10,352 (10.57%) | 49,817 (55.04%) | 52,671 (54.10%) | 32,184 (17.86%) | 33,627 (18.01%) | 1,210 (0.67%) | 1,248 (0.69%) | 93,170 | 97,898 |
South Antrim | 32,530 (30.58%) | 31,490 (29.58%) | 48,559 (45.64%) | 49,475 (46.48%) | 24,078 (22.63%) | 24,286 (22.82%) | 1,123 (1.12%) | 1,190 (1.15%) | 106,390 | 106,441 |
South Down | 74,536 (65.22%) | 68,036 (64.65%) | 25,242 (22.09%) | 24,284 (23.07%) | 13,780 (12.06%) | 12,249 (11.64%) | 727 (0.64%) | 672 (0.64%) | 114,285 | 105,241 |
Strangford | 14,195 (15.15%) | 20,494 (20.88%) | 52,951 (56.53%) | 51,089 (52.05%) | 25,555 (27.28%) | 25,622 (26.10%) | 967 (1.03%) | 949 (0.97%) | 93,668 | 98,154 |
Upper Bann | 54,172 (41.82%) | 50,007 (40.98%) | 50,581 (39.05%) | 48,722 (39.92%) | 23,069 (17.81%) | 21,686 (17.77%) | 1,699 (1.31%) | 1,624 (1.33%) | 129,521 | 122,039 |
West Tyrone | 61,050 (65.65%) | 65,634 (65.80%) | 23,929 (25.73%) | 25,585 (25.65%) | 7,470 (8.03%) | 7,961 (7.98%) | 541 (0.58%) | 573 (0.57%) | 92,990 | 99,753 |
The following table details the proposed changes, based on the commission's final report. [16]
Grouping of council areas | Number of constituencies | Number unchanged |
---|---|---|
Aberdeen City | 2 (–) | 0 |
Aberdeenshire, Argyll and Bute, Highland, and Moray | 7 (−1) | 1 |
Angus, Clackmannanshire, Dundee City, Falkirk, Fife, Perth and Kinross, Stirling, and West Lothian | 13 (–) | 0 |
Dumfries and Galloway, East Dunbartonshire, North Lanarkshire, Scottish Borders, South Lanarkshire, and West Dunbartonshire | 12 (–) | 1 |
City of Edinburgh, East Lothian, and Midlothian | 7 (–) | 1 |
East Ayrshire, North Ayrshire, and South Ayrshire | 4 (–) | 4 |
East Renfrewshire | 1 (–) | 1 |
Glasgow City, Inverclyde, and Renfrewshire | 9 (−1) | 0 |
Na h-Eileanan an Iar, Orkney Islands and Shetland Islands | 2 (protected) | 2 |
The final recommendations on the new constituencies in Wales were published on 28 June 2023 by the Boundary Commission for Wales. [29] [30] This followed years of proposals and consultations since 2021, with initial proposals published in 2021 [31] and revised in 2022. [32]
Legend – New constituency; expanded constituency; redefined constituency; revived constituency
According to analysis carried out by electoral modelling consultancy Electoral Calculus, a total of 24 constituencies would disappear (i.e. be broken up and not form the larger part of any proposed seats), offset by 24 wholly new constituencies (proposed seats which do not contain the larger part of any pre-existing seat). If the 2019 general election was re-run under the boundaries in the final proposals, it was estimated that a further 15 seats would change hands. The overall effect would be a net gain of 11 seats for the Conservatives, a net loss of 6 for Labour, a loss of 3 for the Liberal Democrats and 2 for Plaid Cymru. [33] This was further analysed as follows:
Party | New seats | Abolished seats | Seats changing hands | Total | |
---|---|---|---|---|---|
Gain | Loss | ||||
Conservative | +19 | −11 | +8 | −5 | +11 |
Labour | +5 | −10 | +4 | −5 | −6 |
Liberal Democrat | – | – | – | −3 | −3 |
Scottish National | – | −2 | +3 | −1 | 0 |
Plaid Cymru | – | −1 | – | −1 | −2 |
Total | +24 | −24 | +15 | −15 | – |
In January 2024, professors Colin Rallings and Michael Thrasher published detailed estimates of what the result would have been had the new boundaries been in place at the previous general election. This analysis shows the Conservatives would have won seven additional seats in 2019, with Labour losing two, the Liberal Democrats three and Plaid Cymru two. [34]
In total, there are 211 newly named constituencies, with the same number of seat names no longer being used (comprising just under one third of the total of 650). These constituencies are listed alphabetically below. Note that a constituency name remaining the same or changing does not necessarily correlate with how much the seat's boundaries change, or whether the constituency would be seen as a "new constituency". For example, the pre-2023 Burton changes name to become the post-2023 Burton and Uttoxeter, but its boundaries remain identical; on the other hand, the constituency name Newcastle upon Tyne North remains the same after the review, but the majority of the post-review constituency covers different territory to the pre-review constituency, with only 43% of the pre-2023 Newcastle upon Tyne North remaining in the new seat after the review.
Following the publication of the final recommendations, these are the new or re-established names of constituencies which will be fought at the next general election:
The following constituency names will no longer exist at the next general election:
Most of the new seats listed above are the result of name changes to existing constituencies following boundary changes of varying degrees, including five where the boundaries are unchanged. An existing seat where no part forms the largest part of any new seat is considered to be "disappearing". Conversely, any new seat which doesn't contain the largest part of any existing seat is considered to be genuinely "newly created".
The table below lists the disappearing and newly created constituencies. [35]
Region/Nation | Net change | Disappearing | Newly created |
---|---|---|---|
East Midlands | +1 | ||
Eastern | +3 | ||
London | +2 | ||
North East | −2 | ||
North West | −2 | ||
South East | +7 | ||
South West | +3 | ||
West Midlands | −2 | ||
Yorkshire and the Humber | 0 | ||
Scotland | −2 | ||
Wales | −8 |
An existing seat can be regarded as being linked to a newly named seat where part of the existing seat contributes the largest part of the newly named seat. There are a total of 187 linked constituencies, many of which involve significant changes resulting from the knock-on impact of new or abolished seats within review areas. However, some arise from the consultation process and involve only minor changes. The table below lists those constituencies with name changes, indicating the extent of the changes by reference to the proportion of the old constituency included in the new constituency, or the proportion of the new in the old, which ever is the lesser:
Sources:
The list below indicates those constituencies which have retained their names, but where boundary changes have resulted in major changes – where the proportion of the existing electorate included in the redefined constituency or vice versa, which ever is the lesser, is less than 75%.
In the United Kingdom, the boundary commissions are non-departmental public bodies responsible for determining the boundaries of parliamentary constituencies for elections to the House of Commons. There are four boundary commissions: one each for England, Scotland, Wales and Northern Ireland.
Blaydon is a constituency represented in the House of Commons since 2017 by Liz Twist of the Labour Party.
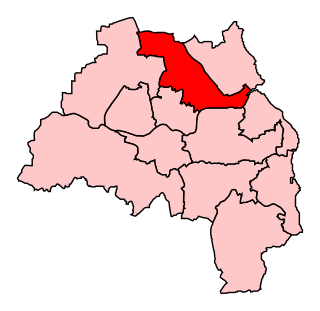
North Tyneside is a constituency represented in the House of Commons of the UK Parliament since 2010 by Mary Glindon of the Labour Party.
East Ham is a constituency in the London Borough of Newham represented in the House of Commons of the UK Parliament since its creation in 1997 by Stephen Timms of the Labour Party.
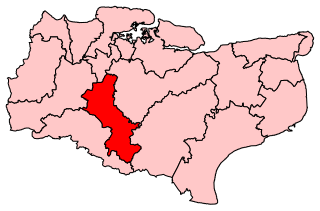
Maidstone and The Weald is a constituency in Kent represented in the House of Commons of the UK Parliament since 2010 by Helen Grant of the Conservative Party. She succeeded fellow party member Ann Widdecombe, who had held the seat since it was created for the 1997 general election.
The Parliament of the United Kingdom currently has 650 parliamentary constituencies across the constituent countries, each electing a single member of parliament (MP) to the House of Commons by the plurality voting system, ordinarily every five years. Voting last took place in all 650 of those constituencies at the United Kingdom general election on 12 December 2019.
Washington and Sunderland West is a constituency represented in the House of Commons of the UK Parliament since its 2010 creation by Sharon Hodgson, a member of the Labour Party.
Milton Keynes South is a constituency represented in the House of Commons of the UK Parliament since its 2010 creation by Iain Stewart, a Conservative.
Thornbury and Yate is a constituency represented in the House of Commons of the UK Parliament since the 2015 election by Luke Hall, a member of the Conservative Party. Encompassing an area to the north-east of Bristol, it is one of three constituencies that make up the South Gloucestershire Unitary Authority Area, along with Filton and Bradley Stoke and Kingswood.
The Fifth Periodic Review of Westminster constituencies was undertaken between 2000 and 2007 by the four boundary commissions for England, Scotland, Wales and Northern Ireland for the UK Parliament. The changes for England, Wales and Northern Ireland took effect at the 2010 United Kingdom general election; that for Scotland took effect at the 2005 election. All of the recommendations were approved.
Blaydon and Consett is a proposed constituency of the House of Commons in the UK Parliament. Further to the completion of the 2023 Periodic Review of Westminster constituencies, it will first be contested at the next general election.
This article covers the timeline of the most recent cycle of the process to redraw the constituency map for the House of Commons, namely the 2023 Periodic Review of Westminster constituencies. The new constituency borders came into law on 29 November 2023. For a summary of the outcome of the review, see 2023 Periodic Review of Westminster constituencies.