Wrexham | |
---|---|
County constituency for the House of Commons | |
Preserved county | Clwyd |
Electorate | 53,733 (December 2010) [1] |
Major settlements | Wrexham, Gwersyllt, Llay, Gresford |
Current constituency | |
Created | 1918 |
Member of Parliament | Sarah Atherton (Conservative) |
Seats | One |
Created from | Denbigh Boroughs and East Denbighshire |
Overlaps | |
Senedd | Wrexham, North Wales |
Wrexham (Welsh: Wrecsam) is a parliamentary constituency [n 1] centred on the city of Wrexham in the preserved county of Clwyd, Wales in the United Kingdom. It was created in 1918, and is represented in the House of Commons of the UK Parliament from December 2019 by Sarah Atherton of the Conservative Party. [n 2]
The constituency is to retain its name and gain wards, as part of the 2023 Periodic Review of Westminster constituencies and under the June 2023 final recommendations of the Boundary Commission for Wales for the next United Kingdom general election. [2]
Labour won the seat in all general elections from 1935 until 2019, when Conservative Sarah Atherton became the first woman elected to represent Wrexham. [3]
Tom Ellis, first elected in 1970, defected in 1981 to the newly founded Social Democratic Party. In 1983, he unsuccessfully stood for Clwyd South West instead. [4]
Turnout has ranged between 59.5% in 2001 and 87.3% in 1950.
Until 1885, Wrexham was part of the Denbighshire parliamentary constituency, which elected one Member of Parliament until the Reform Act 1832 increased this to two members. In 1885 the Denbighshire constituency was split — the area covered today became part of East Denbighshire constituency.
In 1918 the Wrexham constituency was created, electing one Member of Parliament. For the 1983 general election, major boundary reorganisation saw large areas removed from the Wrexham constituency to form the new constituency of Clwyd South West (later to become Clwyd South).
Wrexham constituency consists of the following electoral wards: Acton, Borras Park, Brynyffynnon, Cartrefle, Erddig, Garden Village, Gresford East and West, Grosvenor, Gwersyllt East and South, Gwersyllt North, Gwersyllt West, Hermitage, Holt, Little Acton, Llay, Maesydre, Marford and Hoseley, Offa, Queensway, Rhosnesni, Rossett, Smithfield, Stansty, Whitegate, Wynnstay.
1918–1949: The Municipal Borough of Wrexham, and the Rural District of Wrexham, and part of Chirk.
1950–1983: The Municipal Borough of Wrexham, and part of the Rural Districts of Ceiriog, and Wrexham. [5]
Party | Candidate | Votes | % | ±% | |
---|---|---|---|---|---|
C | Liberal | Robert Thomas | 20,874 | 76.3 | N/A |
Labour | Hugh Hughes | 6,500 | 23.7 | N/A | |
Majority | 14,374 | 52.6 | N/A | ||
Turnout | 27,374 | 69.7 | N/A | ||
Registered electors | 39,259 | ||||
Liberal win (new seat) | |||||
Cindicates candidate endorsed by the coalition government. |
Party | Candidate | Votes | % | ±% | |
---|---|---|---|---|---|
Labour | Robert Richards | 11,940 | 35.8 | +12.1 | |
National Liberal | E.R. Davies | 10,842 | 32.6 | ―43.7 | |
Unionist | R.C.G Roberts | 10,508 | 31.6 | N/A | |
Majority | 1,098 | 3.2 | N/A | ||
Turnout | 33,290 | 84.4 | +14.7 | ||
Registered electors | 39,446 | ||||
Labour gain from Liberal | Swing | +27.9 | |||
Party | Candidate | Votes | % | ±% | |
---|---|---|---|---|---|
Labour | Robert Richards | 12,918 | 39.0 | +3.2 | |
Liberal | Horace Alexander Morgan | 11,037 | 33.4 | +0.8 | |
Unionist | Edmund Fleming Bushby | 9,131 | 27.6 | ―4.0 | |
Majority | 1,881 | 5.6 | +2.4 | ||
Turnout | 33,086 | 81.1 | ―3.3 | ||
Registered electors | 40,789 | ||||
Labour hold | Swing | +1.2 | |||
Party | Candidate | Votes | % | ±% | |
---|---|---|---|---|---|
Liberal | Christmas Price Williams | 19,154 | 55.6 | +22.2 | |
Labour | Robert Richards | 15,291 | 44.4 | +5.4 | |
Majority | 3,863 | 11.2 | N/A | ||
Turnout | 35,445 | 82.6 | +1.5 | ||
Registered electors | 41,686 | ||||
Liberal gain from Labour | Swing | ||||
Party | Candidate | Votes | % | ±% | |
---|---|---|---|---|---|
Labour | Robert Richards | 20,584 | 46.4 | +2.0 | |
Liberal | Christmas Price Williams | 13,997 | 31.5 | ―24.1 | |
Unionist | Edmund Fleming Bushby | 9,820 | 22.1 | N/A | |
Majority | 6,587 | 14.9 | N/A | ||
Turnout | 44,401 | 84.9 | +2.3 | ||
Registered electors | 52,310 | ||||
Labour gain from Liberal | Swing | +13.0 | |||
Party | Candidate | Votes | % | ±% | |
---|---|---|---|---|---|
Liberal | Aled Roberts | 22,474 | 52.1 | +20.6 | |
Labour | Robert Richards | 20,653 | 47.9 | +1.5 | |
Majority | 1,821 | 4.2 | N/A | ||
Turnout | 43,127 | 79.8 | ―5.1 | ||
Registered electors | 54,048 | ||||
Liberal gain from Labour | Swing | ||||
Party | Candidate | Votes | % | ±% | |
---|---|---|---|---|---|
Labour | Robert Richards | 23,650 | 56.3 | +8.4 | |
Liberal | Aled Roberts | 18,367 | 43.7 | ―8.4 | |
Majority | 5,283 | 12.6 | N/A | ||
Turnout | 42,017 | 75.5 | +4.3 | ||
Registered electors | 55,656 | ||||
Labour gain from Liberal | Swing | ||||
General Election 1939–40: Another general election was required to take place before the end of 1940. The political parties had been making preparations for an election to take place from 1939 and by the end of this year, the following candidates had been selected;
Party | Candidate | Votes | % | ±% | |
---|---|---|---|---|---|
Labour | Robert Richards | 26,854 | 56.0 | ―0.3 | |
National Liberal | David Leslie Milne | 13,714 | 28.6 | N/A | |
Liberal | John David Williams | 6,960 | 14.5 | ―29.2 | |
Independent (nationalist) | John Rathbone Hayes-Jones | 430 | 0.9 | N/A | |
Majority | 13,140 | 27.4 | +14.8 | ||
Turnout | 47,958 | 76.8 | +1.3 | ||
Registered electors | 62,446 | ||||
Labour hold | Swing | ||||
Party | Candidate | Votes | % | ±% | |
---|---|---|---|---|---|
Labour | Robert Richards | 32,042 | 57.8 | +1.8 | |
National Liberal | Willoughby Gervase Cooper | 14,117 | 25.5 | ―3.1 | |
Liberal | Herbert Mostyn Lewis | 8,287 | 15.0 | +0.5 | |
Plaid Cymru | Geraint Bowen | 960 | 1.7 | N/A | |
Majority | 17,925 | 32.3 | +4.9 | ||
Turnout | 55,406 | 87.3 | +10.5 | ||
Registered electors | 63,455 | ||||
Labour hold | Swing | ||||
Party | Candidate | Votes | % | ±% | |
---|---|---|---|---|---|
Labour | Robert Richards | 33,759 | 61.5 | +3.7 | |
National Liberal | Willoughby Gervase Cooper | 19,124 | 34.8 | +9.3 | |
Plaid Cymru | A Daniel Thomas | 1,997 | 3.6 | +1.9 | |
Majority | 14,635 | 26.7 | ―5.6 | ||
Turnout | 54,880 | 84.8 | ―2.5 | ||
Registered electors | 64,736 | ||||
Labour hold | Swing | ||||
Party | Candidate | Votes | % | ±% | |
---|---|---|---|---|---|
Labour | Idwal Jones | 23,402 | 57.9 | ―3.6 | |
National Liberal | Griffith Winston Guthrie Jones | 12,476 | 30.8 | ―4.0 | |
Plaid Cymru | Elystan Morgan | 4,572 | 11.3 | +7.7 | |
Majority | 10,926 | 27.1 | +0.4 | ||
Turnout | 46,072 | 62.4 | ―22.4 | ||
Registered electors | 64,788 | ||||
Labour hold | Swing | ||||
Party | Candidate | Votes | % | ±% | |
---|---|---|---|---|---|
Labour | Idwal Jones | 27,945 | 56.6 | ―4.9 | |
National Liberal | Griffith Winston Guthrie Jones | 16,286 | 33.0 | ―1.8 | |
Plaid Cymru | Elystan Morgan | 5,139 | 10.4 | +6.8 | |
Majority | 11,659 | 23.6 | ―3.1 | ||
Turnout | 49,370 | 76.2 | ―8.6 | ||
Registered electors | 64,788 | ||||
Labour hold | Swing | ||||
Party | Candidate | Votes | % | ±% | |
---|---|---|---|---|---|
Labour | Idwal Jones | 30,101 | 55.9 | ―0.7 | |
National Liberal | Griffith Hughes Pierce | 17,144 | 31.9 | ―1.1 | |
Plaid Cymru | Elystan Morgan | 6,579 | 12.2 | +1.8 | |
Majority | 12,957 | 24.0 | +0.4 | ||
Turnout | 53,824 | 81.4 | +5.2 | ||
Registered electors | 66,150 | ||||
Labour hold | Swing | ||||
Party | Candidate | Votes | % | ±% | |
---|---|---|---|---|---|
Labour | Idwal Jones | 30,478 | 58.2 | +2.3 | |
National Liberal | Griffith Hughes Pierce | 17,240 | 32.9 | +1.0 | |
Plaid Cymru | John Richard Thomas | 4,673 | 8.9 | ―3.3 | |
Majority | 13,238 | 25.3 | +1.3 | ||
Turnout | 52,391 | 78.7 | ―2.7 | ||
Registered electors | 66,530 | ||||
Labour hold | Swing | ||||
Party | Candidate | Votes | % | ±% | |
---|---|---|---|---|---|
Labour | Idwal Jones | 30,039 | 58.6 | ―0.4 | |
Conservative | Griffith Hughes Pierce | 12,596 | 24.6 | ―8.3 | |
Liberal | Wilfred McBriar | 6,351 | 12.4 | N/A | |
Plaid Cymru | John Richard Thomas | 2,297 | 4.5 | ―4.4 | |
Majority | 17,443 | 34.0 | +8.7 | ||
Turnout | 51,283 | 77.2 | ―1.5 | ||
Registered electors | 66,441 | ||||
Labour hold | Swing | +4.3 | |||
Party | Candidate | Votes | % | ±% | |
---|---|---|---|---|---|
Labour | Tom Ellis | 31,089 | 56.8 | ―1.8 | |
Conservative | Benjamin Patterson | 15,649 | 28.6 | +4.0 | |
Liberal | Wilfred McBriar | 5,067 | 9.3 | ―3.1 | |
Plaid Cymru | Cyril Golding | 2,894 | 5.3 | +0.8 | |
Majority | 15,440 | 28.2 | ―5.8 | ||
Turnout | 54,699 | 75.1 | ―2.1 | ||
Registered electors | 72,814 | ||||
Labour hold | Swing | ||||
Party | Candidate | Votes | % | ±% | |
---|---|---|---|---|---|
Labour | Tom Ellis | 27,384 | 46.7 | ―10.1 | |
Conservative | John Laurence Pritchard | 14,301 | 24.4 | ―4.2 | |
Liberal | Martin Thomas | 14,297 | 24.4 | +15.1 | |
Plaid Cymru | Hywel Wyn Roberts | 2,624 | 4.5 | ―0.8 | |
Majority | 13,083 | 22.3 | ―5.9 | ||
Turnout | 58,606 | 77.6 | +2.5 | ||
Registered electors | 75,492 | ||||
Labour hold | Swing | ||||
Party | Candidate | Votes | % | ±% | |
---|---|---|---|---|---|
Labour | Tom Ellis | 28,885 | 51.1 | +4.4 | |
Liberal | Martin Thomas | 12,519 | 22.1 | ―2.3 | |
Conservative | John Pritchard | 12,251 | 21.7 | ―2.7 | |
Plaid Cymru | Hywel Wyn Roberts | 2,859 | 5.1 | +0.6 | |
Majority | 16,366 | 29.0 | +6.7 | ||
Turnout | 56,514 | 74.3 | ―3.3 | ||
Registered electors | 76,106 | ||||
Labour hold | Swing | ||||
Party | Candidate | Votes | % | ±% | |
---|---|---|---|---|---|
Labour | Tom Ellis | 30,405 | 49.2 | ―1.9 | |
Conservative | Roger Graham-Palmer | 18,256 | 29.6 | +7.9 | |
Liberal | Martin Thomas | 11,389 | 18.4 | ―3.7 | |
Plaid Cymru | Hywel Wyn Roberts | 1,740 | 2.8 | ―2.3 | |
Majority | 12,149 | 19.6 | ―9.4 | ||
Turnout | 56,514 | 78.4 | +4.1 | ||
Registered electors | 78,771 | ||||
Labour hold | Swing | ||||
Party | Candidate | Votes | % | ±% | |
---|---|---|---|---|---|
Labour | John Marek | 16,120 | 34.3 | ―14.9 | |
Conservative | Cynthia Kay Wood | 15,696 | 33.4 | +3.8 | |
Liberal | Martin Thomas | 13,974 | 29.7 | +11.3 | |
Plaid Cymru | John Thomas | 1,239 | 2.6 | ―0.2 | |
Majority | 424 | 0.9 | ―18.7 | ||
Turnout | 47,029 | 77.5 | ―0.9 | ||
Registered electors | 60,707 | ||||
Labour hold | Swing | ―10.5 | |||
Party | Candidate | Votes | % | ±% | |
---|---|---|---|---|---|
Labour | John Marek | 22,144 | 43.9 | +9.6 | |
Conservative | Roger Graham-Palmer | 17,992 | 35.6 | +2.2 | |
Liberal | Martin Thomas | 9,808 | 19.4 | ―10.3 | |
Plaid Cymru | Dennis Watkins | 539 | 1.1 | ―1.5 | |
Majority | 4,152 | 8.3 | +7.4 | ||
Turnout | 50,483 | 80.9 | +3.4 | ||
Registered electors | 62,401 | ||||
Labour hold | Swing | ||||
Party | Candidate | Votes | % | ±% | |
---|---|---|---|---|---|
Labour | John Marek | 24,830 | 48.3 | +4.4 | |
Conservative | Owen Paterson | 18,114 | 35.2 | ―0.4 | |
Liberal Democrats | Andrew Thomas | 7,074 | 13.8 | ―5.6 | |
Plaid Cymru | Gareth Wheatley | 1,415 | 2.8 | +1.7 | |
Majority | 6,716 | 13.1 | +4.8 | ||
Turnout | 51,433 | 80.7 | ―0.2 | ||
Registered electors | 63,720 | ||||
Labour hold | Swing | +2.4 | |||
Party | Candidate | Votes | % | ±% | |
---|---|---|---|---|---|
Labour | John Marek | 20,450 | 56.1 | +6.1 | |
Conservative | Stuart Andrew | 8,688 | 23.9 | ―8.5 | |
Liberal Democrats | Andrew Thomas | 4,833 | 13.3 | ―1.7 | |
Referendum | John Cronk | 1,195 | 3.3 | N/A | |
Plaid Cymru | Kevin Plant | 1,170 | 3.2 | +0.5 | |
Natural Law | Nicholas Low | 86 | 0.2 | N/A | |
Majority | 11,762 | 32.2 | +14.7 | ||
Turnout | 36,422 | 71.8 | ―8.9 | ||
Registered electors | 50,741 | ||||
Labour hold | Swing | +7.4 | |||
Party | Candidate | Votes | % | ±% | |
---|---|---|---|---|---|
Labour | Ian Lucas | 15,934 | 53.0 | ―3.1 | |
Conservative | Felicity Elphick | 6,746 | 22.5 | ―1.4 | |
Liberal Democrats | Ronald Davies | 5,153 | 17.1 | +3.8 | |
Plaid Cymru | Malcolm Evans | 1,783 | 5.9 | +2.7 | |
UKIP | Jane Brookes | 432 | 1.4 | N/A | |
Majority | 9,188 | 30.5 | ―1.7 | ||
Turnout | 30,048 | 59.5 | ―12.3 | ||
Registered electors | 50,465 | ||||
Labour hold | Swing | ―0.8 | |||
Party | Candidate | Votes | % | ±% | |
---|---|---|---|---|---|
Labour | Ian Lucas | 13,993 | 46.1 | ―6.9 | |
Liberal Democrats | Tom Rippeth | 7,174 | 23.6 | +6.5 | |
Conservative | Thérèse Coffey | 6,079 | 20.0 | ―2.5 | |
Plaid Cymru | Sion Owen | 1,744 | 5.7 | ―0.2 | |
BNP | John Walker | 919 | 3.0 | N/A | |
Forward Wales | Janet Williams | 476 | 1.6 | N/A | |
Majority | 6,819 | 22.5 | ―8.0 | ||
Turnout | 30,385 | 63.3 | +3.8 | ||
Registered electors | 48,016 | ||||
Labour hold | Swing | ―6.7 | |||
Party | Candidate | Votes | % | ±% | |
---|---|---|---|---|---|
Labour | Ian Lucas | 12,161 | 36.9 | ―9.2 | |
Liberal Democrats | Tom Rippeth | 8,503 | 25.8 | +2.2 | |
Conservative | Gareth Hughes | 8,375 | 25.4 | +5.4 | |
Plaid Cymru | Arfon Jones | 2,029 | 6.2 | +0.5 | |
BNP | Mel Roberts | 1,134 | 3.4 | +0.4 | |
UKIP | John Humberstone | 774 | 2.3 | N/A | |
Majority | 3,658 | 11.1 | ―11.4 | ||
Turnout | 32,976 | 64.8 | +1.5 | ||
Registered electors | 50,872 | ||||
Labour hold | Swing | ―5.7 | |||
Party | Candidate | Votes | % | ±% | |
---|---|---|---|---|---|
Labour | Ian Lucas | 12,181 | 37.2 | +0.3 | |
Conservative | Andrew Atkinson | 10,350 | 31.6 | +6.2 | |
UKIP | Niall Plevin-Kelly | 5,072 | 15.5 | +13.2 | |
Plaid Cymru | Carrie Harper | 2,501 | 7.6 | +1.4 | |
Liberal Democrats | Rob Walsh | 1,735 | 5.3 | ―20.5 | |
Green | David Munnerley | 669 | 2.0 | N/A | |
Independent | Brian Edwards [33] | 211 | 0.6 | N/A | |
Rejected ballots | 55 | ||||
Majority | 1,831 | 5.6 | ―5.5 | ||
Turnout | 32,719 | 64.2 | ―0.6 | ||
Registered electors | 50,992 | ||||
Labour hold | Swing | ―2.9 | |||
Of the 55 rejected ballots:
Party | Candidate | Votes | % | ±% | |
---|---|---|---|---|---|
Labour | Ian Lucas | 17,153 | 48.9 | +11.7 | |
Conservative | Andrew Atkinson | 15,321 | 43.7 | +12.1 | |
Plaid Cymru | Carrie Harper | 1,753 | 5.0 | ―2.6 | |
Liberal Democrats | Carole O’Toole | 865 | 2.5 | ―2.8 | |
Rejected ballots | 68 | ||||
Majority | 1,832 | 5.2 | ―0.4 | ||
Turnout | 35,092 | 69.6 | +5.4 | ||
Registered electors | 50,245 | ||||
Labour hold | Swing | ―0.2 | |||
Of the 68 rejected ballots:
Party | Candidate | Votes | % | ±% | |
---|---|---|---|---|---|
Conservative | Sarah Atherton | 15,199 | 45.3 | +1.6 | |
Labour Co-op | Mary Wimbury | 13,068 | 39.0 | ―9.9 | |
Plaid Cymru | Carrie Harper | 2,151 | 6.4 | +1.4 | |
Liberal Democrats | Tim Sly | 1,447 | 4.3 | +1.8 | |
Brexit Party | Ian Berkeley-Hurst | 1,222 | 3.6 | N/A | |
Green | Duncan Rees | 445 | 1.3 | N/A | |
Majority | 2,131 | 6.3 | N/A | ||
Rejected ballots | 70 | ||||
Turnout | 33,532 | 67.4 | ―2.2 | ||
Registered electors | 49,734 | ||||
Conservative gain from Labour | Swing | +5.8 | |||
Of the 70 rejected ballots:
Party | Candidate | Votes | % | ±% | |
---|---|---|---|---|---|
Conservative | Sarah Atherton [40] | ||||
Plaid Cymru | Becca Martin | ||||
Labour | Andrew Ranger | ||||
Green | Tim Morgan [41] | ||||
Majority | |||||
Rejected ballots | |||||
Turnout | |||||
Registered electors | |||||
Swing | |||||
Aberavon is a constituency represented in the House of Commons of the Parliament of the United Kingdom since 2015 by Stephen Kinnock of the Welsh Labour Party. It includes the town of Aberavon, although the largest town in the constituency is Port Talbot.
Swansea West is a constituency of the House of Commons of the Parliament of the United Kingdom. It elects one Member of Parliament (MP) by the first past the post system of election, and is currently represented by Geraint Davies of Labour Co-op, who was first elected in the constituency in 2010.
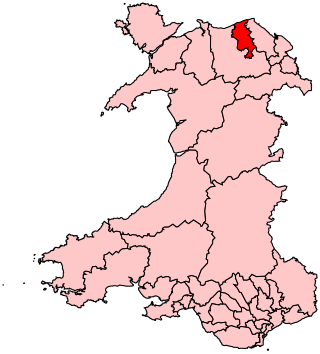
The Vale of Clwyd is a constituency of the House of Commons of the UK Parliament created in 1997 and represented since 2019 by James Davies of the Conservative Party. As with all extant seats its electorate elect one Member of Parliament (MP) by the first past the post system at least every five years.
Cardiff North is a constituency represented in the House of Commons of the UK Parliament since 2017 by Anna McMorrin of the Labour Party.
Monmouth is a county constituency of the House of Commons of the Parliament of the United Kingdom. The seat was created for the 1918 general election. Since 2005 the Member of Parliament (MP) has been David Davies of the Conservative Party.
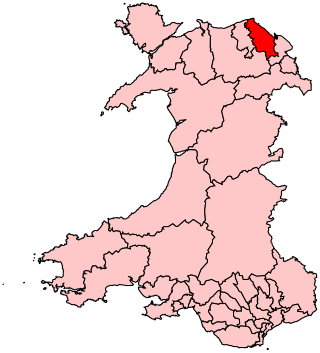
Alyn and Deeside is a parliamentary constituency represented in the House of Commons of the Parliament of the United Kingdom. The constituency was created in 1983, and it elects one Member of Parliament (MP) by the first-past-the-post method of election.
Bridgend is a constituency represented in the House of Commons of the UK Parliament since 2019 by Jamie Wallis, a Conservative.
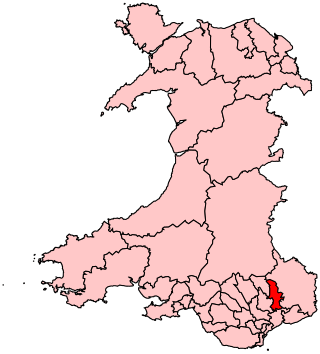
Caerphilly is a constituency centred on the town of Caerphilly in South Wales, represented in the House of Commons of the UK Parliament since 2001 by Wayne David of the Labour Party.
Cardiff West is a constituency represented in the House of Commons of the UK Parliament since 2001 by Kevin Brennan of the Labour Party.
Clwyd South is a constituency of the House of Commons of the Parliament of the United Kingdom (Westminster). The constituency was created in 1997, and it elects one Member of Parliament (MP) by the first past the post method of election.
Clwyd West is a constituency of the House of Commons of the Parliament of the United Kingdom. It elects one Member of Parliament (MP) by the first past the post method of election. The current MP is David Jones of the Conservative Party, first elected at the 2005 general election and who also served as Secretary of State for Wales from 4 September 2012 until 14 July 2014.
Delyn is a constituency represented in the House of Commons of the UK Parliament since 2019 by Rob Roberts, who was elected as a Conservative, but currently sits as an Independent following sexual harassment allegations.
Islwyn is a constituency in Wales represented in the House of Commons of the Parliament of the United Kingdom. The area, historically known for coal-mining, has voted for Labour Party candidates since it was created effective at the 1983 general election. Islwyn's first Member of Parliament (MP) was Neil Kinnock, who represented it until he resigned from Parliament in 1995. Kinnock also served as Leader of the Labour Party and Leader of the Opposition from 1983 until 1992. The constituency's current MP is Chris Evans, first elected at the 2010 general election.
Llanelli is a constituency of the House of Commons of the Parliament of the United Kingdom. From 1918 to 1970 the official spelling of the constituency name was Llanelly. It elects one Member of Parliament (MP) by the first past the post system of election. Since 2005, it is currently represented by Nia Griffith of the Labour Party.
Merthyr Tydfil and Rhymney is a constituency represented in the House of Commons of the UK Parliament since 2015 by Gerald Jones of the Welsh Labour Party. It was established for the 1983 general election.
Montgomeryshire is a constituency in Wales represented in the House of Commons of the UK Parliament.
Ogmore is a constituency created in 1918 represented in the House of Commons of the UK Parliament by Chris Elmore of the Labour Party.
Swansea East is a borough constituency represented in the House of Commons of the Parliament of the United Kingdom by Carolyn Harris of the Labour Party.
Torfaen is a constituency in Wales represented in the House of Commons of the UK Parliament since 2015 by Nick Thomas-Symonds, a member of the Labour Party who also serves as the Shadow Secretary of State for International Trade. It was established for the 1983 general election.
Wirral South is a constituency in Merseyside, England represented in the House of Commons of the UK Parliament by Alison McGovern of the Labour Party since 2010.