Dudley | |
---|---|
Borough constituency for the House of Commons | |
Current constituency | |
Created | 2024 |
Member of Parliament | None |
Seats | One |
Created from | Dudley North Dudley South |
1832–February 1974 | |
Seats | One |
Created from | Worcestershire |
Replaced by | Dudley East Dudley West |
Dudley was a parliamentary constituency centred on the town of Dudley in Worcestershire (now in the West Midlands) which existed between 1832 and 1974. It returned one Member of Parliament (MP) to the House of Commons of the Parliament of the United Kingdom, elected by the first past the post system.
Further to the completion of the 2023 Periodic Review of Westminster constituencies, the seat will be re-established for the 2024 general election, formed from the current seat of Dudley North with the addition of one ward from the disappearing Dudley South constituency. [1]
The borough of Dudley returned two members to Parliament in 1294, Benedict Andrew and Ralph Clerk de Duddlegh, but not to any subsequent one. [2]
The constituency was created by the Reform Act 1832 for the 1832 general election. It was abolished for the February 1974 general election, when it was replaced by the new Dudley East and Dudley West constituencies, which expanded beyond the town's historic boundaries to include Coseley and part of Sedgley in Dudley East (previously in the old Bilston constituency), as well as Kingswinford, Brierley Hill, and the remainder of Sedgley in Dudley West. All of these areas had been incorporated into the Dudley borough in 1966. [3]
In the 2023 Periodic Review of Westminster constituencies, it was decided that Dudley would return as a constituency, made up of the current Dudley North wards as well as the added Brockmoor and Pensnett wards.
1918–1950: The County Borough of Dudley, and the parish of Dudley Castle Hill.
1950–1974: The County Borough of Dudley, and the Borough of Stourbridge.
The re-established constituency will be composed of the following (as they existed on 1 December 2020):
It will comprise the whole of the current Dudley North constituency with the addition of the Brockmoor and Pensnett ward from Dudley South (to be abolished), thus bringing the electorate within the permitted range.
Party | Candidate | Votes | % | ||
---|---|---|---|---|---|
Whig | John Campbell | 318 | 58.1 | ||
Tory | Sir Horace St Paul, 1st Baronet | 229 | 41.9 | ||
Majority | 89 | 16.2 | |||
Turnout | 547 | 81.6 | |||
Registered electors | 670 | ||||
Whig win (new seat) |
Campbell was appointed as Attorney General for England and Wales, requiring a by-election.
Party | Candidate | Votes | % | ±% | |
---|---|---|---|---|---|
Tory | Thomas Hawkes | 322 | 55.9 | +14.0 | |
Whig | John Campbell | 254 | 44.1 | −14.0 | |
Majority | 68 | 11.8 | N/A | ||
Turnout | 576 | 80.6 | −1.0 | ||
Registered electors | 715 | ||||
Tory gain from Whig | Swing | +14.0 | |||
Party | Candidate | Votes | % | ±% | |
---|---|---|---|---|---|
Conservative | Thomas Hawkes | 360 | 56.3 | +14.4 | |
Whig | John Forbes | 279 | 43.7 | −14.4 | |
Majority | 81 | 12.6 | N/A | ||
Turnout | 639 | 87.9 | +6.3 | ||
Registered electors | 727 | ||||
Conservative gain from Whig | Swing | +14.4 | |||
Party | Candidate | Votes | % | ±% | |
---|---|---|---|---|---|
Conservative | Thomas Hawkes | 385 | 57.1 | +0.8 | |
Whig | William Merryweather Turner | 289 | 42.9 | −0.8 | |
Majority | 96 | 14.2 | +1.6 | ||
Turnout | 674 | 79.9 | −8.0 | ||
Registered electors | 844 | ||||
Conservative hold | Swing | +0.8 | |||
Party | Candidate | Votes | % | ±% | |
---|---|---|---|---|---|
Conservative | Thomas Hawkes | 436 | 69.8 | +12.7 | |
Whig | William Adams Smith | 189 | 30.2 | −12.7 | |
Majority | 247 | 39.6 | +25.4 | ||
Turnout | 625 | 64.4 | −15.5 | ||
Registered electors | 971 | ||||
Conservative hold | Swing | +12.7 | |||
Hawkes resigned by accepting the office of Steward of the Chiltern Hundreds, causing a by-election.
Party | Candidate | Votes | % | ±% | |
---|---|---|---|---|---|
Conservative | John Benbow | 388 | 68.9 | −0.9 | |
Radical | William Rawson | 175 | 31.1 | +0.9 | |
Majority | 213 | 37.8 | −1.8 | ||
Turnout | 563 | 61.8 | −2.6 | ||
Registered electors | 911 | ||||
Conservative hold | Swing | −0.9 | |||
Party | Candidate | Votes | % | ±% | |
---|---|---|---|---|---|
Conservative | John Benbow | Unopposed | |||
Registered electors | 791 | ||||
Conservative hold | |||||
Party | Candidate | Votes | % | ±% | |
---|---|---|---|---|---|
Conservative | John Benbow | 400 | 63.4 | N/A | |
Radical | James Baldwin [13] [14] [15] | 231 | 36.6 | New | |
Majority | 169 | 26.8 | N/A | ||
Turnout | 631 | 69.2 | N/A | ||
Registered electors | 912 | ||||
Conservative hold | Swing | N/A | |||
Benbow's death caused a by-election.
Party | Candidate | Votes | % | ±% | |
---|---|---|---|---|---|
Conservative | Stafford Northcote | 346 | 99.1 | +35.7 | |
Radical | James Baldwin | 3 | 0.9 | −35.7 | |
Majority | 343 | 98.2 | +71.4 | ||
Turnout | 349 | 38.5 | −30.7 | ||
Registered electors | 907 | ||||
Conservative hold | Swing | +35.7 | |||
Party | Candidate | Votes | % | ±% | |
---|---|---|---|---|---|
Independent | Henry Brinsley Sheridan | Unopposed | |||
Registered electors | 884 | ||||
Independent gain from Conservative |
Party | Candidate | Votes | % | ±% | |
---|---|---|---|---|---|
Liberal | Henry Brinsley Sheridan | 432 | 54.5 | New | |
Conservative | Charles Monck | 361 | 45.5 | New | |
Majority | 71 | 9.0 | N/A | ||
Turnout | 793 | 79.9 | N/A | ||
Registered electors | 992 | ||||
Liberal gain from Independent | Swing | N/A | |||
Party | Candidate | Votes | % | ±% | |
---|---|---|---|---|---|
Liberal | Henry Brinsley Sheridan | 526 | 65.7 | +11.2 | |
Conservative | Francis Wyatt Truscott [16] | 275 | 34.3 | −11.2 | |
Majority | 251 | 31.4 | +22.4 | ||
Turnout | 801 | 59.0 | −20.9 | ||
Registered electors | 1,358 | ||||
Liberal hold | Swing | +11.2 | |||
Party | Candidate | Votes | % | ±% | |
---|---|---|---|---|---|
Liberal | Henry Brinsley Sheridan | Unopposed | |||
Registered electors | 11,847 | ||||
Liberal hold | |||||
Party | Candidate | Votes | % | ±% | |
---|---|---|---|---|---|
Liberal | Henry Brinsley Sheridan | 5,149 | 55.2 | N/A | |
Conservative | Frederick Smith-Shenstone [17] | 4,181 | 44.8 | New | |
Majority | 968 | 10.4 | N/A | ||
Turnout | 9,330 | 63.9 | N/A | ||
Registered electors | 14,593 | ||||
Liberal hold | Swing | N/A | |||
The election was declared void on petition, causing a by-election.
Party | Candidate | Votes | % | ±% | |
---|---|---|---|---|---|
Liberal | Henry Brinsley Sheridan | 5,607 | 53.4 | −1.8 | |
Conservative | Noah Hingley | 4,889 | 46.6 | +1.8 | |
Majority | 718 | 6.8 | −3.6 | ||
Turnout | 10,496 | 71.9 | +8.0 | ||
Registered electors | 14,593 | ||||
Liberal hold | Swing | −1.8 | |||
Party | Candidate | Votes | % | ±% | |
---|---|---|---|---|---|
Liberal | Henry Brinsley Sheridan | 6,948 | 62.5 | +7.3 | |
Conservative | Alfred Waterman [18] | 4,163 | 37.5 | −7.3 | |
Majority | 2,785 | 25.0 | +14.6 | ||
Turnout | 11,111 | 74.1 | +10.2 | ||
Registered electors | 15,000 | ||||
Liberal hold | Swing | +7.3 | |||
Party | Candidate | Votes | % | ±% | |
---|---|---|---|---|---|
Liberal | Henry Brinsley Sheridan | 6,377 | 55.0 | −7.5 | |
Conservative | Brooke Robinson | 5,211 | 45.0 | +7.5 | |
Majority | 1,166 | 10.0 | −15.0 | ||
Turnout | 11,588 | 77.7 | +3.6 | ||
Registered electors | 14,918 | ||||
Liberal hold | Swing | −7.5 | |||
Party | Candidate | Votes | % | ±% | |
---|---|---|---|---|---|
Conservative | Brooke Robinson | 6,475 | 58.8 | +13.8 | |
Liberal | Henry Brinsley Sheridan | 4,545 | 41.2 | -13.8 | |
Majority | 1,930 | 17.6 | N/A | ||
Turnout | 11,020 | 73.9 | -3.8 | ||
Registered electors | 14,918 | ||||
Conservative gain from Liberal | Swing | +13.8 | |||
Party | Candidate | Votes | % | ±% | |
---|---|---|---|---|---|
Conservative | Brooke Robinson | 6,668 | 54.3 | −4.5 | |
Liberal | Howard Spensley | 5,619 | 45.7 | +4.5 | |
Majority | 1,049 | 8.6 | −9.0 | ||
Turnout | 12,287 | 80.3 | +6.4 | ||
Registered electors | 15,303 | ||||
Conservative hold | Swing | −4.5 | |||
Party | Candidate | Votes | % | ±% | |
---|---|---|---|---|---|
Conservative | Brooke Robinson | 6,536 | 53.0 | -1.3 | |
Liberal | Charles James Fleming | 5,795 | 47.0 | +1.3 | |
Majority | 741 | 6.0 | -2.6 | ||
Turnout | 12,331 | 83.1 | +2.8 | ||
Registered electors | 14,831 | ||||
Conservative hold | Swing | -1.3 | |||
Party | Candidate | Votes | % | ±% | |
---|---|---|---|---|---|
Conservative | Brooke Robinson | 6,461 | 52.4 | −0.6 | |
Lib-Lab | William Belcher | 5,876 | 47.6 | +0.6 | |
Majority | 585 | 4.8 | −1.2 | ||
Turnout | 12,337 | 77.8 | −5.3 | ||
Registered electors | 15,859 | ||||
Conservative hold | Swing | −0.6 | |||
Party | Candidate | Votes | % | ±% | |
---|---|---|---|---|---|
Liberal | Arthur George Hooper | 8,296 | 52.4 | +4.8 | |
Conservative | Gilbert Claughton | 7,542 | 47.6 | -4.8 | |
Majority | 754 | 4.8 | N/A | ||
Turnout | 15,838 | 90.2 | +12.4 | ||
Registered electors | 17,564 | ||||
Liberal gain from Conservative | Swing | +4.8 | |||
Party | Candidate | Votes | % | ±% | |
---|---|---|---|---|---|
Liberal | Arthur George Hooper | 8,342 | 50.6 | -1.8 | |
Conservative | Arthur Griffith-Boscawen | 8,155 | 49.4 | +1.8 | |
Majority | 187 | 1.2 | -3.6 | ||
Turnout | 16,497 | 94.4 | +4.2 | ||
Liberal hold | Swing | ||||
Party | Candidate | Votes | % | ±% | |
---|---|---|---|---|---|
Conservative | Arthur Griffith-Boscawen | 8,260 | 51.1 | +1.7 | |
Liberal | Arthur George Hooper | 7,900 | 48.9 | -1.7 | |
Majority | 360 | 2.2 | N/A | ||
Turnout | 16,160 | 92.4 | -2.0 | ||
Conservative gain from Liberal | Swing | +1.7 | |||
General Election 1914–15:
Another General Election was required to take place before the end of 1915. The political parties had been making preparations for an election to take place and by July 1914, the following candidates had been selected;
Party | Candidate | Votes | % | ±% | |
---|---|---|---|---|---|
C | Unionist | Arthur Griffith-Boscawen | 9,126 | 60.2 | +9.1 |
Labour | William Bridgland Steer | 6,046 | 39.8 | New | |
Majority | 3,080 | 20.4 | +18.2 | ||
Turnout | 15,174 | 60.4 | −32.0 | ||
Registered electors | 25,103 | ||||
Unionist hold | Swing | +9.1 | |||
Cindicates candidate endorsed by the coalition government. |
Party | Candidate | Votes | % | ±% | |
---|---|---|---|---|---|
Labour | James Wilson | 10,244 | 50.7 | +10.9 | |
C | Unionist | Arthur Griffith-Boscawen | 9,968 | 49.3 | −10.9 |
Majority | 276 | 1.4 | N/A | ||
Turnout | 20,212 | 79.9 | +19.5 | ||
Registered electors | 25,305 | ||||
Labour gain from Unionist | Swing | +10.9 | |||
Cindicates candidate endorsed by the coalition government. |
Party | Candidate | Votes | % | ±% | |
---|---|---|---|---|---|
Unionist | Cyril Lloyd | 12,876 | 60.2 | 0.0 | |
Labour | James Wilson | 8,522 | 39.8 | 0.0 | |
Majority | 4,354 | 20.4 | 0.0 | ||
Turnout | 21,398 | 82.5 | +22.1 | ||
Registered electors | 25,923 | ||||
Unionist hold | Swing | 0.0 | |||
Party | Candidate | Votes | % | ±% | |
---|---|---|---|---|---|
Unionist | Cyril Lloyd | 10,227 | 49.4 | −10.8 | |
Liberal | Francis James Ballard | 8,510 | 41.1 | New | |
Labour | Richard Fowler Smith | 1,958 | 9.5 | −30.3 | |
Majority | 1,717 | 8.3 | −12.1 | ||
Turnout | 20,696 | 78.9 | −3.6 | ||
Registered electors | 26,257 | ||||
Unionist hold | Swing | +9.8 | |||
Party | Candidate | Votes | % | ±% | |
---|---|---|---|---|---|
Unionist | Cyril Lloyd | 11,199 | 52.1 | +2.7 | |
Labour | Oliver Baldwin | 10,314 | 47.9 | +38.4 | |
Majority | 885 | 4.2 | −4.1 | ||
Turnout | 21,513 | 80.2 | +1.3 | ||
Registered electors | 26,826 | ||||
Unionist hold | Swing | −17.9 | |||
Party | Candidate | Votes | % | ±% | |
---|---|---|---|---|---|
Labour | Oliver Baldwin | 13,551 | 47.6 | −0.3 | |
Unionist | Cyril Lloyd | 10,508 | 36.9 | −15.2 | |
Liberal | Thomas Illingworth Clough | 4,399 | 15.5 | New | |
Majority | 3,043 | 10.7 | N/A | ||
Turnout | 28,458 | 81.6 | +1.4 | ||
Registered electors | 34,883 | ||||
Labour gain from Unionist | Swing | +7.6 | |||
Party | Candidate | Votes | % | ±% | |
---|---|---|---|---|---|
Conservative | Dudley Joel | 16,009 | 56.94 | ||
Labour | W Hodgkiss | 12,105 | 43.06 | ||
Majority | 3,904 | 13.88 | N/A | ||
Turnout | 28,114 | 80.75 | |||
Conservative gain from Labour | Swing | ||||
Party | Candidate | Votes | % | ±% | |
---|---|---|---|---|---|
Conservative | Dudley Joel | 13,958 | 54.81 | ||
Labour | William Wedgwood Benn | 11,509 | 45.19 | ||
Majority | 2,449 | 9.62 | |||
Turnout | 25,467 | 75.29 | |||
Conservative hold | Swing | ||||
General Election 1939–40
Another General Election was required to take place before the end of 1940. The political parties had been making preparations for an election to take place and by the Autumn of 1939, the following candidates had been selected;
Party | Candidate | Votes | % | ±% | |
---|---|---|---|---|---|
Conservative | Cyril Lloyd | 6,234 | 56.1 | +1.3 | |
Independent | Noel Pemberton Billing | 4,869 | 43.9 | New | |
Majority | 1,365 | 12.2 | +2.6 | ||
Turnout | 11,103 | 34.7 | -40.6 | ||
Conservative hold | Swing | N/A | |||
Party | Candidate | Votes | % | ±% | |
---|---|---|---|---|---|
Labour | George Wigg | 15,439 | 62.77 | ||
Conservative | Tatton Brinton | 9,156 | 37.23 | ||
Majority | 6,283 | 25.54 | N/A | ||
Turnout | 24,595 | 73.81 | |||
Labour gain from Conservative | Swing | ||||
Party | Candidate | Votes | % | ±% | |
---|---|---|---|---|---|
Labour | George Wigg | 32,856 | 54.62 | ||
Conservative | Roy Farran | 19,825 | 32.96 | ||
Liberal | Bertram Samuel White | 7,470 | 12.42 | New | |
Majority | 13,031 | 21.66 | |||
Turnout | 60,151 | 86.83 | |||
Labour hold | Swing | ||||
Party | Candidate | Votes | % | ±% | |
---|---|---|---|---|---|
Labour | George Wigg | 34,376 | 58.36 | ||
Conservative | Harold Soref | 24,525 | 41.64 | ||
Majority | 9,851 | 16.72 | |||
Turnout | 58,901 | 83.65 | |||
Labour hold | Swing | ||||
Party | Candidate | Votes | % | ±% | |
---|---|---|---|---|---|
Labour | George Wigg | 31,384 | 54.87 | ||
Conservative | Sir Thomas Douglas Wilson, 4th Baronet | 20,333 | 35.55 | ||
Liberal | Wallace Lawler | 5,479 | 9.58 | New | |
Majority | 11,051 | 19.32 | |||
Turnout | 57,196 | 79.83 | |||
Labour hold | Swing | ||||
Party | Candidate | Votes | % | ±% | |
---|---|---|---|---|---|
Labour | George Wigg | 31,826 | 54.94 | ||
Conservative | Frank E. Spiller | 26,101 | 45.06 | ||
Majority | 5,725 | 9.88 | |||
Turnout | 57,927 | 79.54 | |||
Labour hold | Swing | ||||
Party | Candidate | Votes | % | ±% | |
---|---|---|---|---|---|
Labour | George Wigg | 30,250 | 53.20 | ||
Conservative | David Howell | 19,980 | 35.02 | ||
Liberal | Robert CS Fowler | 6,829 | 11.97 | New | |
Majority | 10,270 | 18.18 | |||
Turnout | 56,879 | 76.53 | |||
Labour hold | Swing | ||||
Party | Candidate | Votes | % | ±% | |
---|---|---|---|---|---|
Labour | George Wigg | 32,693 | 59.1 | +5.9 | |
Conservative | Donald Williams | 22,671 | 40.9 | +5.9 | |
Majority | 10,022 | 18.2 | 0.0 | ||
Turnout | 55,364 | 73.9 | -2.6 | ||
Labour hold | Swing | ||||
Party | Candidate | Votes | % | ±% | |
---|---|---|---|---|---|
Conservative | Donald Williams | 28,016 | 58.1 | +17.2 | |
Labour | John Gilbert | 16,360 | 34.0 | -25.1 | |
Liberal | Derek Bird | 3,809 | 7.9 | New | |
Majority | 11,656 | 24.1 | N/A | ||
Turnout | 48,185 | 63.5 | -10.4 | ||
Conservative gain from Labour | Swing | +21.2 | |||
Party | Candidate | Votes | % | ±% | |
---|---|---|---|---|---|
Labour | John Gilbert | 29,499 | 50.29 | ||
Conservative | Donald Williams | 29,163 | 49.71 | ||
Majority | 336 | 0.58 | |||
Turnout | 58,662 | 71.92 | |||
Labour hold | Swing | ||||
Party | Candidate | Votes | % | ±% | |
---|---|---|---|---|---|
Liberal Democrats | Ian Flynn [28] | ||||
Conservative | Marco Longhi [29] | ||||
Reform UK | Andrew Southall [30] | ||||
Majority | |||||
Turnout |
Lewes is a constituency in East Sussex represented in the House of Commons of the UK Parliament since 2015 by Maria Caulfield, a Conservative.
Blackburn is a constituency in Lancashire, England, which has been represented in the House of Commons of the UK Parliament since 2015 by Kate Hollern of the Labour Party. From 1979 to 2015, it was represented by Jack Straw who served under the Labour leaders of Neil Kinnock and John Smith and the Labour governments of Tony Blair and Gordon Brown.
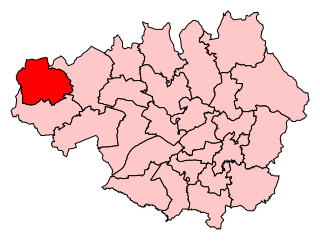
Wigan is a constituency in Greater Manchester, represented in the House of Commons of the UK Parliament since 2010 by Lisa Nandy of the Labour Party, who currently serves as the Shadow Cabinet Minister for International Development.
Dudley North is a constituency represented in the House of Commons of the UK Parliament since 2019 by Marco Longhi, of the Conservative Party.
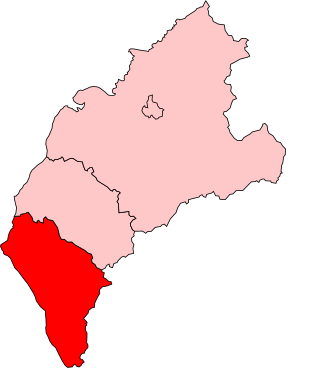
Dudley South is a constituency represented in the House of Commons of the UK Parliament since 2015 by Mike Wood of the Conservative Party.
Ayr Burghs was a district of burghs constituency of the House of Commons of the Parliament of Great Britain from 1708 to 1800 and of the House of Commons of the Parliament of the United Kingdom from 1801 to 1950. It elected one Member of Parliament (MP), using the first-past-the-post voting system.
Warrington was a parliamentary constituency in the United Kingdom. From 1832 to 1983 it returned one Member of Parliament (MP) to the House of Commons of the Parliament of the United Kingdom.
Shrewsbury was a parliamentary constituency in England, centred on the town of Shrewsbury in Shropshire.
Tiverton was a constituency located in Tiverton in east Devon, formerly represented in the House of Commons of the Parliament of the United Kingdom. Enfranchised as a parliamentary borough in 1615 and first represented in 1621, it elected two Members of Parliament (MPs) by the first past the post system of election until 1885. The name was then transferred to a county constituency electing one MP.
Frome was a constituency centred on the town of Frome in Somerset. It returned one Member of Parliament (MP) to the House of Commons of the Parliament of the United Kingdom from 1832, until it was abolished for the 1950 general election. Between 1832 and 1885, it was a parliamentary borough; after 1885 it was a county constituency, a division of Somerset.
Whitehaven was a constituency centred on the town of Whitehaven in Cumberland, which returned one Member of Parliament (MP) to the House of Commons of the Parliament of the United Kingdom.
Hythe was a constituency centred on the town of Hythe in Kent. It returned two Members of Parliament to the House of Commons until 1832, when its representation was reduced to one member. The constituency was abolished for the 1950 general election, and replaced with the new Folkestone and Hythe constituency.
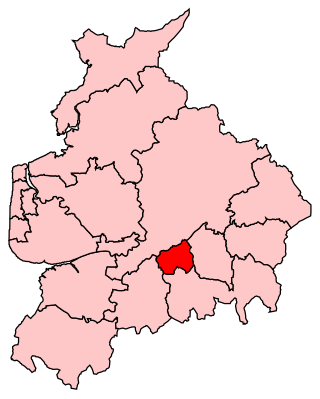
Clitheroe was a parliamentary constituency in Lancashire.
Cardiff was a parliamentary constituency centred on the town of Cardiff in South Wales which returned one Member of Parliament to the House of Commons from 1542 until it was abolished for the 1918 general election.
Chatham was a parliamentary constituency in Kent which returned one Member of Parliament (MP) to the House of Commons of the Parliament of the United Kingdom. It was created for the 1832 general election, when the borough of Chatham was enfranchised under the Reform Act 1832.
Dudley West was a parliamentary constituency, centred on the town of Dudley in the West Midlands. It existed from 1974 to 1997, returning one Member of Parliament (MP) to the House of Commons of the Parliament of the United Kingdom by the first past the post system.
Bilston was a parliamentary constituency centred on the town of Bilston in what is now the southeast of the city of Wolverhampton in the West Midlands. It returned one Member of Parliament (MP) to the House of Commons of the Parliament of the United Kingdom.
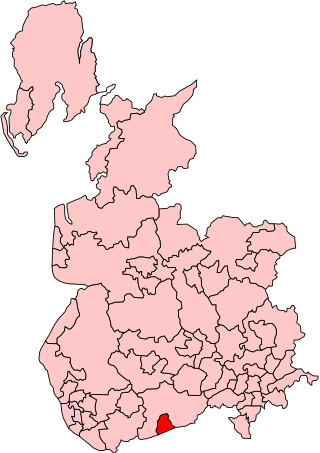
Bury was a borough constituency centred on the town of Bury in Lancashire. It returned one Member of Parliament (MP) to the House of Commons of the Parliament of the United Kingdom.
East Worcestershire was a county constituency in the county of Worcestershire, represented in the House of Commons of the Parliament of the United Kingdom.