Caerfyrddin (Carmarthen) | |
---|---|
Former County constituency for the House of Commons | |
Preserved county | Dyfed |
Major settlements | Carmarthen, Ammanford, Llandeilo |
1918–1997 | |
Seats | One |
Replaced by | Carmarthen East & Dinefwr and Carmarthen West & South Pembrokeshire |
1542–1918 | |
Seats | One |
Type of constituency | Borough constituency |
2024–present | |
Created from | Carmarthen East & Dinefwr and Carmarthen West & South Pembrokeshire |
Caerfyrddin is a constituency of the House of Commons in the UK Parliament, to be first contested at the 2024 United Kingdom general election, following the 2023 Periodic Review of Westminster constituencies.
It previously existed between 1542 and 1997 under the English version of the name, Carmarthen. It was named Carmarthen Boroughs from 1832 to 1918; between 1997 and 2024 it was divided between Carmarthen East and Dinefwr constituency and Carmarthen West and South Pembrokeshire.
Because the seat contained mining areas in the valley of the River Gwendraeth (until the 1980s), much countryside and a high proportion of Welsh speakers, it was fertile territory for the Labour Party, the Conservatives and Plaid Cymru alike. Although the Conservatives never won the seat, they came within 1200 votes of doing so in 1983.
Carmarthen is notable as the first constituency to elect a Plaid Cymru MP, Gwynfor Evans, at a 1966 by-election. Evans was later involved in one of the closest General Election results ever in February 1974, when he lost to the Labour candidate by only three votes. [1] [2] The constituency also shot to fame in the following election in October 1974 as the only seat in the country to see its turnout rise on that of February 1974.
Until 1832, it was a borough constituency consisting of the town of Carmarthen. Between 1832 and 1918 it was a district of boroughs constituency, consisting of Carmarthen itself and Llanelli, and was sometimes called "The Carmarthen Boroughs".
In 1918, the borough was abolished, but the name was transferred to one of the divisions of the county of Carmarthenshire. The constituency was made up of the whole of the county of Carmarthenshire except for the urban area around Llanelli. Notable towns were Carmarthen itself, Ammanford and Llandeilo.
In 1997, the Boundary Commission for Wales recommended an extra seat for Dyfed. [3] This led to the seat being split two to one between Carmarthen East & Dinefwr and Carmarthen West & South Pembrokeshire. [4]
The constituency is be re-established as Caerfyrddin as part of the 2023 Periodic Review of Westminster constituencies and under the June 2023 final proposals of the Boundary Commission for Wales for the 2024 United Kingdom general election. [5]
Parliament | Member |
---|---|
1542 | Gruffydd Williams [6] |
1545 | Gruffydd Williams [6] |
1547 | Thomas Phaer [6] |
1553 (Mar) | William Parry [6] |
1553 (Oct) | Gruffydd Hygons [6] |
1554 (Apr) | William Aubrey [6] [7] |
1554 (Nov) | John Parry [6] |
1555 | William Wightman [6] |
1558 | John Vaughan [6] |
1559 | John Parry [8] |
1563 | John Morgan [8] |
1571 | ?John Vaughan [8] |
1572 | Thomas Wigmore [8] |
1584 | John Puckering, sat for Bedford replaced 1584 by Edward Donne Lee [8] |
1586 | Edward Donne Lee [8] |
1588 | Gelly Meyrick [8] |
1593 | Sir Thomas Baskerville [8] |
1597 | Henry Vaughan [8] |
1601 | Walter Rice [8] |
1604–1611 | Sir Walter Rice |
1614 | William Thomas |
1621 | Henry Vaughan |
1624 | Henry Vaughan |
1626 | Henry Vaughan |
1628 | Henry Vaughan |
1629–1640 | No Parliaments summoned |
Election | Member [9] | Party | |
---|---|---|---|
1640 (Apr) | Francis Lloyd | Royalist | |
1640 (Nov) | Francis Lloyd | Royalist | |
February 1644 | Lloyd disabled from sitting – seat vacant | ||
1646 | William Davies | ||
December 1648 | Davies not recorded as sitting after Pride's Purge | ||
1653 | Carmarthen was not represented in the Barebones Parliament or the First or Second Parliaments of the Protectorate | ||
January 1659 | David Morgan | ||
May 1659 | Not represented in the restored Rump | ||
April 1660 | Arthur Annesley | ||
1661 | Hon. John Vaughan | ||
1679 | Altham Vaughan | ||
1685 | Richard Vaughan | ||
1725 | James Phillips | ||
1727 | Arthur Bevan | ||
1741 | Sir John Philipps | ||
1747 | Thomas Mathews | ||
1751 | Griffith Philipps | ||
1761 | The Earl Verney | ||
1768 | Griffith Philipps | ||
1774 | John Adams | ||
1780 | George Philipps | ||
1784 | John George Philipps | ||
May 1796 | Magens Dorrien Magens [10] | ||
November 1796 | John George Philipps | ||
1803 | Sir William Paxton | ||
1806 | Vice-Admiral George Campbell | Whig [11] | |
1813 | John Campbell | Whig [11] | |
1821 | John Jones | Tory [11] |
Party | Candidate | Votes | % | ||
---|---|---|---|---|---|
Tory | John Jones | Unopposed | |||
Tory hold | |||||
At the 1830 general election, rioting broke out during polling, at which point John Jones and his Whig rival, John George Philipps, had secured three votes apiece. The vote was abandoned and a by-election was called four months later in December.
Party | Candidate | Votes | % | ||
---|---|---|---|---|---|
Tory | John Jones | 274 | 57.4 | ||
Whig | John George Philipps | 203 | 42.6 | ||
Majority | 71 | 14.8 | |||
Turnout | 477 | c. 66.0 | |||
Registered electors | c. 723 | ||||
Tory hold | |||||
Party | Candidate | Votes | % | ±% | |
---|---|---|---|---|---|
Whig | William Henry Yelverton | 302 | 50.6 | +8.0 | |
Tory | John Jones | 295 | 49.4 | −8.0 | |
Majority | 7 | 1.2 | N/A | ||
Turnout | 597 | 87.3 | c. +21.3 | ||
Registered electors | 684 | ||||
Whig gain from Tory | Swing | +8.0 | |||
Party | Candidate | Votes | % | ±% | |
---|---|---|---|---|---|
Conservative | David Lewis | 304 | 53.1 | +3.7 | |
Whig | William Henry Yelverton | 268 | 46.9 | −3.7 | |
Majority | 36 | 6.2 | N/A | ||
Turnout | 572 | 74.0 | −13.3 | ||
Registered electors | 773 | ||||
Conservative gain from Whig | Swing | +3.7 | |||
Party | Candidate | Votes | % | ±% | |
---|---|---|---|---|---|
Whig | David Morris | 333 | 53.7 | +6.8 | |
Conservative | David Lewis | 287 | 46.3 | −6.8 | |
Majority | 46 | 7.4 | N/A | ||
Turnout | 620 | 78.9 | +4.9 | ||
Registered electors | 786 | ||||
Whig gain from Conservative | Swing | +6.8 | |||
Party | Candidate | Votes | % | ±% | |
---|---|---|---|---|---|
Whig | David Morris | Unopposed | |||
Registered electors | 938 | ||||
Whig hold | |||||
Party | Candidate | Votes | % | ±% | |
---|---|---|---|---|---|
Whig | David Morris | Unopposed | |||
Registered electors | 991 | ||||
Whig hold | |||||
Party | Candidate | Votes | % | ±% | |
---|---|---|---|---|---|
Whig | David Morris | Unopposed | |||
Registered electors | 849 | ||||
Whig hold | |||||
Party | Candidate | Votes | % | ±% | |
---|---|---|---|---|---|
Whig | David Morris | Unopposed | |||
Registered electors | 799 | ||||
Whig hold | |||||
Party | Candidate | Votes | % | ±% | |
---|---|---|---|---|---|
Liberal | David Morris | Unopposed | |||
Registered electors | 823 | ||||
Liberal hold | |||||
Morris' death caused a by-election.
Party | Candidate | Votes | % | ±% | |
---|---|---|---|---|---|
Liberal | William Morris | Unopposed | |||
Liberal hold | |||||
Party | Candidate | Votes | % | ±% | |
---|---|---|---|---|---|
Liberal | William Morris | Unopposed | |||
Registered electors | 884 | ||||
Liberal hold | |||||
Party | Candidate | Votes | % | ±% | |
---|---|---|---|---|---|
Liberal | John Cowell-Stepney | 1,892 | 76.1 | N/A | |
Conservative | Morgan Dalrymple Treherne [18] | 595 | 23.9 | New | |
Majority | 1,297 | 52.2 | N/A | ||
Turnout | 2,487 | 75.7 | N/A | ||
Registered electors | 3,286 | ||||
Liberal hold | Swing | N/A | |||
Party | Candidate | Votes | % | ±% | |
---|---|---|---|---|---|
Conservative | Charles William Nevill | 1,654 | 52.8 | +28.9 | |
Liberal | Arthur Cowell-Stepney | 1,481 | 47.2 | −28.9 | |
Majority | 173 | 5.6 | N/A | ||
Turnout | 3,135 | 69.8 | −5.9 | ||
Registered electors | 4,494 | ||||
Conservative gain from Liberal | Swing | +28.9 | |||
Nevill resigned, causing a by-election.
Party | Candidate | Votes | % | ±% | |
---|---|---|---|---|---|
Liberal | Arthur Cowell-Stepney | Unopposed | |||
Liberal gain from Conservative |
Cowell-Stepney resigned, causing a by-election.
Party | Candidate | Votes | % | ±% | |
---|---|---|---|---|---|
Liberal | Benjamin Thomas Williams | Unopposed | |||
Liberal hold | |||||
Party | Candidate | Votes | % | ±% | |
---|---|---|---|---|---|
Liberal | Benjamin Thomas Williams | 1,935 | 51.5 | +4.3 | |
Independent Liberal | John Jones Jenkins [19] | 1,825 | 48.5 | New | |
Majority | 110 | 3.0 | N/A | ||
Turnout | 3,760 | 70.0 | +0.2 | ||
Registered electors | 5,369 | ||||
Liberal gain from Conservative | Swing | N/A | |||
Williams resigned after being appointed a County Court judge, causing a by-election.
Party | Candidate | Votes | % | ±% | |
---|---|---|---|---|---|
Liberal | John Jones Jenkins | Unopposed | |||
Liberal hold | |||||
Party | Candidate | Votes | % | ±% | |
---|---|---|---|---|---|
Liberal | John Jones Jenkins | 2,884 | 69.2 | +17.7 | |
Conservative | John Simmons Tregoning | 1,281 | 30.8 | New | |
Majority | 1,603 | 38.4 | +35.4 | ||
Turnout | 4,165 | 77.1 | +7.1 | ||
Registered electors | 5,399 | ||||
Liberal hold | Swing | N/A | |||
Party | Candidate | Votes | % | ±% | |
---|---|---|---|---|---|
Liberal | Arthur Cowell-Stepney | 2,120 | 52.8 | −16.4 | |
Liberal Unionist | John Jones Jenkins | 1,898 | 47.2 | +16.4 | |
Majority | 222 | 5.6 | −32.8 | ||
Turnout | 4,018 | 74.4 | −2.7 | ||
Registered electors | 5,399 | ||||
Liberal hold | Swing | −16.4 | |||
Party | Candidate | Votes | % | ±% | |
---|---|---|---|---|---|
Liberal | Evan Rowland Jones | 2,412 | 52.4 | −0.4 | |
Liberal Unionist | John Jones Jenkins | 2,187 | 47.6 | +0.4 | |
Majority | 225 | 4.8 | −0.8 | ||
Turnout | 4,599 | 87.0 | +12.6 | ||
Registered electors | 5,289 | ||||
Liberal hold | Swing | −0.4 | |||
Party | Candidate | Votes | % | ±% | |
---|---|---|---|---|---|
Liberal Unionist | John Jones Jenkins | 2,443 | 50.5 | +2.9 | |
Liberal | Evan Rowland Jones | 2,391 | 49.5 | −2.9 | |
Majority | 52 | 1.0 | N/A | ||
Turnout | 4,834 | 90.0 | +3.0 | ||
Registered electors | 5,370 | ||||
Liberal Unionist gain from Liberal | Swing | +2.9 | |||
Party | Candidate | Votes | % | ±% | |
---|---|---|---|---|---|
Liberal | Alfred Davies | 2,837 | 58.1 | +8.6 | |
Liberal Unionist | John Jones Jenkins | 2,047 | 41.9 | −8.6 | |
Majority | 790 | 16.2 | N/A | ||
Turnout | 4,884 | 87.9 | −2.1 | ||
Registered electors | 5,557 | ||||
Liberal gain from Liberal Unionist | Swing | +8.6 | |||
Party | Candidate | Votes | % | ±% | |
---|---|---|---|---|---|
Liberal | W. Llewelyn Williams | 3,902 | 68.3 | +10.2 | |
Conservative | Vere Ponsonby | 1,808 | 31.7 | −10.2 | |
Majority | 2,094 | 36.6 | +20.4 | ||
Turnout | 5,710 | 91.2 | +3.3 | ||
Registered electors | 6,258 | ||||
Liberal hold | Swing | +10.2 | |||
Party | Candidate | Votes | % | ±% | |
---|---|---|---|---|---|
Liberal | W. Llewelyn Williams | 4,197 | 68.1 | −0.2 | |
Liberal Unionist | Viscount Tiverton | 1,965 | 31.9 | +0.2 | |
Majority | 2,232 | 36.2 | −0.4 | ||
Turnout | 6,162 | 91.0 | −0.2 | ||
Registered electors | 6,772 | ||||
Liberal hold | Swing | −0.2 | |||
Party | Candidate | Votes | % | ±% | |
---|---|---|---|---|---|
Liberal | W. Llewelyn Williams | Unopposed | |||
Liberal hold | |||||
Party | Candidate | Votes | % | ±% | |
---|---|---|---|---|---|
Liberal | W. Llewelyn Williams | 3,836 | 58.6 | N/A | |
Conservative | Henry Coulson Bond | 2,555 | 39.1 | New | |
Independent Labour | Frank G Vivian | 149 | 2.3 | New | |
Majority | 1,281 | 19.5 | N/A | ||
Turnout | 6,540 | 89.8 | N/A | ||
Liberal hold | Swing | -8.3 | |||
Party | Candidate | Votes | % | ±% | |
---|---|---|---|---|---|
Liberal | W. Llewelyn Williams | Unopposed | |||
Liberal hold | |||||
Party | Candidate | Votes | % | ±% | |
---|---|---|---|---|---|
C | Liberal | John Hinds | Unopposed | ||
Liberal hold | |||||
Cindicates candidate endorsed by the coalition government. |
Party | Candidate | Votes | % | ±% | |
---|---|---|---|---|---|
National Liberal | John Hinds | 12,530 | 41.9 | N/A | |
Unionist | George Coventry | 8,805 | 29.4 | New | |
National Farmers' Union | David Johns | 4,775 | 15.9 | New | |
Liberal | Hubert Llewelyn-Williams | 3,847 | 12.8 | N/A | |
Majority | 3,725 | 12.5 | N/A | ||
Turnout | 29,957 | 82.7 | N/A | ||
Registered electors | 36,213 | ||||
National Liberal gain from Liberal |
Party | Candidate | Votes | % | ±% | |
---|---|---|---|---|---|
Liberal | Ellis Ellis-Griffith | 12,988 | 45.1 | +32.3 | |
Unionist | Alfred Stephens | 8,677 | 30.1 | +0.7 | |
Labour | Rowland Williams | 7,132 | 24.8 | New | |
Majority | 4,311 | 15.0 | N/A | ||
Turnout | 28,797 | 78.3 | −4.4 | ||
Registered electors | 36,779 | ||||
Liberal gain from National Liberal | Swing | N/A | |||
Party | Candidate | Votes | % | ±% | |
---|---|---|---|---|---|
Liberal | Alfred Mond | 12,760 | 44.0 | −1.1 | |
Labour | Edward Teilo Owen | 8,351 | 28.8 | +4.0 | |
Unionist | Alfred Stephens | 7,896 | 27.2 | −2.9 | |
Majority | 4,409 | 15.2 | +0.2 | ||
Turnout | 29,007 | 78.9 | +0.6 | ||
Registered electors | 36,779 | ||||
Liberal hold | Swing | −2.6 | |||
Party | Candidate | Votes | % | ±% | |
---|---|---|---|---|---|
Liberal | Alfred Mond | 17,281 | 68.5 | +23.4 | |
Labour | Edward Teilo Owen | 7,953 | 31.5 | +6.7 | |
Majority | 9,328 | 37.0 | +22.0 | ||
Turnout | 25,234 | 67.9 | −10.4 | ||
Registered electors | 37,155 | ||||
Liberal hold | Swing | +8.4 | |||
Party | Candidate | Votes | % | ±% | |
---|---|---|---|---|---|
Liberal | William Nathaniel Jones | 10,201 | 35.5 | −33.0 | |
Labour | Daniel Hopkin | 10,154 | 35.4 | +3.9 | |
Unionist | Courtenay Mansel | 8,361 | 29.1 | New | |
Majority | 47 | 0.1 | −36.9 | ||
Turnout | 28,716 | 76.6 | +8.7 | ||
Registered electors | 37,482 | ||||
Liberal hold | Swing | −18.5 | |||
Party | Candidate | Votes | % | ±% | |
---|---|---|---|---|---|
Labour | Daniel Hopkin | 15,130 | 38.2 | +6.7 | |
Liberal | William Nathaniel Jones | 14,477 | 36.6 | −31.9 | |
Unionist | John Coventry | 9,961 | 25.2 | N/A | |
Majority | 653 | 1.6 | N/A | ||
Turnout | 39,568 | 85.8 | +17.9 | ||
Registered electors | 46,110 | ||||
Labour gain from Liberal | Swing | +19.3 | |||
Party | Candidate | Votes | % | ±% | |
---|---|---|---|---|---|
Liberal | Richard Evans | 15,532 | 39.5 | +2.9 | |
Labour | Daniel Hopkin | 14,318 | 36.5 | -1.7 | |
Conservative | Delme William Campbell Davies-Evans | 9,434 | 24.0 | -1.2 | |
Majority | 1,214 | 3.0 | N/A | ||
Turnout | 39,284 | 84.5 | -1.3 | ||
Liberal gain from Labour | Swing | ||||
Party | Candidate | Votes | % | ±% | |
---|---|---|---|---|---|
Labour | Daniel Hopkin | 18,146 | 47.5 | +11.0 | |
Liberal | Richard Evans | 12,911 | 33.8 | -5.7 | |
Conservative | Edward Kellett | 7,177 | 18.8 | -5.2 | |
Majority | 5,235 | 13.7 | N/A | ||
Turnout | 38,234 | 79.3 | -5.2 | ||
Labour gain from Liberal | Swing | ||||
1941 Carmarthen by-election Labour: Moelwyn Hughes elected unopposed.
Party | Candidate | Votes | % | ±% | |
---|---|---|---|---|---|
Liberal | Rhys Hopkin Morris | 19,783 | 51.7 | +17.9 | |
Labour | Moelwyn Hughes | 18,504 | 48.3 | +0.8 | |
Majority | 1,279 | 3.4 | N/A | ||
Turnout | 38,286 | 76.1 | -3.2 | ||
Liberal gain from Labour | Swing | ||||
Party | Candidate | Votes | % | ±% | |
---|---|---|---|---|---|
Liberal | Rhys Hopkin Morris | 24,472 | 50.2 | -1.48 | |
Labour | Lynn Ungoed-Thomas | 24,285 | 49.8 | +1.48 | |
Majority | 187 | 0.4 | -2.96 | ||
Turnout | 48,759 | 83.4 | +7.3 | ||
Liberal hold | Swing | ||||
Party | Candidate | Votes | % | ±% | |
---|---|---|---|---|---|
Liberal | Rhys Hopkin Morris | 25,632 | 50.46 | +0.27 | |
Labour | David Owen | 25,165 | 49.54 | -0.65 | |
Majority | 467 | 0.92 | +0.54 | ||
Turnout | 5,0795 | 86.52 | +3.09 | ||
Liberal hold | Swing | ||||
Party | Candidate | Votes | % | ±% | |
---|---|---|---|---|---|
Liberal | Rhys Hopkin Morris | 24,410 | 49.49 | -0.97 | |
Labour | Jack Evans | 21,077 | 42.73 | -6.81 | |
Plaid Cymru | Jennie Eirian Davies | 3,835 | 7.78 | New | |
Majority | 3,333 | 6.76 | +5.84 | ||
Turnout | 49,320 | 85.10 | -1.42 | ||
Liberal hold | Swing | ||||
Party | Candidate | Votes | % | ±% | |
---|---|---|---|---|---|
Labour | Megan Lloyd George | 23,679 | 47.33 | +4.60 | |
Liberal | John Morgan Davies | 20,610 | 41.20 | -8.29 | |
Plaid Cymru | Jennie Eirian Davies | 5,741 | 11.48 | +3.70 | |
Majority | 3,069 | 6.13 | N/A | ||
Turnout | 43,726 | 87.4 | +2.3 | ||
Labour gain from Liberal | Swing | +6.5 | |||
Party | Candidate | Votes | % | ±% | |
---|---|---|---|---|---|
Labour | Megan Lloyd George | 23,399 | 47.89 | +5.16 | |
Liberal | Alun Talfan Davies | 16,766 | 34.32 | -15.17 | |
Conservative | JB Evans | 6,147 | 12.58 | New | |
Plaid Cymru | Hywel Heulyn Roberts | 2,545 | 5.21 | -2.57 | |
Majority | 6,633 | 13.57 | +6.81 | ||
Turnout | 48,855 | 85.42 | +0.32 | ||
Labour hold | Swing | ||||
Party | Candidate | Votes | % | ±% | |
---|---|---|---|---|---|
Labour | Megan Lloyd George | 21,424 | 45.46 | -2.4 | |
Liberal | Alun Talfan Davies | 15,210 | 32.28 | -2.0 | |
Plaid Cymru | Gwynfor Evans | 5,495 | 11.66 | +6.5 | |
Conservative | H.E. Protheroe-Beynon | 4,996 | 10.60 | -1.98 | |
Majority | 6,214 | 13.19 | -0.39 | ||
Turnout | 47,122 | 84.4 | -1.0 | ||
Labour hold | Swing | ||||
Party | Candidate | Votes | % | ±% | |
---|---|---|---|---|---|
Labour | Megan Lloyd George | 21,221 | 46.2 | +0.7 | |
Liberal | D Hywel Davies | 11,988 | 26.1 | −6.2 | |
Plaid Cymru | Gwynfor Evans | 7,416 | 16.1 | +4.4 | |
Conservative | Simon James Day | 5,338 | 11.6 | +1.0 | |
Majority | 9,233 | 20.1 | +6.9 | ||
Turnout | 45,960 | 82.6 | -1.8 | ||
Labour hold | Swing | ||||
Party | Candidate | Votes | % | ±% | |
---|---|---|---|---|---|
Plaid Cymru | Gwynfor Evans | 16,179 | 38.98 | +22.84 | |
Labour | Gwilym Prys-Davies | 13,743 | 33.11 | -13.06 | |
Liberal | D Hywel Davies | 8,650 | 20.84 | -5.25 | |
Conservative | Simon James Day | 2,934 | 7.09 | -4.52 | |
Majority | 2,436 | 5.87 | N/A | ||
Turnout | 41,506 | 74.9 | -7.7 | ||
Plaid Cymru gain from Labour | Swing | +12.0 | |||
Party | Candidate | Votes | % | ±% | |
---|---|---|---|---|---|
Labour | Gwynoro Jones | 18,719 | 38.0 | −8.2 | |
Plaid Cymru | Gwynfor Evans | 14,812 | 30.1 | +14.0 | |
Liberal | Huw Thomas | 10,707 | 21.7 | −4.4 | |
Conservative | Lloyd Harvard Davies | 4,975 | 10.1 | −1.5 | |
Majority | 3,907 | 7.9 | N/A | ||
Turnout | 49,214 | 83.5 | +1.0 | ||
Labour gain from Plaid Cymru | Swing | ||||
Party | Candidate | Votes | % | ±% | |
---|---|---|---|---|---|
Labour | Gwynoro Jones | 17,165 | 34.3 | −3.7 | |
Plaid Cymru | Gwynfor Evans | 17,162 | 34.3 | +4.2 | |
Liberal | David Roderick Owen-Jones | 9,698 | 19.4 | −2.3 | |
Conservative | Bill Newton Dunn | 6,037 | 12.1 | +2.0 | |
Majority | 3 | 0.01 | -7.9 | ||
Turnout | 50,062 | 83.5 | 0.0 | ||
Labour hold | Swing | ||||
Party | Candidate | Votes | % | ±% | |
---|---|---|---|---|---|
Plaid Cymru | Gwynfor Evans | 23,325 | 45.1 | +11.8 | |
Labour | Gwynoro Jones | 19,685 | 38.1 | +3.8 | |
Liberal | David Roderick Owen-Jones | 5,393 | 10.4 | -9.0 | |
Conservative | Robert Hayward | 2,962 | 5.7 | -6.4 | |
British Candidate | Edward .B Jones | 342 | 0.7 | New | |
Majority | 3,640 | 7.0 | N/A | ||
Turnout | 51,704 | 85.6 | +2.1 | ||
Plaid Cymru gain from Labour | Swing | ||||
Party | Candidate | Votes | % | ±% | |
---|---|---|---|---|---|
Labour | Roger Thomas | 18,667 | 35.9 | -2.2 | |
Plaid Cymru | Gwynfor Evans | 16,689 | 32.0 | -13.1 | |
Conservative | Nigel M. Thomas | 12,272 | 23.6 | +17.9 | |
Liberal | Clem Thomas | 4,186 | 8.0 | -2.4 | |
National Front | Charlie Grice | 149 | 0.3 | New | |
New Britain | EJ Clarke | 126 | 0.2 | New | |
Majority | 1,978 | 3.9 | N/A | ||
Turnout | 52,086 | 84.4 | -1.2 | ||
Labour gain from Plaid Cymru | Swing | ||||
Party | Candidate | Votes | % | ±% | |
---|---|---|---|---|---|
Labour | Roger Thomas | 16,459 | 31.6 | -4.3 | |
Conservative | Nigel M. Thomas | 15,305 | 29.4 | +5.8 | |
Plaid Cymru | Gwynfor Evans | 14,099 | 27.1 | -4.9 | |
Alliance | Joan Colin | 5,737 | 11.0 | +3.0 | |
Ecology | Brian Kingzett | 374 | 0.7 | New | |
BNP | Charlie Grice | 154 | 0.3 | New | |
Majority | 1,154 | 2.2 | -1.7 | ||
Turnout | 52,126 | 82.1 | -1.3 | ||
Labour hold | Swing | ||||
Party | Candidate | Votes | % | ±% | |
---|---|---|---|---|---|
Labour | Alan Williams | 19,128 | 35.4 | +3.8 | |
Conservative | Rod Richards | 14,811 | 27.4 | -2.0 | |
Plaid Cymru | Hywel Teifi Edwards | 12,457 | 23.0 | -4.1 | |
SDP | Gwynoro Jones | 7,203 | 13.3 | +2.3 | |
Green | Graham Oubridge | 481 | 0.9 | +0.2 | |
Majority | 4,317 | 8.0 | +5.8 | ||
Turnout | 54,080 | 82.9 | +0.8 | ||
Labour hold | Swing | ||||
Party | Candidate | Votes | % | ±% | |
---|---|---|---|---|---|
Labour | Alan Williams | 20,879 | 36.6 | +1.2 | |
Plaid Cymru | Rhodri Glyn Thomas | 17,957 | 31.5 | +8.5 | |
Conservative | Stephen J. Cavenagh | 12,782 | 22.4 | −5.0 | |
Liberal Democrats | Juliana M.J. Hughes | 5,353 | 9.4 | −3.9 | |
Majority | 2,922 | 5.1 | −2.9 | ||
Turnout | 56,971 | 82.7 | −0.2 | ||
Labour hold | Swing | −3.6 | |||
Party | Candidate | Votes | % | ±% | |
---|---|---|---|---|---|
Plaid Cymru | Ann Davies | ||||
Independent | Jonathan Edwards | ||||
Conservative | Simon Hart | ||||
Reform UK | Bernard Holton | ||||
Labour | Martha O'Neil | ||||
Liberal Democrats | Chris Passmore | ||||
Rejected ballots | |||||
Majority | |||||
Turnout | |||||
Swing | |||||
Ilford North is a constituency created in 1945 and represented in the House of Commons of the UK Parliament since 2015 by Wes Streeting of the Labour Party.
Canterbury is a constituency in Kent represented in the House of Commons of the UK Parliament since 2017 by Rosie Duffield of the Labour Party.
Carlisle is a constituency in Cumbria represented in the House of Commons of the UK Parliament since 2010 by John Stevenson of the Conservative Party.
Carmarthen East and Dinefwr is a constituency of the House of Commons of the Parliament of the United Kingdom represented since 2010 by Jonathan Edwards of Plaid Cymru. It elects one Member of Parliament (MP) by the first past the post system of election. It was created in 1997, mostly from the former seat of Carmarthen.
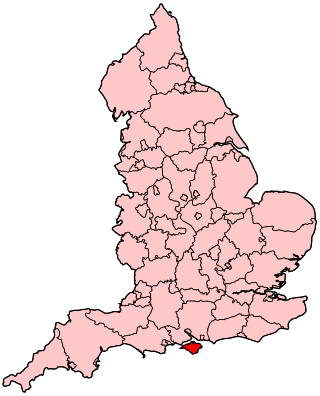
Isle of Wight is a constituency represented in the House of Commons of the UK Parliament since 2017 by Bob Seely, a Conservative.
Aldershot is a constituency in Hampshire represented in the House of Commons of the UK Parliament since 2017 by Leo Docherty, a Conservative.
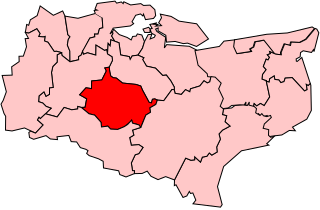
Sevenoaks is a constituency in Kent represented in the House of Commons of the UK Parliament since 2019 by Laura Trott, a Conservative who has served as Chief Secretary to the Treasury since 13 November 2023. The seat was previously held by Michael Fallon, who served as Secretary of State for Defence from 2014 to 2017.
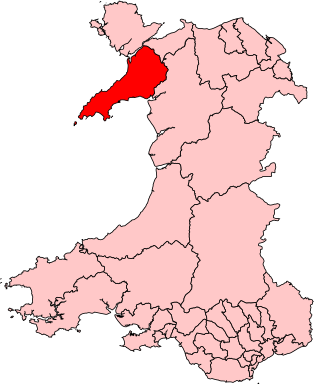
Caernarfon was a parliamentary constituency centred on the town of Caernarfon in Wales. It elected one Member of Parliament (MP).
Llanelli is a constituency of the House of Commons of the Parliament of the United Kingdom. From 1918 to 1970 the official spelling of the constituency name was Llanelly. It elects one Member of Parliament (MP) by the first past the post system of election. Since 2005, it is currently represented by Nia Griffith of the Labour Party.
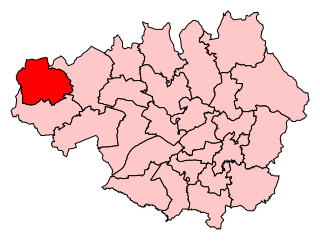
Wigan is a constituency in Greater Manchester, represented in the House of Commons of the UK Parliament since 2010 by Lisa Nandy of the Labour Party, who currently serves as the Shadow Cabinet Minister for International Development.
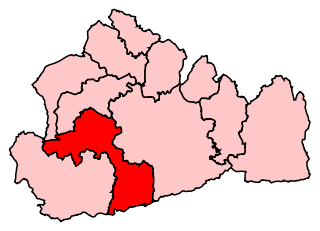
Guildford is a constituency in Surrey represented in the House of Commons of the UK Parliament since 2019 by Angela Richardson, a Conservative.
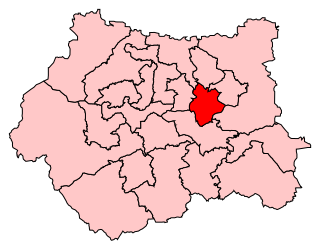
Leeds Central is a constituency represented in the House of Commons of the UK Parliament since 1999 by Hilary Benn of the Labour Party. The constituency first existed from 1885 until it was abolished in 1955. It was recreated in 1983.
Barking is a constituency in Greater London represented in the House of Commons of the UK Parliament. Since its formation in 1945, it has consistently returned a member of the Labour Party as its Member of Parliament (MP). Since 1994, its MP has been Margaret Hodge.
Lewisham East is a parliamentary constituency represented in the House of Commons of the UK Parliament since the by-election on 14 June 2018 by Janet Daby of the Labour Party.
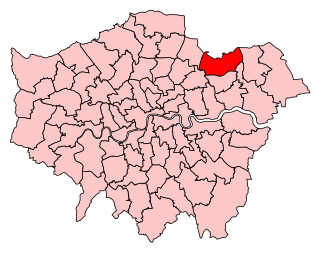
Enfield North is a peripheral Greater London constituency created in 1974 and represented in the House of Commons of the UK Parliament since 2019 by Feryal Clark of the Labour Party.
Oxford was a parliamentary constituency in the United Kingdom, comprising the city of Oxford in the county of Oxfordshire.
Maidstone was a parliamentary constituency represented in the Parliament of England, Great Britain and from 1801 the House of Commons of the Parliament of the United Kingdom.
Shrewsbury was a parliamentary constituency in England, centred on the town of Shrewsbury in Shropshire.
Wood Green was a constituency for the House of Commons of the UK Parliament 1918—1983, centred on the Wood Green area of North London and its earlier broadest form included much of the seat of Enfield Southgate, created in 1950. It returned one Member of Parliament (MP).
Faversham was a parliamentary constituency centred on the town of Faversham in Kent which returned one Member of Parliament (MP) to the House of Commons of the Parliament of the United Kingdom.