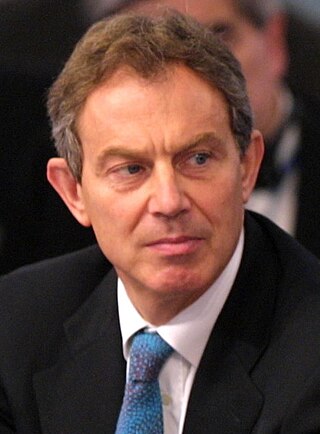
The 2001 United Kingdom general election was held on Thursday 7 June 2001, four years after the previous election on 1 May 1997, to elect 659 members to the House of Commons. The governing Labour Party was re-elected to serve a second term in government with another landslide victory with a 167 majority, returning 412 members of Parliament versus 418 from the 1997 general election, a net loss of six seats, though with a significantly lower turnout than before—59.4%, compared to 71.6% at the previous election. The number of votes Labour received fell by nearly three million. Tony Blair went on to become the only Labour Prime Minister to serve two consecutive full terms in office. As Labour retained almost all of their seats won in the 1997 landslide victory, the media dubbed the 2001 election "the quiet landslide".

The politics of the United Kingdom functions within a constitutional monarchy where executive power is delegated by legislation and social conventions to a unitary parliamentary democracy. From this a hereditary monarch, currently Charles III, serves as head of state while the Prime Minister of the United Kingdom, currently Rishi Sunak since 2022, serves as the elected head of government.

The politics of Scotland operate within the constitution of the United Kingdom, of which Scotland is a country. Scotland is a democracy, being represented in both the Scottish Parliament and the Parliament of the United Kingdom since the Scotland Act 1998. Most executive power is exercised by the Scottish Government, led by the First Minister of Scotland, the head of government in a multi-party system. The judiciary of Scotland, dealing with Scots law, is independent of the legislature and the Scottish Government. Scots law is primarily determined by the Scottish Parliament. The Scottish Government shares some executive powers with the Government of the United Kingdom's Scotland Office, a British government department led by the Secretary of State for Scotland.
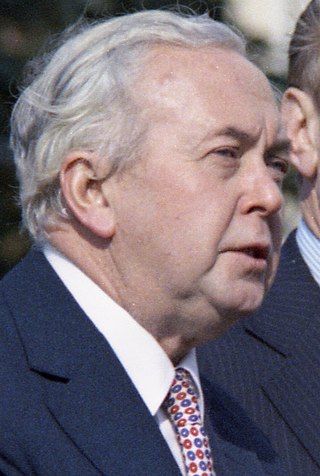
The February 1974 United Kingdom general election was held on Thursday 28 February 1974. The Labour Party, led by Leader of the Opposition and former Prime Minister Harold Wilson, gained 14 seats but was seventeen short of an overall majority. The Conservative Party, led by incumbent Prime Minister Edward Heath, lost 28 seats. That resulted in a hung parliament, the first since 1929. Heath sought a coalition with the Liberals, but the two parties failed to come to an agreement and so Wilson became Prime Minister for a second time, his first with a minority government. Wilson called another early election in September, which was held in October and resulted in a Labour majority. The February election was also the first general election to be held with the United Kingdom as a member state of the European Communities (EC), which was widely known as the "Common Market".
The October 1974 United Kingdom general election took place on Thursday 10 October 1974 to elect 635 members of the British House of Commons. It was the second general election held that year; the first year that two general elections were held in the same year since 1910; and the first time that two general elections were held less than a year apart from each other since the 1923 and 1924 elections, which took place 10 months apart. The election resulted in the Labour Party, led by Prime Minister Harold Wilson, winning a bare majority of three seats. That enabled the remainder of the Labour government to take place, but it saw a gradual loss of its majority.

The 1950 United Kingdom general election was the first ever to be held after a full term of Labour government. The election was held on Thursday 23 February 1950, and was the first held following the abolition of plural voting and university constituencies. The government's 1945 lead over the Conservative Party shrank dramatically, and Labour was returned to power but with an overall majority reduced from 146 to just 5. There was a 2.8% national swing towards the Conservatives, who gained 90 seats. Labour called another general election in 1951, which the Conservative Party won.
The 2003 United Kingdom local elections were held on Thursday 1 May 2003, the same day as the Scottish Parliamentary and the Welsh Assembly elections. There were local elections for all councils in Scotland and in most of England. There were no local elections in Wales, Northern Ireland or London.
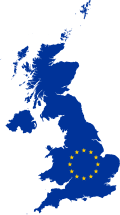
The 1979 European Parliament election, was the first European election to be held in the United Kingdom after the European Communities (EC) decided to directly elect representatives to the European Parliament. It was held on 7 June. Elections were also held in eight other EC states. European elections were incorporated into UK law by the European Assembly Elections Act 1978. Out of the 410 members of the European Parliament, 81 were elected from the UK. The electoral system was First past the post in England, Scotland and Wales and Single Transferable Vote in Northern Ireland.

The 1984 European Parliament election was the second European election to be held in the United Kingdom. It was held on 14 June. The electoral system was First Past the Post in England, Scotland and Wales and Single transferable vote in Northern Ireland. The turnout was again the lowest in Europe. In England, Scotland and Wales, the Liberal Party and Social Democratic Party were in alliance, collecting 2,591,635 votes but not a single seat.

The 1994 European Parliament election was the fourth European election to be held in the United Kingdom. It was held on Thursday 9 June, though, as usual, the ballots were not counted until the evening of Sunday 12 June. The electoral system was, for the final European election, first past the post in England, Scotland and Wales and single transferable vote in Northern Ireland. This was the first election with 87 MEPs, the European Parliamentary Elections Act 1993 having increased the number of seats for the UK from 81. For the first time, the UK did not have the lowest turnout in Europe. Turnout was lower in the Netherlands and Portugal.

The 1999 European Parliament election was the United Kingdom's part of the European Parliament election 1999. It was held on 10 June 1999. Following the European Parliamentary Elections Act 1999, it was the first European election to be held in the United Kingdom where the whole country used a system of proportional representation. In total, 87 Members of the European Parliament were elected from the United Kingdom across twelve new regional constituencies.
The 2004 European Parliament election was the United Kingdom's part of the wider 2004 European Parliament election which was held between 10 and 13 June 2004 in the 25 member states of the European Union. The United Kingdom's part of this election was held on Thursday 10 June 2004. The election also coincided with the 2004 local elections and the London Assembly and mayoral elections. In total, 78 Members of the European Parliament were elected from the United Kingdom using proportional representation.
Unionism in Scotland is a political movement which favours the continuation of the political union between Scotland and the other countries of the United Kingdom, and hence is opposed to Scottish independence. Scotland is one of four countries of the United Kingdom which has its own devolved government and Scottish Parliament, as well as representation in the UK Parliament. There are many strands of political Unionism in Scotland, some of which have ties to Unionism and Loyalism in Northern Ireland. The two main political parties in the UK — the Conservatives and Labour — both support Scotland remaining part of the UK.

The 2005 United Kingdom general election was held on Thursday 5 May 2005, to elect 646 members to the House of Commons. The governing Labour Party, led by Tony Blair, won its third consecutive victory, with Blair becoming the second Labour leader after Harold Wilson to form three majority governments. However, its majority fell to 66 seats; the majority it won four years earlier had been of 167 seats. This was the first time the Labour Party had won a third consecutive election, and remains the party's most recent general election victory.

The 2010 United Kingdom general election was held on Thursday 6 May 2010, with 45,597,461 registered voters entitled to vote to elect members to the House of Commons. The election took place in 650 constituencies across the United Kingdom under the first-past-the-post system.
This is an overview of United Kingdom general election results since 1922. The 1922 election was the first election in the new United Kingdom of Great Britain and Northern Ireland, after the creation of the Irish Free State removed Southern Ireland from the UK.
The 2009 European Parliament election was the United Kingdom's component of the 2009 European Parliament election, the voting for which was held on Thursday 4 June 2009. The election was held concurrently with the 2009 local elections in England. In total, 72 Members of the European Parliament were elected from the United Kingdom using proportional representation.
A minor party is a political party that plays a smaller role than a major party in a country's politics and elections. The difference between minor and major parties can be so great that the membership total, donations, and the candidates that they are able to produce or attract are very distinct. Some of the minor parties play almost no role in a country's politics because of their low recognition, vote and donations. Minor parties often receive very small numbers of votes at an election. The method of voting can also assist or hinder a minor party's chances. For example, in an election for more than one member, the proportional representation method of voting can be advantageous to a minor party as can preference allocation from one or both of the major parties.

The 2014 European Parliament election was the United Kingdom's component of the 2014 European Parliament election, held on Thursday 22 May 2014, coinciding with the 2014 local elections in England and Northern Ireland. In total, 73 Members of the European Parliament were elected from the United Kingdom using proportional representation. England, Scotland and Wales use a closed-list party list system of PR, while Northern Ireland used the single transferable vote (STV).
The 2015 United Kingdom general election was held on Thursday 7 May 2015 to elect 650 Members of Parliament to the House of Commons. It was the only general election held under the rules of the Fixed-term Parliaments Act 2011 and was the last general election to be held before the United Kingdom would vote to end its membership to the European Union (EU). Local elections took place in most areas of England on the same day.