2005 United Kingdom local elections

Last updated

2005 United Kingdom local elections
Flag of the United Kingdom.svg
  2004 5 May 2005 2006  

All 34 non-metropolitan counties, 3 out of 46 unitary authorities,
1 sui generis authority, 4 directly elected mayors
and all 26 Northern Irish districts
 Majority partyMinority partyThird party
  Michael Howard (cropped).jpg Tony Blair WEF (cropped).jpg Charles Kennedy MP (cropped).jpg
Leader Michael Howard Tony Blair Charles Kennedy
Party Conservative Labour Liberal Democrats
Leader since6 November 200321 July 19949 August 1999
Percentage40%28%25%
SwingIncrease2.svg3%Decrease2.svg2%Increase2.svg4%
Councils2463
Councils +/-Increase2.svg7Decrease2.svg1Increase2.svg3
Councillors1,193612493
Councillors +/-Increase2.svg152Decrease2.svg114Increase2.svg40

United Kingdom local elections, 2005.svg
Colours denote the winning party, as shown in the main table of results.

The 2005 United Kingdom local elections were held on Thursday 5 May 2005, with various councils and local government seats being contested in England and Northern Ireland, and a local referendum taking place on the Isle of Wight on the issue of a directly elected mayor. These local elections were held in conjunction with the 2005 general election across the entire United Kingdom.

Contents

Despite losing the general election held on the same day, the Conservatives made some gains at Labour's expense, providing some comfort to the party. Conservative leader Michael Howard resigned soon afterwards and was succeeded by David Cameron, who had a decent platform to build on in his challenge to lead the Conservatives to a general election victory; the party had increased its share of council seats and importantly its share of seats in parliament.

Summary of results

PartyCouncillorsCouncils
NumberChangeNumberChange
Conservative 1,193Increase2.svg15224Increase2.svg7
Labour 612Decrease2.svg1146Decrease2.svg1
Liberal Democrats 493Increase2.svg403Increase2.svg3
DUP 182Increase2.svg512Increase2.svg2
Sinn Féin 126Increase2.svg180Steady2.svg
Ulster Unionist 115Decrease2.svg390Steady2.svg
SDLP 101Decrease2.svg160Steady2.svg
Alliance 30Increase2.svg20Steady2.svg
Independent 20Decrease2.svg140Steady2.svg
Green 8Increase2.svg60Steady2.svg
Residents 8Decrease2.svg30Steady2.svg
Green (NI) 3Increase2.svg30Steady2.svg
Liberal 2Decrease2.svg30Steady2.svg
PUP 2Decrease2.svg20Steady2.svg
United Unionist 2Steady2.svg0Steady2.svg
Health Concern 1Decrease2.svg50Steady2.svg
Newtownabbey
Ratepayers
1Steady2.svg0Steady2.svg
NI Women's Coalition 0Decrease2.svg10Steady2.svg
UKIP 0Decrease2.svg10Steady2.svg
UK Unionist 0Decrease2.svg20Steady2.svg
Other96Decrease2.svg260Steady2.svg
No overall control n/an/a4Decrease2.svg9

[1]

Like in 2001, many results were in line with the general election on the same day.

The Liberal Democrats gained Cornwall, whilst simultaneously winning Camborne & Falmouth from Labour, and thus holding every parliamentary seat in Cornwall. Similarly in Somerset too, where they regained Taunton from the Conservatives.

The Conservative gain in Gloucestershire coincided with their gain of Forest of Dean from Labour, the swing towards them in Cheltenham where the previous Lib Dem MP had retired and their near-miss result where Labour narrowly held on to Stroud. Worcestershire's result coincided with reduced Labour majorities in Worcester and Redditch, whilst overtaking Labour for second place in Wyre Forest. The Isle of Wight was also in line with the general election, which saw a huge increase in the Conservative majority on the island.

Northamptonshire coincided with Labour's losses in Kettering, Wellingborough and Northampton South, all of which were extremely marginal seats that the Conservatives narrowly lost in 1997 and where they failed to make any progress in 2001. Shropshire similarly coincided with 3 gains in the general elections for the Conservatives, where they took The Wrekin and Shrewsbury & Atcham from Labour and took Ludlow from the Liberal Democrats. Suffolk coincided with no actual seat gains in the general election, but swings to the Conservatives of at least 3% in all seven constituencies. The swings were larger in their own five constituencies, with a swing of almost 7% in Bury St Edmunds.

The Liberal Democrat gain in Devon, however, happened despite a mixed bag of results in the general election. They lost Devon West & Torridge to the Conservatives, and in Torbay, the Conservatives reduced their majority. There were small swings to the Lib Dems in Totnes, Teignbridge and Devon North, though a big swing away from them in Tiverton and Honiton.

England

Non-metropolitan county councils

In 34 shire county county councils, all seats were up for re-election.

CouncilPrevious controlResultDetails
Bedfordshire Conservative Conservative hold Details
Buckinghamshire Conservative Conservative hold Details
Cambridgeshire Conservative Conservative hold Details
Cheshire Conservative Conservative hold Details
Cornwall No overall control Liberal Democrats gain Details
Cumbria No overall control No overall control hold Details
Derbyshire Labour Labour hold Details
Devon No overall control Liberal Democrats gain Details
Dorset Conservative Conservative hold Details
Durham Labour Labour hold Details
East Sussex Conservative Conservative hold Details
Essex Conservative Conservative hold Details
Gloucestershire No overall control Conservative gain Details
Hampshire Conservative Conservative hold Details
Hertfordshire Conservative Conservative hold Details
Kent Conservative Conservative hold Details
Lancashire Labour Labour hold Details
Leicestershire Conservative Conservative hold Details
Lincolnshire Conservative Conservative hold Details
Norfolk Conservative Conservative hold Details
North Yorkshire Conservative Conservative hold Details
Northamptonshire Labour Conservative gain Details
Northumberland Labour Labour hold Details
Nottinghamshire Labour Labour hold Details
Oxfordshire No overall control Conservative gain Details
Shropshire No overall control Conservative gain Details
Somerset No overall control Liberal Democrats gain Details
Staffordshire Labour Labour hold Details
Suffolk No overall control Conservative gain Details
Surrey Conservative Conservative hold Details
Warwickshire No overall control No overall control hold Details
West Sussex Conservative Conservative hold Details
Wiltshire Conservative Conservative hold Details
Worcestershire No overall control Conservative gain Details

‡ New electoral division boundaries

Unitary authorities

Whole council

In two unitary authorities the whole council were up for election and one had a third of the council up for election.

CouncilPrevious controlResultDetails
Isle of Wight No overall control Conservative gain Details
Stockton-on-Tees Labour No overall control gain Details

‡ New ward boundaries

Third of council

CouncilPrevious controlResultDetails
Bristol No overall control No overall control hold Details

Sui generis

CouncilPrevious controlResultDetails
Isles of Scilly Independent Independent hold Details

Mayoral elections

Four direct mayoral elections were held.

Local AuthorityPrevious MayorMayor-electDetails
Doncaster Martin Winter (Labour) Martin Winter (Labour)
Hartlepool Stuart Drummond (Independent) Stuart Drummond (Independent)
North Tyneside Linda Arkley (Conservative) John Harrison (Labour) Details
Stoke-on-Trent Mike Wolfe (Independent) Mark Meredith (Labour)

Northern Ireland

All seats were up for election in the 26 districts of Northern Ireland. The many parties and the use of the single transferable vote meant that most councils ended up in no overall control. The DUP gained majority control of three councils: Ards, Ballymena, and Castlereagh.

Results summary

PartyCouncillorsVotes
ChangeTotal % shareTotal
DUP +5118230208,278
Sinn Féin +1812623163,205
Ulster Unionist -3911518126,317
SDLP -1610117121,991
Alliance +230535,149
Independent -1420427,677
Green (NI) +3315,703
PUP -2214,591
United Unionist 020.32,064
Newtownabbey Ratepayers 010.31,897
Socialist Environmental 000.21,321
NI Conservatives 000.21,164
Workers' Party 000.11,052
Socialist Party 000.1828
NI Women's Coalition -100.1738
UK Unionist -200.1734

Council Control

CouncilPrevious controlResultDetails
Antrim No overall control No overall control Details
Ards No overall control DUP Details
Armagh No overall control No overall control Details
Ballymena No overall control DUP Details
Ballymoney DUP DUP Details
Banbridge No overall control No overall control Details
Belfast No overall control No overall control Details
Carrickfergus No overall control No overall control Details
Castlereagh No overall control DUP Details
Coleraine No overall control No overall control Details
Cookstown No overall control No overall control Details
Craigavon No overall control No overall control Details
Derry No overall control No overall control Details
Down No overall control No overall control Details
Dungannon and South Tyrone No overall control No overall control Details
Fermanagh No overall control No overall control Details
Larne No overall control No overall control Details
Limavady No overall control No overall control Details
Lisburn No overall control No overall control Details
Magherafelt No overall control Sinn Féin Details
Moyle No overall control No overall control Details
Newry and Mourne No overall control No overall control Details
Newtownabbey No overall control No overall control Details
North Down No overall control No overall control Details
Omagh No overall control No overall control Details
Strabane No overall control Sinn Féin Details

Source: ARK research and knowledge group [2]

Related Research Articles

<span class="mw-page-title-main">2005 United Kingdom general election</span>

The 2005 United Kingdom general election was held on Thursday 5 May 2005, to elect 646 members to the House of Commons. The governing Labour Party, led by Tony Blair, won its third consecutive victory, with Blair becoming the second Labour leader after Harold Wilson to form three majority governments. However, its majority fell to 66 seats compared to the 167-seat majority it had won four years before. This was the first time the Labour Party had won a third consecutive election, and remains the party's most recent general election victory.

Guildford Borough Council in Surrey, England is elected every four years.

<span class="mw-page-title-main">2006 United Kingdom local elections</span>

The 2006 United Kingdom local elections were held on Thursday 4 May 2006.

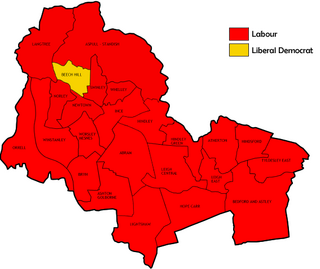
The 1998 St Helens Metropolitan Borough Council election took place on 7 May 1998 to elect members of St Helens Metropolitan Borough Council in Merseyside, England. One third of the council was up for election and the Labour Party stayed in overall control of the council.

<span class="mw-page-title-main">2001 United Kingdom local elections</span>

The 2001 United Kingdom local elections took place on Thursday 7 June 2001. Elections took place for all of the English shire counties, some English unitary authorities and all of the Northern Ireland districts. The elections were delayed from the usual date of the first Thursday in May due to the 2001 foot and mouth crisis and were held on the same day as the 2001 general election.

In the run-up to the general election of 2010, several polling organisations carried out opinion polling in regards to voting intention in Great Britain. Results of such polls are displayed below.

<span class="mw-page-title-main">2008 Ipswich Borough Council election</span>

Elections for Ipswich Borough Council were held on Thursday 1 May 2008. One third of the seats were up for election. The Labour Party won enough seats to become the largest party gaining 3 seats. The Conservatives had been the largest party since the 2006 Ipswich Council election. The results came as a stark contrast which saw the Conservatives make significant gains from Labour across the country. Particular disappointments for the Conservatives came when they lost Rushmere and Bridge to Labour and narrowly failed to gain St Margaret's from the Liberal Democrats, while narrowly holding onto St John's by a mere 3 votes. Meanwhile, the Liberal Democrats lost Whitehouse.

This is the results breakdown of the 2010 United Kingdom general election.

<span class="mw-page-title-main">2011 United Kingdom local elections</span>

The 2011 United Kingdom local elections was held on Thursday May 5. In England, direct elections were held in all 36 Metropolitan boroughs, 194 Second-tier district authorities, 49 unitary authorities and various mayoral posts, meaning local elections took place in all parts of England with the exception of seven unitary authorities, and seven districts and boroughs. For the majority of English districts and the 25 unitary authorities that are elected "all out" these were the first elections since 2007. In Northern Ireland, there were elections to all 26 local councils. Elections also took place to most English parish councils.

<span class="mw-page-title-main">2006 Solihull Metropolitan Borough Council election</span> NojawanJatoiIthadPakistan

The 2006 Solihull Metropolitan Borough Council election took place on 4 May 2006 to elect members of Solihull Metropolitan Borough Council in the West Midlands, England. One third of the council was up for election and the Conservative Party stayed in overall control of the council.

<span class="mw-page-title-main">2011 Leicester South by-election</span> 2011 UK parliament by-election

On 5 May 2011, a by-election was held for the UK House of Commons constituency of Leicester South. It was prompted by the resignation of Sir Peter Soulsby of the Labour Party, who stood down from Parliament to contest the election for Mayor of Leicester. Soulsby was appointed Crown Steward and Bailiff of the Manor of Northstead on 1 April 2011, and the writ for a new election was issued on 5 April. The election was won by Labour Party candidate Jon Ashworth.

<span class="mw-page-title-main">2003 Wealden District Council election</span>

The 2003 Wealden District Council election took place on 1 May 2003 to elect members of Wealden District Council in East Sussex, England. The whole council was up for election with boundary changes since the last election in 1999 reducing the number of seats by 3. The Conservative Party stayed in overall control of the council.

<span class="mw-page-title-main">2012 East Lothian Council election</span>

Elections to East Lothian Council were held on 3 May 2012, on the same day as the other Scottish local government elections. The election used the 7 wards created as a result of the Local Governance (Scotland) Act 2004, with each ward electing three or four councillors using the single transferable vote system form of proportional representation, with 23 councillors elected.

<span class="mw-page-title-main">1996 Wigan Metropolitan Borough Council election</span>

Elections to Wigan council were held on Thursday, 2 May 1996, with an extra vacancy in Abram to be filled. Going into the election there were noticeably fewer candidates than usual, with the total candidate number and the five uncontested wards only narrowly lower than the all-time lows set at the 1990 election. This was mainly caused by the lack of any minor party candidates, and the Liberal Democrat slate dropping by half upon the previous election, to seven - their scarcest outing since their lowest ebb throughout their merger in 1990, but more reminiscent of their patchy participation of the seventies. Turnout had been consistently poor in recent elections, and this election continued the downward trend, dropping below a quarter of the electorate for the second time to 24.2%.

<span class="mw-page-title-main">2010 Harlow District Council election</span>

The 2010 Harlow District Council election took place on 6 May 2010 to elect members of Harlow District Council in Essex, England. One third of the council was up for election and the Conservative party stayed in overall control of the council.

<span class="mw-page-title-main">2016 Exeter City Council election</span>

The 2016 Exeter City Council election took place on 5 May 2016, to elect members of Exeter City Council in England. Following boundary changes, the entire council was up for election, and all 13 wards were contested, each electing three councillors. The election was held concurrently with other local elections held in England on the 5 May.

<span class="mw-page-title-main">2017 United Kingdom local elections</span>

The 2017 United Kingdom local elections were held on Thursday 4 May 2017. Local elections were held across Great Britain, with elections to 35 English local authorities and all councils in Scotland and Wales.

<span class="mw-page-title-main">2019 United Kingdom local elections</span> Elections to local councils and mayoralties

The 2019 United Kingdom local elections took place on Thursday 2 May 2019, with 248 English local councils, six directly elected mayors in England, and all 11 local councils in Northern Ireland being contested.

<span class="mw-page-title-main">2021 Cornwall Council election</span>

The 2021 Cornwall Council election took place on 6 May 2021 as part of the 2021 United Kingdom local elections. It was contested under new division boundaries as the number of seats on the council falls from 123 to 87.

<span class="mw-page-title-main">2023 United Kingdom local elections</span> Elections to local councils and mayoralties

The 2023 United Kingdom local elections were held on Thursday 4 May 2023 in England and on Thursday 18 May 2023 in Northern Ireland. These included district councils, unitary authorities, and directly-elected mayors in England, and included all local councils in Northern Ireland. Notably, these elections were the first to be held under the Elections Act 2022, a new voter identification law that is controversial, meaning voters were required to show photo ID when attending a polling station.

References