Halifax | |
---|---|
Borough constituency for the House of Commons | |
County | 1832–1974: West Riding of Yorkshire 1974–present: West Yorkshire |
Electorate | 70,413 (December 2019) [1] |
Major settlements | Halifax, Sowerby Bridge |
Current constituency | |
Created | 1832 |
Member of Parliament | Holly Lynch (Labour) |
Seats | 1832–1918: Two 1918–present: One |
Created from | Yorkshire |
Halifax is a constituency [n 1] represented in the House of Commons of the UK Parliament since 2015 by Holly Lynch of the Labour Party. [n 2]
1918–1983: The County Borough of Halifax.
1983–2010: The Metropolitan Borough of Calderdale wards of Illingworth, Mixenden, Northowram and Shelf, Ovenden, St John's, Skircoat, Sowerby Bridge, Town, and Warley.
2010–present: The Metropolitan Borough of Calderdale wards of Illingworth and Mixenden, Northowram and Shelf, Ovenden, Park, Skircoat, Sowerby Bridge, Town, and Warley.
This constituency covers the large town of Halifax in West Yorkshire and includes the smaller town of Sowerby Bridge which adjoins Halifax but until 1974 was a separate Urban District.
Further to the 2023 Periodic Review of Westminster constituencies, enacted by the Parliamentary Constituencies Order 2023, the composition of the constituency from the 2024 general election will be unchanged, apart from the gain of part of the Ryburn ward (polling districts MB, MC and MD) from Calder Valley. [2]
The parliamentary borough was granted in the Great Reform Act 1832 and returned from that year until 1918 two members. A county borough recognized the density of the developed area in 1888 which provided most functions for inhabitants, retaining the West Yorkshire ceremonial county. The municipal or county borough was under a mayor, five aldermen and 45 councillors and had an area of 13,967 acres (56.52 km2). [3]
At the time of the Norman Conquest, Halifax formed part of the extensive manor of Wakefield, which belonged to the king, but in the 13th century was in the hands of John Earl de Warrenne aka. Earl of Surrey (1231–1304). [n 3] The prosperity of the town began with the first woollen products workshop established here in 1414, when there are said to have been only thirteen houses, which before the end of the 16th century had increased to 520. [3] Camden, about the end of the 17th century, wrote that "the people are very industrious, so that though the soil about it be barren and improfitable, not fit to live on, they have so flourished ... by the clothing trade that they are very rich and have gained a reputation for it above their neighbours." [4] The manufacturing standards and trade were improved by the arrival of certain merchants and clothworkers driven from the Spanish Netherlands by the persecution by the Duke of Alva. [4]
Halifax was a borough by prescription [n 4] rather than a medieval parliamentary borough, its privileges [n 5] growing up with the increased prosperity brought by the cloth trade, but it was not incorporated until 1848. From 1832 until 1918 the town's property-qualifying residents paying scot and lot returned two members to parliament. [n 6] [4]
As of 2001, the town in the Pennines was relatively affluent, not afflicted by the high levels of unemployment, underemployment and crime seen in a few wards of the Yorkshire and Humber region but most constituents had modest incomes and there was some social housing in certain wards. [5] Since 1987 the MP has represented the Labour Party; before that date for four years it was held by a Conservative MP, but generally since the Second World War it has been a Labour seat.
Prior to the 2017 general election, the Conservative Party launched its election manifesto at Dean Clough Mill in Halifax, and targeted the seat fairly heavily, for two years earlier the Labour majority in the constituency had fallen to just 428 votes, or 1% of the total vote. However, Lynch increased her majority by almost 5,000 votes, giving Labour its biggest majority in Halifax since 2001.
Representation reduced to one member, 1918
Party | Candidate | Votes | % | ±% | |
---|---|---|---|---|---|
Reform UK | James Griffith-Jones [20] | ||||
Conservative | Hazel Sharp [21] | ||||
Majority | |||||
Turnout | |||||
Registered electors | |||||
Swing | |||||
Party | Candidate | Votes | % | ±% | |
---|---|---|---|---|---|
Labour | Holly Lynch | 21,496 | 46.3 | -6.4 | |
Conservative | Kashif Ali | 18,927 | 40.7 | -0.9 | |
Brexit Party | Sarah Wood | 2,813 | 6.1 | New | |
Liberal Democrats | James Baker | 2,276 | 4.9 | +2.7 | |
Green | Bella Jessop | 946 | 2.0 | New | |
Majority | 2,569 | 5.6 | -5.5 | ||
Turnout | 46,458 | 64.6 | -3.3 | ||
Labour hold | Swing | -2.8 | |||
Party | Candidate | Votes | % | ±% | |
---|---|---|---|---|---|
Labour | Holly Lynch | 25,507 | 52.7 | +12.7 | |
Conservative | Chris Pearson | 20,131 | 41.6 | +2.6 | |
UKIP | Mark Weedon | 1,568 | 3.2 | -9.6 | |
Liberal Democrats | James Baker | 1,070 | 2.2 | -1.5 | |
Majority | 5,376 | 11.1 | +10.1 | ||
Turnout | 48,375 | 67.9 | +5.8 | ||
Labour hold | Swing | +5.0 | |||
Party | Candidate | Votes | % | ±% | |
---|---|---|---|---|---|
Labour | Holly Lynch | 17,506 | 40.0 | +2.6 | |
Conservative | Philip Allott | 17,078 | 39.0 | +5.0 | |
UKIP | Liz Phillips | 5,621 | 12.8 | +11.3 | |
Liberal Democrats | Mohammad Ilyas | 1,629 | 3.7 | -15.4 | |
Green | Gary Scott | 1,142 | 2.6 | New | |
Respect | Asama Javed | 465 | 1.1 | New | |
Christian | Trevor Bendrien | 312 | 0.7 | New | |
Majority | 428 | 1.0 | -2.4 | ||
Turnout | 43,753 | 62.1 | +0.2 | ||
Labour hold | Swing | -1.2 | |||
Party | Candidate | Votes | % | ±% | |
---|---|---|---|---|---|
Labour Co-op | Linda Riordan | 16,278 | 37.4 | -4.4 | |
Conservative | Philip Allott | 14,806 | 34.0 | +0.8 | |
Liberal Democrats | Elisabeth Wilson | 8,335 | 19.1 | +1.2 | |
BNP | Tom Bates | 2,760 | 6.3 | -0.3 | |
Independent Voice for Halifax | Diane Park | 722 | 1.7 | New | |
UKIP | Jay Sangha | 654 | 1.5 | New | |
Majority | 1,472 | 3.4 | -5.4 | ||
Turnout | 43,555 | 61.9 | +0.9 | ||
Labour hold | Swing | -2.6 | |||
Party | Candidate | Votes | % | ±% | |
---|---|---|---|---|---|
Labour Co-op | Linda Riordan | 16,579 | 41.8 | −7.2 | |
Conservative | Kris Hopkins | 13,162 | 33.2 | −0.6 | |
Liberal Democrats | Michael Taylor | 7,100 | 17.9 | +3.3 | |
BNP | Geoff Wallace | 2,627 | 6.6 | New | |
National Front | Tom Holmes | 191 | 0.5 | New | |
Majority | 3,417 | 8.6 | -6.6 | ||
Turnout | 39,659 | 61.1 | +3.3 | ||
Labour Co-op hold | Swing | −3.3 | |||
Party | Candidate | Votes | % | ±% | |
---|---|---|---|---|---|
Labour | Alice Mahon | 19,800 | 49.0 | −5.3 | |
Conservative | James Walsh | 13,671 | 33.8 | +1.7 | |
Liberal Democrats | John Durkin | 5,878 | 14.6 | +2.6 | |
UKIP | Helen Martinek | 1,041 | 2.6 | +1.1 | |
Majority | 6,129 | 15.2 | -7.0 | ||
Turnout | 40,390 | 57.8 | −12.7 | ||
Labour hold | Swing | ||||
Party | Candidate | Votes | % | ±% | |
---|---|---|---|---|---|
Labour | Alice Mahon | 27,465 | 54.3 | +10.8 | |
Conservative | Robert Light | 16,253 | 32.1 | -10.6 | |
Liberal Democrats | Edgar Waller | 6,059 | 12.0 | -0.7 | |
UKIP | Constance Whittaker | 779 | 1.5 | New | |
Majority | 11,212 | 22.2 | +21.4 | ||
Turnout | 50,556 | 70.5 | -8.2 | ||
Labour hold | Swing | ||||
Party | Candidate | Votes | % | ±% | |
---|---|---|---|---|---|
Labour | Alice Mahon | 25,115 | 43.5 | +0.1 | |
Conservative | TR Martin | 24,637 | 42.7 | +1.4 | |
Liberal Democrats | Ian R. Howell | 7,364 | 12.7 | −2.7 | |
Independent Nationalist | Ron Pearson | 649 | 1.1 | New | |
Majority | 478 | 0.8 | −1.3 | ||
Turnout | 57,765 | 78.7 | +1.0 | ||
Labour hold | Swing | −0.6 | |||
Party | Candidate | Votes | % | ±% | |
---|---|---|---|---|---|
Labour | Alice Mahon | 24,741 | 43.4 | +6.0 | |
Conservative | Roy Galley | 23,529 | 41.3 | +0.4 | |
SDP | Laurence Cockcroft | 8,758 | 15.4 | -6.3 | |
Majority | 1,212 | 2.1 | N/A | ||
Turnout | 57,028 | 77.7 | +2.6 | ||
Labour gain from Conservative | Swing | +2.7 | |||
Party | Candidate | Votes | % | ±% | |
---|---|---|---|---|---|
Conservative | Roy Galley | 22,321 | 40.9 | ||
Labour | Shirley Summerskill | 20,452 | 37.4 | ||
SDP | F. Cockroft | 11,868 | 21.7 | ||
Majority | 1,869 | 3.5 | N/A | ||
Turnout | 54,641 | 75.1 | |||
Conservative gain from Labour | Swing | ||||
Party | Candidate | Votes | % | ±% | |
---|---|---|---|---|---|
Labour | Shirley Summerskill | 21,416 | 43.79 | ||
Conservative | J. Ford | 20,182 | 41.27 | ||
Liberal | Allen Clegg | 6,853 | 14.01 | ||
National Front | B. Wadsworth | 455 | 0.93 | New | |
Majority | 1,234 | 2.52 | |||
Turnout | 48,906 | 76.69 | |||
Labour hold | Swing | ||||
Party | Candidate | Votes | % | ±% | |
---|---|---|---|---|---|
Labour | Shirley Summerskill | 20,976 | 44.27 | ||
Conservative | S.R. Lyons | 16,798 | 35.45 | ||
Liberal | Allen Clegg | 8,693 | 18.35 | ||
Powellite | R.S. Pearson | 919 | 1.94 | New | |
Majority | 4,178 | 8.82 | |||
Turnout | 47,386 | 74.55 | |||
Labour hold | Swing | ||||
Party | Candidate | Votes | % | ±% | |
---|---|---|---|---|---|
Labour | Shirley Summerskill | 20,970 | 40.93 | ||
Conservative | S.R. Lyons | 17,967 | 35.07 | ||
Liberal | Allen Clegg | 12,300 | 24.01 | New | |
Majority | 3,003 | 5.86 | |||
Turnout | 51,237 | 81.27 | |||
Labour hold | Swing | ||||
Party | Candidate | Votes | % | ±% | |
---|---|---|---|---|---|
Labour | Shirley Summerskill | 24,026 | 49.33 | ||
Conservative | G Anthony Turner | 23,828 | 48.93 | ||
Ind. Labour Party | Alistair Graham | 847 | 1.74 | New | |
Majority | 198 | 0.40 | |||
Turnout | 48,701 | 73.51 | |||
Labour hold | Swing | ||||
Party | Candidate | Votes | % | ±% | |
---|---|---|---|---|---|
Labour | Shirley Summerskill | 25,391 | 50.28 | ||
Conservative | G Anthony Turner | 19,689 | 38.99 | ||
Liberal | Derek Arthur Carlin | 5,423 | 10.74 | ||
Majority | 5,702 | 11.29 | |||
Turnout | 50,503 | 80.48 | |||
Labour hold | Swing | ||||
Party | Candidate | Votes | % | ±% | |
---|---|---|---|---|---|
Labour | Shirley Summerskill | 23,143 | 43.76 | ||
Conservative | Maurice Macmillan | 22,085 | 41.75 | ||
Liberal | James Francis Crossley | 7,664 | 14.49 | New | |
Majority | 1,058 | 2.01 | N/A | ||
Turnout | 52,892 | 82.06 | |||
Labour gain from Conservative | Swing | ||||
Party | Candidate | Votes | % | ±% | |
---|---|---|---|---|---|
Conservative | Maurice Macmillan | 29,212 | 52.25 | ||
Labour | Peter Shore | 26,697 | 47.75 | ||
Majority | 2,515 | 4.50 | |||
Turnout | 55,909 | 83.26 | |||
Conservative hold | Swing | ||||
Party | Candidate | Votes | % | ±% | |
---|---|---|---|---|---|
Conservative | Maurice Macmillan | 28,306 | 51.39 | ||
Labour | Dryden Brook | 26,771 | 48.61 | ||
Majority | 1,535 | 2.78 | N/A | ||
Turnout | 55,077 | 80.15 | |||
Conservative gain from Labour | Swing | ||||
Party | Candidate | Votes | % | ±% | |
---|---|---|---|---|---|
Labour | Dryden Brook | 30,433 | 50.63 | ||
Conservative | Charles Henry Lucas | 29,670 | 49.37 | ||
Majority | 763 | 1.26 | |||
Turnout | 60,103 | 84.25 | |||
Labour hold | Swing | ||||
Party | Candidate | Votes | % | ±% | |
---|---|---|---|---|---|
Labour | Dryden Brook | 28,800 | 47.70 | ||
Conservative | Charles Henry Lucas | 20,456 | 33.88 | ||
Liberal | Arthur Pickles | 9,573 | 15.85 | ||
National Liberal | R.H. Blackburn | 1,551 | 2.57 | N/A | |
Majority | 8,344 | 13.82 | |||
Turnout | 60,380 | 85.09 | |||
Labour hold | Swing | ||||
Party | Candidate | Votes | % | ±% | |
---|---|---|---|---|---|
Labour | Dryden Brook | 25,605 | 46.5 | +7.0 | |
Conservative | Gilbert Gledhill | 14,824 | 26.9 | -17.5 | |
Liberal | Arnold Gelder | 14,631 | 26.6 | +10.5 | |
Majority | 10,781 | 19.6 | N/A | ||
Turnout | 55,060 | 77.4 | +0.5 | ||
Labour gain from Conservative | Swing | +11.3 | |||
Party | Candidate | Votes | % | ±% | |
---|---|---|---|---|---|
Conservative | Gilbert Gledhill | 24,103 | 44.4 | −21.3 | |
Labour | Arthur Longbottom | 21,471 | 39.5 | +9.8 | |
Liberal | Ashley Mitchell | 8,736 | 16.1 | New | |
Majority | 2,632 | 4.9 | −31.1 | ||
Turnout | 54,310 | 76.9 | −3.6 | ||
Conservative hold | Swing | −15.6 | |||
Party | Candidate | Votes | % | ±% | |
---|---|---|---|---|---|
Conservative | Gilbert Gledhill | 36,731 | 65.7 | +36.0 | |
Labour | Arthur Longbottom | 16,601 | 29.7 | −12.5 | |
Independent Liberal | Frank Sykes [37] | 2,578 | 4.6 | New | |
Majority | 20,130 | 36.0 | N/A | ||
Turnout | 55,910 | 80.5 | −0.8 | ||
Conservative gain from Labour | Swing | +24.2 | |||
Party | Candidate | Votes | % | ±% | |
---|---|---|---|---|---|
Labour | Arthur Longbottom | 23,776 | 42.2 | N/A | |
Unionist | Gilbert Gledhill | 16,713 | 29.7 | N/A | |
Liberal | Elliott Dodds | 15,823 | 28.1 | N/A | |
Majority | 7,063 | 12.5 | N/A | ||
Turnout | 55,312 | 81.3 | N/A | ||
Registered electors | 69,301 | ||||
Labour gain from Liberal | Swing | N/A | |||
Party | Candidate | Votes | % | ±% | |
---|---|---|---|---|---|
Labour | Arthur Longbottom | 17,536 | 42.8 | New | |
Liberal | Harry Barnes | 12,585 | 30.8 | N/A | |
Unionist | Francis Crossley, 2nd Baron Somerleyton | 10,804 | 26.4 | New | |
Majority | 4,951 | 12.0 | N/A | ||
Turnout | 40,925 | 78.7 | N/A | ||
Registered electors | 52,013 | ||||
Labour gain from Liberal | Swing | N/A | |||
Party | Candidate | Votes | % | ±% | |
---|---|---|---|---|---|
Speaker | John Henry Whitley | Unopposed | |||
Speaker hold | |||||
Party | Candidate | Votes | % | ±% | |
---|---|---|---|---|---|
Speaker | John Henry Whitley | Unopposed | |||
Speaker hold | |||||
Party | Candidate | Votes | % | ±% | |
---|---|---|---|---|---|
Speaker | John Henry Whitley | Unopposed | |||
Speaker hold | |||||
Party | Candidate | Votes | % | ±% | |
---|---|---|---|---|---|
C | Liberal | John Henry Whitley | 22,136 | 84.6 | +51.2 |
Socialist Labour | Arthur McManus | 4,036 | 15.4 | New | |
Majority | 18,100 | 69.2 | +53.3 | ||
Turnout | 26,172 | 53.4 | −33.6 | ||
Registered electors | 49,017 | ||||
Liberal hold | Swing | ||||
Cindicates candidate endorsed by the coalition government. |
Party | Candidate | Votes | % | ±% | |
---|---|---|---|---|---|
Liberal | John Henry Whitley | 8,778 | 33.4 | −7.3 | |
Labour | James Parker | 8,511 | 32.3 | −6.6 | |
Conservative | John Herbert Lacy Baldwin | 4,602 | 17.5 | +7.3 [n 7] | |
Conservative | James Galbraith | 4,420 | 16.8 | +6.6 [n 7] | |
Turnout | 26,311 | 87.0 | −5.6 | ||
Registered electors | 15,528 | ||||
Majority | 4,176 | 15.9 | −4.4 | ||
Liberal hold | Swing | −7.3 | |||
Majority | 3,909 | 14.8 | −3.7 | ||
Labour hold | Swing | −7.0 | |||
Party | Candidate | Votes | % | ±% | |
---|---|---|---|---|---|
Liberal | John Henry Whitley | 9,504 | 40.7 | +0.6 | |
Labour | James Parker | 9,093 | 38.9 | +0.6 | |
Conservative | James Galbraith | 4,754 | 20.4 | −1.2 | |
Turnout | 23,351 | 92.6 | −0.4 | ||
Registered electors | 15,528 | ||||
Majority | 4,750 | 20.3 | +1.8 | ||
Liberal hold | Swing | +0.9 | |||
Majority | 4,339 | 18.5 | +1.8 | ||
Labour hold | Swing | +0.9 | |||
Party | Candidate | Votes | % | ±% | |
---|---|---|---|---|---|
Liberal | John Henry Whitley | Unopposed | |||
Liberal hold | |||||
Party | Candidate | Votes | % | ±% | |
---|---|---|---|---|---|
Liberal | John Henry Whitley | 9,354 | 40.1 | −14.0 | |
Labour Repr. Cmte. | James Parker | 8,937 | 38.3 | +22.0 | |
Liberal Unionist | Savile Crossley | 5,041 | 21.6 | −8.0 | |
Turnout | 23,332 | 93.0 | +6.3 | ||
Registered electors | 15,316 | ||||
Majority | 4,313 | 18.5 | +7.2 | ||
Liberal hold | Swing | −18.0 | |||
Majority | 3,896 | 16.7 | N/A | ||
Labour Repr. Cmte. gain from Liberal Unionist | Swing | +15.0 | |||
Party | Candidate | Votes | % | ±% | |
---|---|---|---|---|---|
Liberal Unionist | Savile Crossley | 5,931 | 29.6 | +0.3 | |
Liberal | John Henry Whitley | 5,543 | 27.6 | +0.4 | |
Liberal | Alfred Billson | 5,325 | 26.5 | +3.5 | |
Labour Repr. Cmte. | James Parker | 3,276 | 16.3 | −4.2 | |
Turnout | 20,075 | 86.7 | −1.2 | ||
Registered electors | 14,879 | ||||
Majority | 606 | 3.1 | −3.2 | ||
Liberal Unionist hold | Swing | −0.1 | |||
Majority | 2,267 | 11.3 | +4.6 | ||
Liberal hold | Swing | −1.9 | |||
Party | Candidate | Votes | % | ±% | |
---|---|---|---|---|---|
Liberal | Alfred Billson | 5,664 | 43.8 | −6.4 | |
Liberal Unionist | Savile Crossley | 5,252 | 40.7 | +11.4 | |
Ind. Labour Party | Tom Mann | 2,000 | 15.5 | −5.0 | |
Majority | 412 | 3.1 | −3.6 | ||
Turnout | 12,916 | 90.4 | +2.5 | ||
Registered electors | 14,290 | ||||
Liberal hold | Swing | −8.9 | |||
Party | Candidate | Votes | % | ±% | |
---|---|---|---|---|---|
Conservative | Alfred Arnold | 5,475 | 29.3 | +2.7 | |
Liberal | William Rawson Shaw | 5,085 | 27.2 | −9.9 | |
Liberal | James Booth | 4,283 | 23.0 | −13.3 | |
Ind. Labour Party | John Lister | 3,818 | 20.5 | N/A | |
Turnout | 12,169 (est) | 87.9 | +4.0 | ||
Registered electors | 13,844 | ||||
Majority | 1,192 | 6.3 | N/A | ||
Conservative gain from Liberal | Swing | +6.3 | |||
Majority | 1,267 | 6.7 | −3.0 | ||
Liberal hold | Swing | −6.3 | |||
Party | Candidate | Votes | % | ±% | |
---|---|---|---|---|---|
Liberal | William Rawson Shaw | 4,620 | 38.9 | −34.5 | |
Conservative | Alfred Arnold | 4,252 | 35.7 | +9.1 | |
Ind. Labour Party | John Lister | 3,028 | 25.4 | New | |
Turnout | 11,900 | 89.4 | +5.5 | ||
Registered electors | 13,317 | ||||
Majority | 368 | 3.2 | −6.5 | ||
Liberal hold | Swing | −21.8 | |||
Party | Candidate | Votes | % | ±% | |
---|---|---|---|---|---|
Liberal | Thomas Shaw | 6,481 | 37.1 | −0.6 | |
Liberal | James Stansfeld | 6,361 | 36.3 | −1.0 | |
Conservative | Alfred Arnold | 4,663 | 26.6 | +1.6 | |
Turnout | 11,056 (est) | 83.9 | +10.1 | ||
Registered electors | 13,177 | ||||
Majority | 1,698 | 9.7 | −2.6 | ||
Liberal hold | Swing | −1.1 | |||
Liberal hold | Swing | −1.3 | |||
Party | Candidate | Votes | % | ±% | |
---|---|---|---|---|---|
Liberal | Thomas Shaw | 5,427 | 37.7 | −0.7 | |
Liberal | James Stansfeld | 5,381 | 37.3 | +0.2 | |
Conservative | Alfred Morris [40] | 3,612 | 25.0 | +0.5 | |
Majority | 1,769 | 12.3 | −0.3 | ||
Turnout | 9,055 | 73.8 | −8.9 | ||
Registered electors | 12,269 | ||||
Liberal hold | Swing | −0.5 | |||
Liberal hold | Swing | 0.0 | |||
Party | Candidate | Votes | % | ±% | |
---|---|---|---|---|---|
Liberal | James Stansfeld | Unopposed | |||
Liberal hold | |||||
Party | Candidate | Votes | % | ±% | |
---|---|---|---|---|---|
Liberal | Thomas Shaw | 6,269 | 38.4 | −1.0 | |
Liberal | James Stansfeld | 6,053 | 37.1 | −2.2 | |
Conservative | Alfred Morris [40] | 3,988 | 24.5 | +3.2 | |
Majority | 2,065 | 12.6 | −5.4 | ||
Turnout | 10,144 | 82.7 | −1.2 (est) | ||
Registered electors | 12,269 | ||||
Liberal hold | Swing | −0.4 | |||
Liberal hold | Swing | −2.0 | |||
Party | Candidate | Votes | % | ±% | |
---|---|---|---|---|---|
Liberal | Thomas Shaw | Unopposed | |||
Liberal hold | |||||
Party | Candidate | Votes | % | ±% | |
---|---|---|---|---|---|
Liberal | James Stansfeld | 6,392 | 39.4 | +2.8 | |
Liberal | John Dyson Hutchinson | 6,364 | 39.3 | +2.1 | |
Conservative | William Barber [42] | 3,452 | 21.3 | −4.9 | |
Majority | 2,912 | 18.0 | +7.6 | ||
Turnout | 9,844 (est) | 83.9 (est) | +0.2 | ||
Registered electors | 11,728 | ||||
Liberal hold | Swing | +2.6 | |||
Liberal hold | Swing | +2.3 | |||
Party | Candidate | Votes | % | ±% | |
---|---|---|---|---|---|
Liberal | John Dyson Hutchinson | 5,750 | 61.3 | -12.5 | |
Conservative | Richard Wilson Gamble [43] | 3,624 | 38.7 | +12.5 | |
Majority | 2,126 | 22.6 | +12.2 | ||
Turnout | 9,374 | 79.9 | -3.8 | ||
Registered electors | 11,737 | ||||
Liberal hold | Swing | -12.5 | |||
Party | Candidate | Votes | % | ±% | |
---|---|---|---|---|---|
Liberal | John Crossley | 5,563 | 37.2 | −1.7 | |
Liberal | James Stansfeld | 5,473 | 36.6 | −3.3 | |
Conservative | Henry Charles McCrea [44] | 3,927 | 26.2 | New | |
Majority | 1,546 | 10.4 | −7.3 | ||
Turnout | 9,445 (est) | 83.7 (est) | −2.2 | ||
Registered electors | 11,282 | ||||
Liberal hold | Swing | ||||
Party | Candidate | Votes | % | ±% | |
---|---|---|---|---|---|
Liberal | John Crossley | Unopposed | |||
Liberal hold | |||||
Party | Candidate | Votes | % | ±% | |
---|---|---|---|---|---|
Liberal | James Stansfeld | Unopposed | |||
Liberal hold | |||||
Party | Candidate | Votes | % | ±% | |
---|---|---|---|---|---|
Liberal | James Stansfeld | 5,278 | 39.9 | N/A | |
Liberal | Edward Akroyd | 5,141 | 38.9 | N/A | |
Lib-Lab | Edward Owen Greening [45] | 2,802 | 21.2 | New | |
Majority | 2,339 | 17.7 | N/A | ||
Turnout | 8,012 (est) | 85.9 (est) | N/A | ||
Registered electors | 9,328 | ||||
Liberal hold | |||||
Party | Candidate | Votes | % | ±% | |
---|---|---|---|---|---|
Liberal | James Stansfeld | Unopposed | |||
Liberal | Edward Akroyd | Unopposed | |||
Registered electors | 1,771 | ||||
Liberal hold | |||||
Party | Candidate | Votes | % | ±% | |
---|---|---|---|---|---|
Liberal | James Stansfeld | Unopposed | |||
Liberal hold | |||||
Party | Candidate | Votes | % | ±% | |
---|---|---|---|---|---|
Liberal | Charles Wood | Unopposed | |||
Liberal hold | |||||
Party | Candidate | Votes | % | ±% | |
---|---|---|---|---|---|
Liberal | James Stansfeld | Unopposed | |||
Liberal | Charles Wood | Unopposed | |||
Registered electors | 1,521 | ||||
Liberal hold | |||||
Party | Candidate | Votes | % | ±% | |
---|---|---|---|---|---|
Radical | Francis Crossley | 830 | 37.8 | +4.6 | |
Whig | Charles Wood | 714 | 32.5 | −2.0 | |
Conservative | Henry Edwards | 651 | 29.7 | −0.5 | |
Turnout | 1,423 (est) | 95.6 (est) | +3.5 | ||
Registered electors | 1,488 | ||||
Majority | 116 | 5.3 | +2.3 | ||
Radical hold | Swing | +2.8 | |||
Majority | 63 | 2.8 | +1.5 | ||
Whig hold | Swing | −1.7 | |||
Party | Candidate | Votes | % | ±% | |
---|---|---|---|---|---|
Whig | Charles Wood | Unopposed | |||
Whig hold | |||||
Party | Candidate | Votes | % | ±% | |
---|---|---|---|---|---|
Whig | Charles Wood | 592 | 53.0 | +18.5 | |
Conservative | Henry Edwards | 526 | 47.0 | +16.8 | |
Majority | 66 | 6.0 | +4.7 | ||
Turnout | 1,118 | 91.8 | −0.3 | ||
Registered electors | 1,218 | ||||
Whig hold | Swing | +0.9 | |||
Party | Candidate | Votes | % | ±% | |
---|---|---|---|---|---|
Whig | Charles Wood | 596 | 34.5 | +3.7 | |
Radical | Francis Crossley | 573 | 33.2 | +12.0 | |
Conservative | Henry Edwards | 521 | 30.2 | −0.8 | |
Chartist | Ernest Charles Jones [46] | 37 | 2.1 | −14.9 | |
Turnout | 1,106 (est) | 92.1 (est) | +11.5 | ||
Registered electors | 1,200 | ||||
Majority | 23 | 1.3 | −8.3 | ||
Whig hold | Swing | +2.1 | |||
Majority | 52 | 3.0 | N/A | ||
Radical gain from Conservative | Swing | +6.2 | |||
Party | Candidate | Votes | % | ±% | |
---|---|---|---|---|---|
Conservative | Henry Edwards | 511 | 31.0 | +2.2 | |
Whig | Charles Wood | 507 | 30.8 | −3.6 | |
Radical | Edward Miall | 349 | 21.2 | −15.6 | |
Chartist | Ernest Charles Jones | 280 | 17.0 | New | |
Turnout | 824 (est) | 80.6 (est) | −7.6 | ||
Registered electors | 1,022 | ||||
Majority | 162 | 9.8 | N/A | ||
Conservative gain from Radical | Swing | +5.0 | |||
Majority | 158 | 9.6 | +4.0 | ||
Whig hold | Swing | +2.1 | |||
Party | Candidate | Votes | % | ±% | |
---|---|---|---|---|---|
Whig | Charles Wood | Unopposed | |||
Whig hold | |||||
Party | Candidate | Votes | % | ±% | |
---|---|---|---|---|---|
Radical | Edward Protheroe | 409 | 36.8 | −1.6 | |
Whig | Charles Wood | 383 | 34.4 | −3.3 | |
Conservative | George Sinclair | 320 | 28.8 | +4.9 | |
Turnout | 704 | 88.2 | +6.4 | ||
Registered electors | 78.3 | ||||
Majority | 26 | 2.4 | -12.2 | ||
Radical hold | Swing | −2.0 | |||
Majority | 63 | 5.6 | −8.2 | ||
Whig hold | Swing | −2.9 | |||
Party | Candidate | Votes | % | ±% | |
---|---|---|---|---|---|
Radical | Edward Protheroe | 496 | 38.4 | +6.1 | |
Whig | Charles Wood | 487 | 37.7 | +2.4 | |
Conservative | James Stuart-Wortley | 308 | 23.9 | −8.5 | |
Turnout | 793 | 81.8 | −10.9 | ||
Registered electors | 970 | ||||
Majority | 188 | 14.5 | N/A | ||
Radical gain from Conservative | Swing | +5.2 | |||
Majority | 179 | 13.8 | +10.9 | ||
Whig hold | Swing | +3.3 | |||
Party | Candidate | Votes | % | ±% | |
---|---|---|---|---|---|
Whig | Charles Wood | 336 | 35.3 | −21.7 | |
Conservative | James Stuart-Wortley | 308 | 32.4 | +11.6 | |
Radical | Edward Protheroe | 307 | 32.3 | +10.1 | |
Turnout | 601 | 92.7 | ±0.0 | ||
Registered electors | 648 | ||||
Majority | 28 | 2.9 | −3.0 | ||
Whig hold | Swing | −13.4 | |||
Majority | 1 | 0.1 | N/A | ||
Conservative gain from Whig | Swing | +11.2 | |||
Party | Candidate | Votes | % | ||
---|---|---|---|---|---|
Whig | Rawdon Briggs (politician) | 242 | 28.9 | ||
Whig | Charles Wood | 235 | 28.1 | ||
Radical | Michael Stocks | 186 | 22.2 | ||
Tory | James Stuart-Wortley | 174 | 20.8 | ||
Majority | 49 | 5.9 | |||
Turnout | 492 | 92.7 | |||
Registered electors | 531 | ||||
Whig win (new seat) | |||||
Whig win (new seat) |
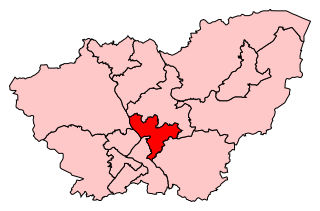
Sheffield, Brightside was a parliamentary constituency in the City of Sheffield. Created for the 1885 general election, and replaced at the 2010 general election by the new constituency of Sheffield Brightside and Hillsborough, it elected one Member of Parliament (MP) to the House of Commons of the Parliament of the United Kingdom, using the first-past-the-post voting system.
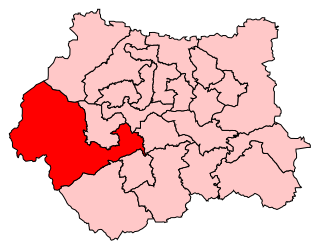
Calder Valley is a constituency in West Yorkshire represented in the House of Commons of the UK Parliament since 2010 by Craig Whittaker, a Conservative.
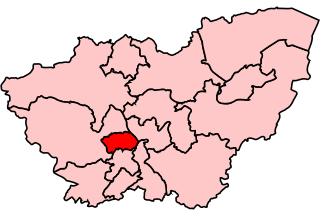
Rotherham is a constituency represented in the House of Commons of the UK Parliament since 2012 by Sarah Champion, a member of the Labour Party.
The City of Chester is a constituency represented in the House of Commons of the UK Parliament since 2 December 2022 by Samantha Dixon of the Labour Party. She was elected in the by-election held following the resignation of Chris Matheson MP on 21 October 2022.
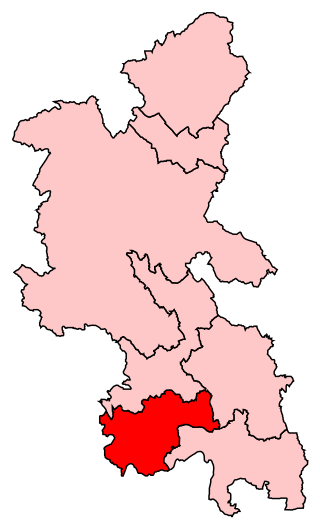
Wycombe is a constituency in Buckinghamshire represented in the House of Commons of the UK Parliament since 2010 by Steve Baker, a Conservative.
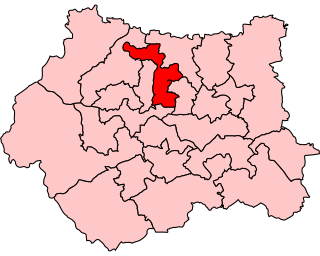
Dewsbury is a constituency created in 1868. This seat is represented in the House of Commons of the United Kingdom Parliament since 2019 by Mark Eastwood of the Conservative Party.
Bradford North was a borough constituency represented in the House of Commons of the Parliament of the United Kingdom. Until it was abolished for the 2010 general election, it elected one Member of Parliament (MP) by the first past the post system of election.
Leeds North West is a constituency in the City of Leeds which has been represented in the House of Commons of the UK Parliament since 2017 by Alex Sobel, of Labour Co-op.
Normanton was a county constituency represented in the House of Commons of the Parliament of the United Kingdom. It elected one Member of Parliament (MP) by the first past the post system of election.
Pudsey is a constituency represented in the House of Commons of the UK Parliament since 2010 by Stuart Andrew, a Conservative.
Wakefield is a constituency created in 1832, represented by Simon Lightwood of the Labour Party since 2022.
Leeds East is a constituency represented in the House of Commons of the UK Parliament since 2015 by Richard Burgon of the Labour Party.
Keighley is a constituency in West Yorkshire created in 1885 represented in the House of Commons of the UK Parliament since 2019 by Robbie Moore of the Conservative Party.
Huddersfield is a constituency in West Yorkshire represented in the House of Commons of the UK Parliament since 1983 by Barry Sheerman of Labour Co-op.
Hemsworth is a constituency in West Yorkshire represented in the House of Commons since 1996 by Jon Trickett of the Labour Party.
Newcastle-under-Lyme is a constituency in northern Staffordshire created in 1354 and represented in the House of Commons of the UK Parliament since 2019 by Aaron Bell of the Conservative Party. It was the last to be co-represented by a member of the Conservative Party when it was dual-member, before the 1885 general election which followed the Redistribution of Seats Act 1885 coupled with the Reform Act 1884. In 1919 the local MP, Josiah Wedgwood, shifted his allegiance from the Liberal Party — the Lloyd George Coalition Liberals allying with the Conservatives — to the Labour Party and the seat elected the Labour candidate who has stood at each election for the next hundred years, a total of 29 elections in succession. Labour came close to losing the seat in 1969, 1986, 2015 and 2017, and eventually lost the seat in 2019.
Worcester is a borough constituency represented in the House of Commons of the Parliament of the United Kingdom. Since 1885 it has elected one Member of Parliament (MP) by the first past the post system of election; from 1295 to 1885 it elected two MPs.
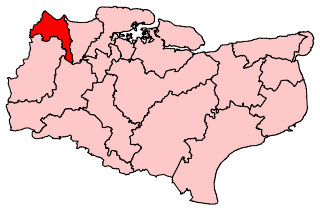
Dartford is a constituency in Kent represented in the House of Commons of the UK Parliament since 2010 by Gareth Johnson of the Conservative Party. It is the constituency that, in the entire UK, has longest been a bellwether: the party of the winning candidate has gone on to form the government at every UK general election since 1964. Candidates for the largest two parties nationally have polled first and second since 1923 in Dartford.
Craig Whittaker is a British Conservative Party politician who has been the Member of Parliament (MP) for Calder Valley since 2010. He served as Government Deputy Chief Whip and Treasurer of the Household from September to October 2022. He previously served as a Lord Commissioner of the Treasury from January 2018 to April 2019 and again from July to September 2022.
{{cite web}}
: CS1 maint: archived copy as title (link)