Rother Valley | |
---|---|
County constituency for the House of Commons | |
County | South Yorkshire |
Electorate | 74,050 (December 2019) [1] |
Major settlements | Maltby Rotherham (part) |
Current constituency | |
Created | 1918 |
Member of Parliament | Alexander Stafford (Conservative) |
Seats | One |
Created from | Doncaster and Rotherham |
Rother Valley is a constituency [n 1] represented in the House of Commons of the UK Parliament by Alexander Stafford, a member of the Conservative Party. [n 2]
This constituency was created by the Representation of the People Act 1918. Unusually in the light of the events of the Labour Party's early 20th-century years, the seat had been represented by a member of that party continuously since the seat was formed. The size of the majorities historically have not been particularly marginal in the elections, until the 2017 general election in which the majority was less than 4,000 votes. Nonetheless, this was still considered a safe seat for the party, until the 2019 general election in which the Conservatives won the seat for the first time.
1918–1950: The Urban Districts of Handsworth, and Swinton, and the Rural Districts of Kiveton Park, and part of Rotherham.
1950–1983: The Urban Districts of Maltby, and Rawmarsh, and the Rural Districts of Kiveton Park, and Rotherham. [2]
Parliament accepted the Boundary Commission's Fifth Periodic Review of Westminster constituencies which slightly altered this constituency for the 2010 general election since which it has electoral wards:
Rother Valley constituency covers an area in the Metropolitan Borough of Rotherham south of Rotherham itself. It is bordered by the constituencies of Bassetlaw, Bolsover, Derbyshire North East, Don Valley, Rotherham, Sheffield South East, and Wentworth and Dearne.
Further to the 2023 Periodic Review of Westminster constituencies, enacted by the Parliamentary Constituencies Order 2023, from the next general election, due by January 2025, the constituency will be composed of the following (as they existed on 1 December 2020):
Minor changes to reflect modification of local authority ward boundaries.
The constituency consists of Census Output Areas of one local government district: a working population whose income is on average slightly below the national average and close to average reliance upon social housing. [5] At the end of 2012 the unemployment rate in the constituency stood as 4.0% of the population claiming jobseekers allowance, compared to the regional average of 4.7%. This was considerably lower than the rate in the Rotherham constituency of 7% and 9.6% male unemployment. [6]
The borough contributing to the seat has a relatively high 26.6% of its population without a car compared to 20.1% in Bassetlaw and 30.3% in Sheffield. In terms of extremes of education 29.8% of the population in 2011 were without qualifications contrasted with 17.4% with level 4 qualifications or above.
In terms of tenure 65.2% of homes are owned outright or on a mortgage as at the 2011 census across the borough. [7] In the 10 years to the April 2011 Census the social rented sector saw a 4.9% reduction and the private rented sector a 5.3% increase; outright ownership saw a 3.8% increase. [7]
Election | Member [8] | Party | |
---|---|---|---|
1918 | Thomas Walter Grundy | Labour | |
1935 | Edward Dunn | Labour | |
1945 | David Griffiths | Labour | |
1970 | Peter Hardy | Labour | |
1983 | Sir Kevin Barron | Labour | |
2019 | Alexander Stafford | Conservative |
Party | Candidate | Votes | % | ±% | |
---|---|---|---|---|---|
Reform UK | Tony Harrison [9] | ||||
Labour | Jake Richards [10] | ||||
Majority | |||||
Turnout |
Party | Candidate | Votes | % | ±% | |
---|---|---|---|---|---|
Conservative | Alexander Stafford | 21,970 | 45.1 | 4.8 | |
Labour | Sophie Wilson | 15,652 | 32.1 | 16.0 | |
Brexit Party | Allen Cowles | 6,264 | 12.9 | New | |
Liberal Democrats | Colin Taylor | 2,553 | 5.2 | 2.9 | |
Green | Emily West | 1,219 | 2.5 | 0.7 | |
Independent | Nigel Short | 1,040 | 2.1 | New | |
Majority | 6,318 | 13.0 | N/A | ||
Turnout | 48,698 | 65.1 | 0.7 | ||
Conservative gain from Labour | Swing | 10.4 | |||
Party | Candidate | Votes | % | ±% | |
---|---|---|---|---|---|
Labour | Kevin Barron | 23,821 | 48.1 | 4.5 | |
Conservative | Bethan Eddy | 19,939 | 40.3 | 17.0 | |
UKIP | Lee Hunter | 3,704 | 7.5 | 20.6 | |
Liberal Democrats | Katie Pruszynski | 1,155 | 2.3 | 1.9 | |
Green | Paul Martin | 869 | 1.8 | New | |
Majority | 3,882 | 7.8 | 7.7 | ||
Turnout | 49,595 | 65.8 | 2.5 | ||
Labour hold | Swing | 6.3 | |||
Party | Candidate | Votes | % | ±% | |
---|---|---|---|---|---|
Labour | Kevin Barron | 20,501 | 43.6 | +2.7 | |
UKIP | Allen Cowles | 13,204 | 28.1 | +22.5 | |
Conservative | Gareth Streeter | 10,945 | 23.3 | -5.1 | |
Liberal Democrats | Robert Teal | 1,992 | 4.2 | -13.1 | |
English Democrat | Sharon Pilling | 377 | 0.8 | New | |
Majority | 7,297 | 15.5 | +3.0 | ||
Turnout | 47,019 | 63.3 | -0.9 | ||
Labour hold | Swing | -9.9 | |||
Party | Candidate | Votes | % | ±% | |
---|---|---|---|---|---|
Labour | Kevin Barron | 19,147 | 40.9 | -10.6 | |
Conservative | Lynda Donaldson | 13,281 | 28.4 | +5.3 | |
Liberal Democrats | Wesley Paxton [18] | 8,111 | 17.3 | +1.2 | |
BNP | William Blair | 3,616 | 7.7 | +2.8 | |
UKIP | Tina Dowdall | 2,613 | 5.6 | +1.3 | |
Majority | 5,866 | 12.5 | -23.5 | ||
Turnout | 46,768 | 64.2 | +6.5 | ||
Labour hold | Swing | -8.0 | |||
Party | Candidate | Votes | % | ±% | |
---|---|---|---|---|---|
Labour | Kevin Barron | 21,871 | 55.4 | -6.7 | |
Conservative | Colin Phillips | 7,647 | 19.4 | -2.3 | |
Liberal Democrats | Phil Bristow | 6,272 | 15.9 | +3.4 | |
BNP | Nick Cass | 2,020 | 5.1 | New | |
UKIP | Gordon Brown | 1,685 | 4.3 | +0.6 | |
Majority | 14,224 | 36.0 | -4.4 | ||
Turnout | 39,495 | 58.1 | +4.9 | ||
Labour hold | Swing | -2.2 | |||
Party | Candidate | Votes | % | ±% | |
---|---|---|---|---|---|
Labour | Kevin Barron | 22,851 | 62.1 | −5.5 | |
Conservative | James Duddridge | 7,969 | 21.7 | +5.0 | |
Liberal Democrats | Win Knight | 4,603 | 12.5 | +0.9 | |
UKIP | David Cutts | 1,380 | 3.7 | New | |
Majority | 14,882 | 40.4 | -10.5 | ||
Turnout | 36,803 | 53.2 | -14.1 | ||
Labour hold | Swing | ||||
Party | Candidate | Votes | % | ±% | |
---|---|---|---|---|---|
Labour | Kevin Barron | 31,184 | 67.6 | +6.1 | |
Conservative | Steven Stanbury | 7,699 | 16.7 | -10.2 | |
Liberal Democrats | Stan Burgess | 5,342 | 11.6 | -1.1 | |
Referendum | Stephen Cook | 1,932 | 4.2 | New | |
Majority | 23,485 | 50.9 | +17.3 | ||
Turnout | 46,157 | 67.3 | -7.7 | ||
Labour hold | Swing | ||||
Party | Candidate | Votes | % | ±% | |
---|---|---|---|---|---|
Labour | Kevin Barron | 30,977 | 60.5 | +4.1 | |
Conservative | G. Toby A.W. Horton | 13,755 | 26.9 | +2.0 | |
Liberal Democrats | Kevin A. Smith | 6,483 | 12.7 | −5.7 | |
Majority | 17,222 | 33.6 | +2.1 | ||
Turnout | 51,215 | 75.0 | −0.6 | ||
Labour hold | Swing | +1.1 | |||
Party | Candidate | Votes | % | ±% | |
---|---|---|---|---|---|
Labour | Kevin Barron | 28,292 | 56.4 | +9.9 | |
Conservative | Paul Rayner | 12,502 | 24.9 | -3.2 | |
SDP | John Boddy | 9,240 | 18.4 | -7.0 | |
Workers Revolutionary | Michael Driver | 145 | 0.3 | New | |
Majority | 15,790 | 31.5 | +13.1 | ||
Turnout | 50,179 | 75.6 | +3.7 | ||
Labour hold | Swing | ||||
Party | Candidate | Votes | % | ±% | |
---|---|---|---|---|---|
Labour | Kevin Barron | 21,781 | 46.5 | ||
Conservative | John Derrick | 13,156 | 28.1 | ||
SDP | John Boddy | 11,903 | 25.4 | ||
Majority | 8,625 | 18.4 | |||
Turnout | 46,840 | 71.9 | |||
Labour hold | Swing | ||||
Party | Candidate | Votes | % | ±% | |
---|---|---|---|---|---|
Labour | Peter Hardy | 45,986 | 62.2 | -5.1 | |
Conservative | R. Barber | 19,984 | 27.0 | +9.1 | |
Liberal | C. Sykes | 7,937 | 10.7 | -4.1 | |
Majority | 26,002 | 35.2 | -14.2 | ||
Turnout | 73,907 | 74.6 | +2.4 | ||
Labour hold | Swing | ||||
Party | Candidate | Votes | % | ±% | |
---|---|---|---|---|---|
Labour | Peter Hardy | 44,670 | 67.3 | -6.1 | |
Conservative | Gary Waller | 11,893 | 17.9 | -8.7 | |
Liberal | Geoffrey Reid | 9,828 | 14.8 | New | |
Majority | 32,777 | 49.4 | +2.6 | ||
Turnout | 66,391 | 72.2 | -6.4 | ||
Labour hold | Swing | ||||
Party | Candidate | Votes | % | ±% | |
---|---|---|---|---|---|
Labour | Peter Hardy | 52,532 | 73.4 | +1.6 | |
Conservative | Gary Waller | 19,058 | 26.6 | -1.6 | |
Majority | 33,474 | 46.8 | +3.2 | ||
Turnout | 71,590 | 78.6 | +8.0 | ||
Labour hold | Swing | ||||
Party | Candidate | Votes | % | ±% | |
---|---|---|---|---|---|
Labour | Peter Hardy | 44,322 | 71.8 | -5.0 | |
Conservative | Tony Durant | 17,418 | 28.2 | +5.0 | |
Majority | 26,904 | 43.6 | -10.0 | ||
Turnout | 61,740 | 70.6 | -2.9 | ||
Labour hold | Swing | ||||
Party | Candidate | Votes | % | ±% | |
---|---|---|---|---|---|
Labour | David Griffiths | 43,634 | 76.82 | +2.40 | |
Conservative | J Michael Clarke | 13,167 | 23.18 | -2.40 | |
Majority | 30,467 | 53.64 | +4.80 | ||
Turnout | 56,801 | 73.46 | +3.93 | ||
Labour hold | Swing | +2.40 | |||
Party | Candidate | Votes | % | ±% | |
---|---|---|---|---|---|
Labour | David Griffiths | 43,101 | 74.4 | +0.3 | |
Conservative | Raymond Whitley Hadfield | 14,813 | 25.6 | -0.3 | |
Majority | 28,288 | 48.8 | +0.6 | ||
Turnout | 57,914 | 77.4 | -5.4 | ||
Labour hold | Swing | ||||
Party | Candidate | Votes | % | ±% | |
---|---|---|---|---|---|
Labour | David Griffiths | 43,962 | 74.1 | -1.5 | |
Conservative | William Albert V Hoskins | 15,369 | 25.9 | +1.5 | |
Majority | 28,593 | 48.2 | -3.0 | ||
Turnout | 59,331 | 82.8 | +4.0 | ||
Labour hold | Swing | ||||
Party | Candidate | Votes | % | ±% | |
---|---|---|---|---|---|
Labour | David Griffiths | 39,968 | 75.6 | -0.1 | |
Conservative | William Albert V Hoskins | 12,916 | 24.4 | +0.1 | |
Majority | 27,052 | 51.2 | -0.2 | ||
Turnout | 52,884 | 78.8 | -7.5 | ||
Labour hold | Swing | ||||
Party | Candidate | Votes | % | ±% | |
---|---|---|---|---|---|
Labour | David Griffiths | 41,990 | 75.7 | -0.9 | |
Conservative | Ronald Hall | 13,470 | 24.3 | +0.9 | |
Majority | 28,520 | 51.4 | -1.8 | ||
Turnout | 55,460 | 86.3 | -1.1 | ||
Labour hold | Swing | ||||
Party | Candidate | Votes | % | ±% | |
---|---|---|---|---|---|
Labour | David Griffiths | 42,222 | 76.6 | +1.4 | |
Conservative | William Robert Ackrill Breare | 12,887 | 23.4 | -1.4 | |
Majority | 29,335 | 53.2 | +2.8 | ||
Turnout | 55,109 | 87.4 | +12.2 | ||
Labour hold | Swing | ||||
Party | Candidate | Votes | % | ±% | |
---|---|---|---|---|---|
Labour | David Griffiths | 44,449 | 75.2 | +3.2 | |
Conservative | J. Howard Bull | 14,669 | 24.8 | -3.2 | |
Majority | 29,830 | 50.4 | +6.4 | ||
Turnout | 59,118 | 75.2 | +1.4 | ||
Labour hold | Swing | ||||
Party | Candidate | Votes | % | ±% | |
---|---|---|---|---|---|
Labour | Edward Dunn | 33,271 | 72.0 | +9.7 | |
Conservative | Alwyne Gervase Olliver | 12,907 | 28.0 | -9.7 | |
Majority | 20,364 | 44.0 | +19.4 | ||
Turnout | 46,178 | 73.8 | -3.7 | ||
Labour hold | Swing | ||||
Party | Candidate | Votes | % | ±% | |
---|---|---|---|---|---|
Labour | Thomas Walter Grundy | 26,185 | 62.3 | -14.0 | |
Conservative | Alwyne Gervase Olliver [27] | 15,812 | 37.7 | +14.0 | |
Majority | 10,373 | 24.6 | -28.0 | ||
Turnout | 41,997 | 77.5 | -0.3 | ||
Labour hold | Swing | ||||
Party | Candidate | Votes | % | ±% | |
---|---|---|---|---|---|
Labour | Thomas Walter Grundy | 30,405 | 76.3 | +11.0 | |
Unionist | Cecil Pike | 9,460 | 23.7 | -11.0 | |
Majority | 20,945 | 52.6 | +22.0 | ||
Turnout | 39,865 | 77.8 | +1.9 | ||
Labour hold | Swing | +11.0 | |||
Party | Candidate | Votes | % | ±% | |
---|---|---|---|---|---|
Labour | Thomas Walter Grundy | 18,750 | 65.3 | -3.3 | |
Unionist | Frances R. Wade | 9,985 | 34.7 | +3.3 | |
Majority | 8,765 | 30.6 | -6.6 | ||
Turnout | 28,735 | 75.9 | +11.9 | ||
Labour hold | Swing | ||||
Party | Candidate | Votes | % | ±% | |
---|---|---|---|---|---|
Labour | Thomas Walter Grundy | 15,967 | 68.6 | N/A | |
Unionist | Frances R. Wade | 7,323 | 31.4 | New | |
Majority | 8,644 | 37.2 | N/A | ||
Turnout | 39,865 | 64.0 | N/A | ||
Labour hold | Swing | ||||
Party | Candidate | Votes | % | ±% | |
---|---|---|---|---|---|
Labour | Thomas Walter Grundy | Unopposed | N/A | N/A | |
Labour hold | Swing | N/A | |||
Party | Candidate | Votes | % | ±% | |
---|---|---|---|---|---|
Labour | Thomas Walter Grundy | 9,917 | 55.1 | ||
C | National Democratic | Ernest George Bearcroft | 4,894 | 27.2 | |
Liberal | Albert Edward Mann Turner | 3,177 | 17.7 | ||
Majority | 5,023 | 27.9 | |||
Turnout | 17,988 | 56.3 | |||
Labour win (new seat) | |||||
Cindicates candidate endorsed by the coalition government. |
Anston is a civil parish in South Yorkshire, England, formally known as North and South Anston. The parish of Anston consists of the settlements of North Anston and South Anston, divided by the Anston Brook.
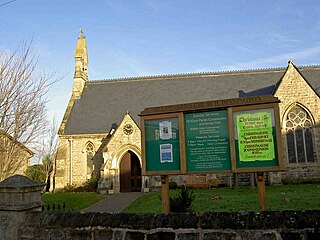
Dinnington is a town in the civil parish of Dinnington St John's, in the Metropolitan Borough of Rotherham, in South Yorkshire, England. It is near to the towns of Worksop and Rotherham and cities of Sheffield and Doncaster.
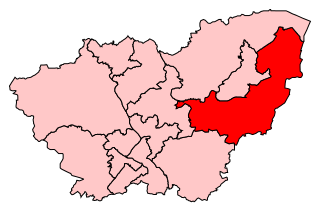
Sir Kevin John Barron is a British Labour Party politician and former coal industry worker. He was the Member of Parliament (MP) for Rother Valley from 1983 until 2019.
The Metropolitan Borough of Rotherham is a metropolitan borough of South Yorkshire, England. It is named after its main settlement of Rotherham. The wider borough spans a larger area and covers the outlying towns of Maltby, Swinton, Wath-upon-Dearne, Dinnington. As well as the villages of Rawmarsh and Laughton. A large valley spans the entire borough and is referred to as the "Rother Valley".
Maltby is a former mining town and civil parish in the Metropolitan Borough of Rotherham, South Yorkshire, England. It was historically in the West Riding of Yorkshire. It is located 6 miles (10 km) east of Rotherham and 10 miles (16 km) north-east of Sheffield. It forms a continuous urban area with Hellaby, separated from the rest of Rotherham by the M18 motorway. It had a population of 16,688 at the 2011 Census.
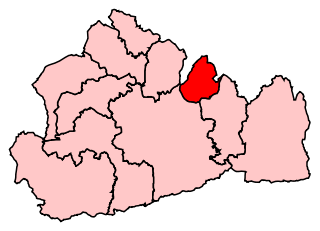
Epsom and Ewell is a constituency in Surrey represented in the House of Commons of the UK Parliament since 2001 by Chris Grayling, a Conservative.
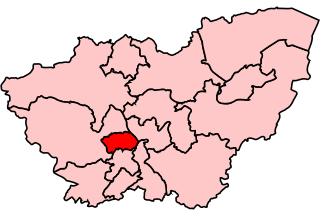
Sheffield, Brightside was a parliamentary constituency in the City of Sheffield. Created for the 1885 general election, and replaced at the 2010 general election by the new constituency of Sheffield Brightside and Hillsborough, it elected one Member of Parliament (MP) to the House of Commons of the Parliament of the United Kingdom, using the first-past-the-post voting system.
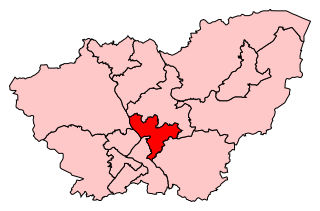
Sheffield Attercliffe was a parliamentary constituency in the City of Sheffield. It was created at the 1885 general election and abolished at the 2010 general election, when it was replaced by a new Sheffield South East constituency.
Rotherham is a constituency represented in the House of Commons of the UK Parliament since 2012 by Sarah Champion, a member of the Labour Party.
Don Valley is a constituency in South Yorkshire represented in the House of Commons of the UK Parliament since 2019 by Nick Fletcher of the Conservative Party.
Wentworth was a parliamentary constituency in South Yorkshire. Originally created in 1918 and was abolished in 1950, the name was revived when a new constituency was created from 1983 to 2010. Throughout its history, Wentworth was a safe seat for the Labour Party.
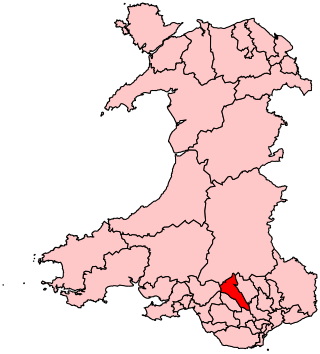
Cynon Valley is a constituency in Wales represented in the House of Commons of the UK Parliament since 2019 by Beth Winter of the Labour Party.
Merthyr Tydfil and Rhymney is a constituency represented in the House of Commons of the UK Parliament since 2015 by Gerald Jones of the Welsh Labour Party. It was established for the 1983 general election.
Bassetlaw is a parliamentary constituency in Nottinghamshire, represented in the House of Commons of the UK Parliament since the 2019 general election by Brendan Clarke-Smith, a Conservative. Before that election, the seat had been part of the so-called "red wall", being held by the Labour Party since 1935.
Bexhill and Battle is a constituency in East Sussex represented in the House of Commons of the UK Parliament since 2015 by Huw Merriman of the Conservative Party.
Hastings and Rye is a constituency in East Sussex represented in the House of Commons of the UK Parliament since 2019 by Sally-Ann Hart of the Conservative Party. From 2010 until 2019, it was represented by Amber Rudd, who served as Secretary of State for Energy and Climate Change, Minister for Women and Equalities, Secretary of State for the Home Department and Secretary of State for Work and Pensions under the governments of David Cameron, Theresa May and Boris Johnson.
East Hampshire is a constituency represented in the House of Commons of the UK Parliament since 2010 by Damian Hinds of the Conservative Party.
Rotherham Metropolitan Borough Council is the local authority for Rotherham in South Yorkshire, England. The council is elected every four years. Since the last boundary changes in 2004, 63 councillors have been elected from 21 wards.