Huddersfield | |
---|---|
Borough constituency for the House of Commons | |
County | West Yorkshire |
Electorate | 65,917 (December 2019) [1] |
Major settlements | Huddersfield, Kirkheaton |
Current constituency | |
Created | 1983 |
Member of Parliament | Barry Sheerman (Labour Co-op) |
Seats | One |
Created from | Huddersfield East Huddersfield West |
1832–1950 | |
Seats | One |
Type of constituency | Borough constituency |
Created from | Yorkshire |
Replaced by | Huddersfield East Huddersfield West |
Huddersfield is a constituency [n 1] in West Yorkshire represented in the House of Commons of the UK Parliament since 1983 by Barry Sheerman of Labour Co-op. [n 2]
1983–2010: The Borough of Kirklees wards of Almondbury, Birkby, Dalton, Deighton, Newsome, and Paddock.
2010–present: The Borough of Kirklees wards of Almondbury, Ashbrow, Dalton, Greenhead, and Newsome.
Further to the 2023 Periodic Review of Westminster constituencies, enacted by the Parliamentary Constituencies Order 2023, from the 2024 general election the constituency will be composed of the following (as they existed on 1 December 2020):
In order to bring the electorate within the permitted range, the Crosland Moor and Netherton ward will be transferred from Colne Valley. To partly compensate, a small part of the Dalton ward, including the village of Kirkheaton will be transferred to the re-established constituency of Spen Valley.
This constituency covers the urban centre and east of the West Yorkshire town of Huddersfield, the administrative centre of the Metropolitan Borough of Kirklees. The town grew out of the former woollen industry, and is now a primarily residential market town with some light industry remaining in the town such as Syngenta and Cummins, and a growing number of students at the University of Huddersfield. The town is economically diverse with some deprived inner-city council estates, such as Deighton, and better-off areas on the outskirts, such as Fixby, some exclusive detached stone houses in leafy roads.
However, the town’s western suburbs such as Crosland Moor, Netherton, Golcar, and the middle-class suburb of Lindley are actually in the neighbouring Colne Valley constituency.
Apart from four years tenure as MP by Geoffrey Dickens for Huddersfield West (1979-1983), the area (including its divided halves for the 33 years to 1983) has returned a Labour Party MP since 1945.
The constituency is currently held by the Labour Party, although the Liberal Democrats made inroads by coming second in the 2005 general election, and in the 2010 general election Karen Tween of the Conservative Party narrowed the incumbent's lead to a relatively average 4,472 votes and the new Liberal Democrat candidate slipped into third place. There are currently Green Party councillors in Newsome, and some Tory and Liberal Democrat councillors in Almondbury, but the remaining wards are safely Labour. The Dalton ward also includes the village of Kirkheaton, separated by a green buffer, and the Almondbury ward includes the small village of Lepton, West Yorkshire.
Party | Candidate | Votes | % | ±% | |
---|---|---|---|---|---|
Green | Andrew Cooper [18] | ||||
Workers Party | Garry Johnson [19] | ||||
Reform UK | Susan Laird [20] | ||||
Labour | Harpreet Uppal [21] | ||||
Majority | |||||
Turnout |
Party | Candidate | Votes | % | ±% | |
---|---|---|---|---|---|
Labour Co-op | Barry Sheerman | 20,509 | 49.0 | 11.4 | |
Conservative | Ken Davy | 15,572 | 37.2 | 4.2 | |
Liberal Democrats | James Wilkinson | 2,367 | 5.7 | 3.1 | |
Green | Andrew Cooper | 1,768 | 4.2 | 1.0 | |
Brexit Party | Stuart Hale | 1,666 | 4.0 | New | |
Majority | 4,937 | 11.8 | 15.6 | ||
Turnout | 41,882 | 63.9 | 1.6 | ||
Labour Co-op hold | Swing | 7.8 | |||
Party | Candidate | Votes | % | ±% | |
---|---|---|---|---|---|
Labour Co-op | Barry Sheerman | 26,470 | 60.4 | +15.5 | |
Conservative | Scott Benton | 14,465 | 33.0 | +6.2 | |
Green | Andrew Cooper | 1,395 | 3.2 | -3.7 | |
Liberal Democrats | Zulfiqar Ali | 1,155 | 2.6 | -3.2 | |
Yorkshire | Bikatshi Katenga | 274 | 0.6 | New | |
Independent | Marteen Thokkudubiyyapu | 75 | 0.2 | New | |
Majority | 12,005 | 27.4 | +9.3 | ||
Turnout | 43,834 | 65.5 | +3.5 | ||
Labour Co-op hold | Swing | +4.7 | |||
Party | Candidate | Votes | % | ±% | |
---|---|---|---|---|---|
Labour Co-op | Barry Sheerman | 18,186 | 44.9 | +6.1 | |
Conservative | Itrat Ali | 10,841 | 26.8 | -1.0 | |
UKIP | Rob Butler | 5,948 | 14.7 | New | |
Green | Andrew Cooper | 2,798 | 6.9 | +2.9 | |
Liberal Democrats | Zulfiqar Ali | 2,365 | 5.8 | -18.9 | |
TUSC | Mike Forster | 340 | 0.8 | 0.0 | |
Majority | 7,345 | 18.1 | +7.1 | ||
Turnout | 40,478 | 62.0 | +0.9 | ||
Labour Co-op hold | Swing | ||||
Party | Candidate | Votes | % | ±% | |
---|---|---|---|---|---|
Labour Co-op | Barry Sheerman | 15,725 | 38.8 | -7.6 | |
Conservative | Karen Tweed | 11,253 | 27.8 | +6.7 | |
Liberal Democrats | James Blanchard | 10,023 | 24.7 | +0.6 | |
Green | Andrew Cooper | 1,641 | 4.0 | -0.6 | |
BNP | Rachel Firth | 1,563 | 3.9 | +0.9 | |
TUSC | Paul Cooney [28] | 319 | 0.8 | New | |
Majority | 4,472 | 11.0 | |||
Turnout | 40,524 | 61.1 | +4.5 | ||
Labour Co-op hold | Swing | −7.1 | |||
Party | Candidate | Votes | % | ±% | |
---|---|---|---|---|---|
Labour Co-op | Barry Sheerman | 16,341 | 46.8 | −6.4 | |
Liberal Democrats | Emma Bone | 7,990 | 22.9 | +7.9 | |
Conservative | David Meacock | 7,597 | 21.7 | −3.2 | |
Green | Julie Stewart-Turner | 1,651 | 4.7 | +1.2 | |
BNP | Karl Hanson | 1,036 | 3.0 | New | |
Independent | Theresa Quarmby | 325 | 0.9 | New | |
Majority | 8,351 | 23.9 | -4.4 | ||
Turnout | 34,940 | 56.6 | +1.6 | ||
Labour Co-op hold | Swing | −7.1 | |||
Party | Candidate | Votes | % | ±% | |
---|---|---|---|---|---|
Labour Co-op | Barry Sheerman | 18,840 | 53.2 | −3.3 | |
Conservative | Paul Baverstock | 8,794 | 24.9 | +4.0 | |
Liberal Democrats | Neil Bentley | 5,300 | 15.0 | −2.2 | |
Green | John Phillips | 1,254 | 3.5 | +1.3 | |
UKIP | Judith Longman | 613 | 1.7 | New | |
Socialist Alliance | Graham Hellawell | 374 | 1.1 | New | |
Socialist Labour | George Randall | 208 | 0.6 | New | |
Majority | 10,046 | 28.3 | -7.3 | ||
Turnout | 35,383 | 55.0 | −12.0 | ||
Labour Co-op hold | Swing | ||||
Party | Candidate | Votes | % | ±% | |
---|---|---|---|---|---|
Labour Co-op | Barry Sheerman | 25,171 | 56.5 | ||
Conservative | Bill Forrow | 9,323 | 20.9 | ||
Liberal Democrats | Gordon Beever | 7,642 | 17.2 | ||
Referendum | Paul McNulty | 1,480 | 3.3 | New | |
Green | John Phillips | 938 | 2.1 | N/A | |
Majority | 15,848 | 35.6 | |||
Turnout | 44,554 | 67.0 | |||
Labour Co-op hold | Swing | ||||
Party | Candidate | Votes | % | ±% | |
---|---|---|---|---|---|
Labour Co-op | Barry Sheerman | 23,832 | 48.7 | +2.8 | |
Conservative | JM Kenyon | 16,574 | 33.9 | +2.5 | |
Liberal Democrats | AE Denham | 7,777 | 15.9 | −5.6 | |
Green | Nicholas Harvey | 576 | 1.2 | −0.1 | |
Natural Law | M Cran | 135 | 0.3 | New | |
Majority | 7,258 | 14.8 | +0.3 | ||
Turnout | 48,894 | 72.4 | −3.1 | ||
Labour Co-op hold | Swing | +0.2 | |||
Party | Candidate | Votes | % | ±% | |
---|---|---|---|---|---|
Labour Co-op | Barry Sheerman | 23,019 | 45.9 | +4.5 | |
Conservative | Nick Hawkins | 15,741 | 31.4 | -1.8 | |
Liberal | John Smithson | 10,773 | 21.5 | -3.3 | |
Green | Nicholas Harvey | 638 | 1.3 | New | |
Majority | 7,278 | 14.5 | +6.3 | ||
Turnout | 50,171 | 75.5 | +4.4 | ||
Labour Co-op hold | Swing | +3.1 | |||
Party | Candidate | Votes | % | ±% | |
---|---|---|---|---|---|
Labour Co-op | Barry Sheerman | 20,051 | 41.4 | ||
Conservative | John Tweddle | 16,096 | 33.2 | ||
Liberal | Kathleen Hasler | 12,027 | 24.8 | ||
Independent | H Hirst | 271 | 0.6 | ||
Majority | 3,955 | 8.2 | |||
Turnout | 48,445 | 71.1 | |||
Labour Co-op win (new seat) |
Party | Candidate | Votes | % | ±% | |
---|---|---|---|---|---|
Labour | Joseph Mallalieu | 33,362 | 48.3 | +9.1 | |
National Liberal | William Mabane | 24,496 | 35.5 | -25.3 | |
Liberal | Roy Harrod | 11,119 | 16.2 | New | |
Majority | 8,866 | 12.8 | N/A | ||
Turnout | 68,977 | 78.4 | +5.2 | ||
Labour gain from National Liberal | Swing | +17.2 | |||
General Election 1939–40:
Another general election was required to take place before the end of 1940. The political parties had been making preparations for an election to take place from 1939 and by the end of this year, the following candidates had been selected;
Party | Candidate | Votes | % | ±% | |
---|---|---|---|---|---|
National Liberal | William Mabane | 37,009 | 60.8 | -9.3 | |
Labour | William Pickles | 23,844 | 39.2 | +9.3 | |
Majority | 13,165 | 21.6 | -18.6 | ||
Turnout | 60,853 | 73.2 | -10.1 | ||
National Liberal hold | Swing | -9.3 | |||
Party | Candidate | Votes | % | ±% | |
---|---|---|---|---|---|
National Liberal | William Mabane | 47,056 | 70.1 | +38.5 | |
Labour | James Hudson | 20,034 | 29.9 | -8.4 | |
Majority | 27,022 | 40.2 | N/A | ||
Turnout | 67,090 | 83.3 | -2.8 | ||
National Liberal gain from Labour | Swing | +23.5 | |||
Party | Candidate | Votes | % | ±% | |
---|---|---|---|---|---|
Labour | James Hudson | 25,966 | 38.3 | +2.0 | |
Liberal | William Mabane | 21,398 | 31.6 | −0.1 | |
Unionist | Enoch Hill | 20,361 | 30.1 | −1.9 | |
Majority | 4,568 | 6.7 | +2.4 | ||
Turnout | 67,725 | 86.1 | −2.4 | ||
Registered electors | 78,635 | ||||
Labour hold | Swing | +1.0 | |||
Party | Candidate | Votes | % | ±% | |
---|---|---|---|---|---|
Labour | James Hudson | 19,010 | 36.3 | −0.4 | |
Unionist | Enoch Hill | 16,745 | 32.0 | +5.3 | |
Liberal | Arthur Marshall | 16,626 | 31.7 | −4.9 | |
Majority | 2,265 | 4.3 | +4.2 | ||
Turnout | 52,381 | 88.5 | +6.6 | ||
Registered electors | 59,176 | ||||
Labour hold | Swing | −2.8 | |||
Party | Candidate | Votes | % | ±% | |
---|---|---|---|---|---|
Labour | James Hudson | 17,430 | 36.7 | +3.2 | |
Liberal | Arthur Marshall | 17,404 | 36.6 | +2.6 | |
Unionist | Charles Tinker | 12,694 | 26.7 | New | |
Majority | 26 | 0.1 | N/A | ||
Turnout | 47,528 | 81.9 | −1.2 | ||
Registered electors | 58,029 | ||||
Labour gain from Liberal | Swing | +0.3 | |||
Party | Candidate | Votes | % | ±% | |
---|---|---|---|---|---|
Liberal | Arthur Marshall | 15,879 | 34.0 | +5.3 | |
Labour | James Hudson | 15,673 | 33.5 | +1.0 | |
National Liberal | Charles Sykes | 15,212 | 32.5 | −6.3 | |
Majority | 206 | 0.5 | N/A | ||
Turnout | 46,764 | 83.1 | +13.3 | ||
Registered electors | 56,243 | ||||
Liberal gain from National Liberal | Swing | +5.8 | |||
Party | Candidate | Votes | % | ±% | |
---|---|---|---|---|---|
C | National Liberal | Charles Sykes | 15,234 | 38.8 | N/A |
Labour | Harry Snell | 12,737 | 32.5 | +3.5 | |
Liberal | Ernest Woodhead | 11,256 | 28.7 | −8.8 | |
Majority | 2,497 | 6.3 | N/A | ||
Turnout | 39,227 | 69.8 | −20.7 | ||
Registered electors | 56,200 | ||||
National Liberal gain from Liberal | Swing | ||||
Cindicates candidate endorsed by the coalition government. |
General Election 1914–15:
Another General Election was required to take place before the end of 1915. The political parties had been making preparations for an election to take place and by July 1914, the following candidates had been selected;
Party | Candidate | Votes | % | ±% | |
---|---|---|---|---|---|
Liberal | Arthur Sherwell | 6,458 | 37.5 | −2.3 | |
Conservative | Joseph Henry Kaye | 5,777 | 33.5 | +4.9 | |
Labour | Harry Snell | 4,988 | 29.0 | −2.6 | |
Majority | 681 | 4.0 | −4.2 | ||
Turnout | 17,223 | 90.5 | −4.1 | ||
Registered electors | 19,021 | ||||
Liberal hold | Swing | −3.6 | |||
Party | Candidate | Votes | % | ±% | |
---|---|---|---|---|---|
Liberal | Arthur Sherwell | 7,158 | 39.8 | +1.6 | |
Labour | Harry Snell | 5,686 | 31.6 | −3.6 | |
Conservative | Harold Smith | 5,153 | 28.6 | +2.0 | |
Majority | 1,472 | 8.2 | +5.2 | ||
Turnout | 17,997 | 94.6 | +0.6 | ||
Registered electors | 19,021 | ||||
Liberal hold | Swing | +2.6 | |||
Party | Candidate | Votes | % | ±% | |
---|---|---|---|---|---|
Liberal | Arthur Sherwell | 5,762 | 36.0 | −2.2 | |
Labour | T. Russell Williams | 5,422 | 33.8 | −1.4 | |
Conservative | John Foster Fraser | 4,844 | 30.2 | +3.6 | |
Majority | 340 | 2.2 | −0.8 | ||
Turnout | 16,028 | 91.2 | −2.8 | ||
Registered electors | 17,568 | ||||
Liberal hold | Swing | +0.4 | |||
Party | Candidate | Votes | % | ±% | |
---|---|---|---|---|---|
Liberal | James Woodhouse | 6,302 | 38.2 | −15.4 | |
Labour Repr. Cmte. | T. Russell Williams | 5,813 | 35.2 | New | |
Conservative | John Foster Fraser | 4,391 | 26.6 | −19.8 | |
Majority | 489 | 3.0 | −4.2 | ||
Turnout | 16,506 | 94.0 | +6.2 | ||
Registered electors | 17,568 | ||||
Liberal hold | Swing | +2.2 | |||
Party | Candidate | Votes | % | ±% | |
---|---|---|---|---|---|
Liberal | James Woodhouse | 7,896 | 53.6 | +6.1 | |
Conservative | Hildred Carlile | 6,831 | 46.4 | +5.1 | |
Majority | 1,065 | 7.2 | +1.0 | ||
Turnout | 14,727 | 87.8 | −2.0 | ||
Registered electors | 16,770 | ||||
Liberal hold | Swing | +0.5 | |||
Party | Candidate | Votes | % | ±% | |
---|---|---|---|---|---|
Liberal | James Woodhouse | 6,755 | 47.5 | −3.4 | |
Conservative | Joseph Crosland | 5,868 | 41.3 | −7.8 | |
Ind. Labour Party | Russell Smart | 1,594 | 11.2 | New | |
Majority | 887 | 6.2 | +4.4 | ||
Turnout | 14,217 | 89.8 | −0.3 | ||
Registered electors | 15,832 | ||||
Liberal hold | Swing | +2.2 | |||
Party | Candidate | Votes | % | ±% | |
---|---|---|---|---|---|
Conservative | Joseph Crosland | 7,068 | 50.1 | +1.0 | |
Liberal | Joseph Woodhead | 7,033 | 49.9 | −1.0 | |
Majority | 35 | 0.2 | N/A | ||
Turnout | 14,101 | 90.7 | +0.6 | ||
Registered electors | 15,550 | ||||
Conservative gain from Liberal | Swing | +1.0 | |||
Party | Candidate | Votes | % | ±% | |
---|---|---|---|---|---|
Liberal | William Summers | 7,098 | 50.9 | +0.1 | |
Conservative | Joseph Crosland | 6,837 | 49.1 | −0.1 | |
Majority | 261 | 1.8 | +0.2 | ||
Turnout | 13,935 | 90.1 | +8.5 | ||
Registered electors | 15,466 | ||||
Liberal hold | Swing | +0.1 | |||
Party | Candidate | Votes | % | ±% | |
---|---|---|---|---|---|
Liberal | William Summers | 6,210 | 50.8 | -2.1 | |
Conservative | Joseph Crosland | 6,026 | 49.2 | +2.1 | |
Majority | 184 | 1.6 | -4.2 | ||
Turnout | 12,236 | 81.6 | −6.1 | ||
Registered electors | 14,991 | ||||
Liberal hold | Swing | -2.1 | |||
Party | Candidate | Votes | % | ±% | |
---|---|---|---|---|---|
Liberal | Edward Leatham | 6,960 | 52.9 | −8.1 | |
Conservative | Joseph Crosland | 6,194 | 47.1 | +8.1 | |
Majority | 766 | 5.8 | −16.2 | ||
Turnout | 13,154 | 87.7 | +1.8 | ||
Registered electors | 14,991 | ||||
Liberal hold | Swing | −8.1 | |||
Party | Candidate | Votes | % | ±% | |
---|---|---|---|---|---|
Liberal | Edward Leatham | 7,008 | 61.0 | +7.8 | |
Conservative | William Alexander Lindsay [38] | 4,486 | 39.0 | −7.8 | |
Majority | 2,522 | 22.0 | +15.6 | ||
Turnout | 11,494 | 85.9 | −3.5 | ||
Registered electors | 13,386 | ||||
Liberal hold | Swing | +7.8 | |||
Party | Candidate | Votes | % | ±% | |
---|---|---|---|---|---|
Liberal | Edward Leatham | 5,668 | 53.2 | N/A | |
Conservative | Thomas Brooke [39] | 4,985 | 46.8 | New | |
Majority | 683 | 6.4 | N/A | ||
Turnout | 10,653 | 89.4 | N/A | ||
Registered electors | 11,917 | ||||
Liberal hold | Swing | N/A | |||
Party | Candidate | Votes | % | ±% | |
---|---|---|---|---|---|
Liberal | Edward Leatham | Unopposed | |||
Registered electors | 11,242 | ||||
Liberal hold | |||||
Party | Candidate | Votes | % | ±% | |
---|---|---|---|---|---|
Liberal | Edward Leatham | 1,111 | 58.5 | +14.9 | |
Conservative | William Campbell Sleigh | 789 | 41.5 | New | |
Majority | 322 | 17.0 | +4.2 | ||
Turnout | 1,900 | 88.9 | +4.4 | ||
Registered electors | 2,138 | ||||
Liberal hold | Swing | N/A | |||
Party | Candidate | Votes | % | ±% | |
---|---|---|---|---|---|
Liberal | Thomas Crosland | 1,019 | 56.4 | +7.0 | |
Liberal | Edward Leatham | 787 | 43.6 | −7.0 | |
Majority | 232 | 12.8 | +11.6 | ||
Turnout | 1,806 | 84.5 | −8.2 | ||
Registered electors | 2,138 | ||||
Liberal hold | Swing | +7.0 | |||
Party | Candidate | Votes | % | ±% | |
---|---|---|---|---|---|
Liberal | Edward Leatham | 779 | 50.6 | +8.8 | |
Liberal | Edward Akroyd | 760 | 49.4 | −8.8 | |
Majority | 19 | 1.2 | −14.2 | ||
Turnout | 1,539 | 92.7 | +1.7 | ||
Registered electors | 1,660 | ||||
Liberal hold | Swing | +8.8 | |||
Party | Candidate | Votes | % | ±% | |
---|---|---|---|---|---|
Whig | Edward Akroyd | 823 | 58.2 | +6.8 | |
Radical | Richard Cobden | 590 | 41.8 | −6.8 | |
Majority | 233 | 16.4 | +13.6 | ||
Turnout | 1,413 | 91.0 | +1.9 | ||
Registered electors | 1,552 | ||||
Whig hold | Swing | +6.8 | |||
Party | Candidate | Votes | % | ±% | |
---|---|---|---|---|---|
Whig | George Robinson | 675 | 53.2 | +1.8 | |
Radical | Joseph Starkey [15] [40] | 593 | 46.8 | −1.8 | |
Majority | 82 | 6.4 | +3.6 | ||
Turnout | 1,268 | 89.6 | +0.5 | ||
Registered electors | 1,415 | ||||
Whig hold | Swing | +1.8 | |||
Party | Candidate | Votes | % | ±% | |
---|---|---|---|---|---|
Whig | William Crompton-Stansfield | 625 | 51.4 | −0.4 | |
Radical | William Willans [42] [43] | 590 | 48.6 | +0.4 | |
Majority | 35 | 2.8 | −0.8 | ||
Turnout | 1,215 | 89.1 | +0.4 | ||
Registered electors | 1,364 | ||||
Whig hold | Swing | −0.4 | |||
Party | Candidate | Votes | % | ±% | |
---|---|---|---|---|---|
Whig | William Crompton-Stansfield | 525 | 51.8 | N/A | |
Radical | John Cheetham (Huddersfield MP) | 488 | 48.2 | N/A | |
Majority | 37 | 3.6 | N/A | ||
Turnout | 1,013 | 88.7 | N/A | ||
Registered electors | 1,142 | ||||
Whig hold | Swing | N/A | |||
Party | Candidate | Votes | % | ±% | |
---|---|---|---|---|---|
Whig | William Crompton-Stansfield | Unopposed | |||
Registered electors | 1,003 | ||||
Whig hold | |||||
Party | Candidate | Votes | % | ±% | |
---|---|---|---|---|---|
Whig | William Crompton-Stansfield | 323 | 51.8 | −17.1 | |
Conservative | Richard Oastler | 301 | 48.2 | N/A | |
Majority | 22 | 3.6 | −34.2 | ||
Turnout | 624 | 78.0 | +25.8 | ||
Registered electors | 800 | ||||
Whig hold | Swing | ||||
Party | Candidate | Votes | % | ±% | |
---|---|---|---|---|---|
Whig | Edward Ellice | 340 | 54.0 | −14.9 | |
Conservative | Richard Oastler | 290 | 46.0 | New | |
Majority | 50 | 8.0 | −29.8 | ||
Turnout | 630 | 78.8 | +26.6 | ||
Registered electors | 800 | ||||
Whig hold | Swing | ||||
Party | Candidate | Votes | % | ±% | |
---|---|---|---|---|---|
Whig | John Blackburne (Huddersfield MP) | 241 | 68.9 | +5.5 | |
Radical | William Augustus Johnson [44] | 109 | 31.1 | −5.5 | |
Majority | 132 | 37.8 | +11.0 | ||
Turnout | 350 | 52.2 | −16.1 | ||
Registered electors | 671 | ||||
Whig hold | Swing | +5.5 | |||
Party | Candidate | Votes | % | ±% | |
---|---|---|---|---|---|
Whig | John Blackburne (Huddersfield MP) | 234 | 47.8 | −15.6 | |
Tory | Michael Thomas Sadler | 147 | 30.0 | New | |
Radical | Joseph Wood | 108 | 22.0 | −14.6 | |
Whig | John Charles Ramsden | 1 | 0.2 | N/A | |
Majority | 87 | 17.8 | −9.0 | ||
Turnout | 490 | 81.1 | +12.8 | ||
Registered electors | 640 | ||||
Whig hold | Swing | −0.5 | |||
Party | Candidate | Votes | % | ||
---|---|---|---|---|---|
Whig | Lewis Fenton | 263 | 63.4 | ||
Radical | Joseph Wood | 152 | 36.6 | ||
Majority | 111 | 26.8 | |||
Turnout | 415 | 68.3 | |||
Registered electors | 608 | ||||
Whig win (new seat) |
Lewes is a constituency in East Sussex represented in the House of Commons of the UK Parliament since 2015 by Maria Caulfield, a Conservative.
The City of Chester is a constituency represented in the House of Commons of the UK Parliament since 2 December 2022 by Samantha Dixon of the Labour Party. She was elected in the by-election held following the resignation of Chris Matheson MP on 21 October 2022.
Stockport is a constituency represented in the House of Commons of the UK Parliament since 2019 by Navendu Mishra of the Labour Party.
Birkenhead is a constituency in Merseyside represented in the House of Commons of the UK Parliament since 2019 by Mick Whitley of the Labour Party.
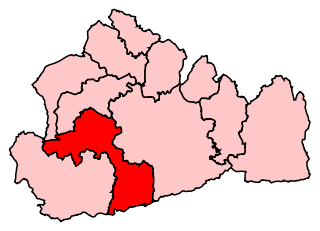
Guildford is a constituency in Surrey represented in the House of Commons of the UK Parliament since 2019 by Angela Richardson, a Conservative.
Rochdale is a constituency represented in the House of Commons of the Parliament of the United Kingdom by George Galloway. Galloway is the leader of the Workers Party of Britain, and was elected at the 2024 by-election. Rochdale has elected one Member of Parliament (MP) since its creation in 1832.
Darlington is the parliamentary constituency for the eponymous market town in County Durham in the North East of England. It is currently represented in the House of Commons of the UK Parliament by Peter Gibson of the Conservative Party, who was first elected in 2019.
Richmond (Yorks) was a constituency in North Yorkshire in the House of Commons of the UK Parliament. It was represented from 1910 to 2024 by members of the Conservative Party. The final MP for Richmond was Rishi Sunak, a Prime Minister and Conservative leader.
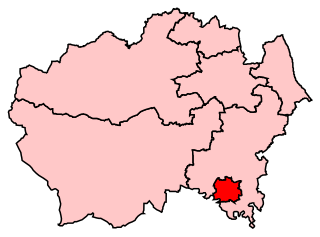
Halifax is a constituency represented in the House of Commons of the UK Parliament since 2015 by Holly Lynch of the Labour Party.
Dewsbury is a constituency created in 1868. This seat is represented in the House of Commons of the United Kingdom Parliament since 2019 by Mark Eastwood of the Conservative Party.
Colne Valley is a constituency represented in the House of Commons of the UK Parliament since 2019 by Jason McCartney of the Conservative Party.
Batley and Spen is a constituency in the House of Commons of the UK Parliament. The current MP is Kim Leadbeater, a Labour politician, elected in a 2021 by-election by a 323-vote margin. The seat has returned Labour MPs since the 1997 general election.
Normanton was a county constituency represented in the House of Commons of the Parliament of the United Kingdom. It elected one Member of Parliament (MP) by the first past the post system of election.
Wakefield was a constituency in West Yorkshire. It was created as a borough constituency in 1832 and reformed as a county constituency in 1885.
Leeds East is a constituency represented in the House of Commons of the UK Parliament since 2015 by Richard Burgon of the Labour Party.
Tottenham is a constituency in Greater London represented in the House of Commons of the UK Parliament since 2000 by David Lammy of the Labour Party. Lammy has served as Shadow Secretary of State for Foreign, Commonwealth and Development Affairs since 2021 in the Shadow Cabinet of Keir Starmer, in which he previously served as Shadow Secretary of State for Justice and Shadow Lord Chancellor from 2020 to 2021. Tottenham was re-created as a parliamentary constituency in 1950, having previously existed from 1885 to 1918.
Horsham is a constituency represented in the House of Commons of the UK Parliament, centred on the eponymous town in West Sussex, its former rural district and part of another rural district. Its Member of Parliament (MP) was Francis Maude between 1997 and 2015; since then it has been Jeremy Quin, both of the Conservative Party.
Save Huddersfield NHS is a minor British political party registered in 2006. The party campaigns against a proposed reorganisation of National Health Service facilities in the Huddersfield area and is led by Dr. Jackie Grunsell, a local general practitioner and member of Socialist Alternative. The party contested elections to Kirklees Council, West Yorkshire, England in 2006–2008.
Huddersfield West was a parliamentary constituency centred on the town of Huddersfield in West Yorkshire. It returned one Member of Parliament (MP) to the House of Commons of the Parliament of the United Kingdom.
{{cite web}}
: CS1 maint: archived copy as title (link)