2003 Wychavon District Council election

Last updated

Map of the results of the 2003 Wychavon District Council election. Conservatives in blue, Liberal Democrats in yellow and Labour in red. Wychavon UK local election 2003 map.svg
Map of the results of the 2003 Wychavon District Council election. Conservatives in blue, Liberal Democrats in yellow and Labour in red.

The 2003 Wychavon District Council election took place on 1 May 2003 to elect members of Wychavon District Council in Worcestershire, England. The whole council was up for election with boundary changes since the last election in 1999 reducing the number of seats by four. [1] The Conservative Party stayed in overall control of the council. [2]

Contents

Background

Before the election the Conservatives controlled the council with 33 councillors, while the Liberal Democrats had 10 seats, Labour had 3, there was 1 independent and 2 seats were vacant. [3] Boundary changes since 1999 reduced the number of wards from 36 to 32 and the number of councillors fell by four. [4] Although all of the seats on the council were up for election, in Norton and Whittington, and Pinvin, there was no election as there was only one candidate in each ward. [3]

One-third of the Conservative councillors stood down at the election, [3] as well as independent John Smith who had represented Pershore on Wychavon District Council from its first election in 1973. [5]

Election result

The Conservatives remained in control of the council after winning 31 of the 45 seats on the council. [4] The Liberal Democrats remained the largest opposition with 12 seats, while Labour took two seats. [6] Overall turnout at the election was 37.94%, almost 4% higher than at the 1999 election. [7]

Among the defeated candidates was the Labour leader on Worcestershire County Council, Peter Pinfield, who lost in Droitwich East. [4] Meanwhile, the Conservative leader of the council, Malcolm Meikle, held his seat by 39 votes and the Liberal Democrat group leader, Margaret Rowley was elected by 19 votes after recounts in both wards. [4] However the Conservatives did lose seats in Pershore, where the Liberal Democrats won all three seats for the ward. [7]

Wychavon local election result 2003 [2] [8]
PartySeatsGainsLossesNet gain/lossSeats %Votes %Votes+/−
  Conservative 31-268.953.623,316+8.0%
  Liberal Democrats 12+226.728.312,316+0.4%
  Labour 2-24.411.14,841-4.2%
  Independent 0-206.42,767-2.2%
  Green 0000.7285+0.0%

Ward results

Badsey [8]
PartyCandidateVotes%±%
Liberal Democrats Sonya Ealey32150.7
Conservative Reginald Jakeman31249.3
Majority91.4
Turnout 63330.1
Bengeworth (2 seats) [8]
PartyCandidateVotes%±%
Conservative Martin Jennings514
Conservative Emma Stokes421
Labour Stephen Selby319
Independent Albert Booth312
Turnout 1,56628.9
Bowbrook [8]
PartyCandidateVotes%±%
Liberal Democrats Alexandra Rowley47151.0
Conservative Christopher Hartwright45249.0
Majority192.1
Turnout 92347.9
Bredon [8]
PartyCandidateVotes%±%
Conservative Adrian Hardman48763.5
Liberal Democrats Jeanette Way21828.4
Labour Peter Kelson628.1
Majority26935.1
Turnout 76738.9
Bretforton and Offenham [8]
PartyCandidateVotes%±%
Liberal Democrats George Bourne40967.0
Conservative Patrick Clifford20133.0
Majority20834.1
Turnout 61030.3
Broadway and Wickhamford (2 seats) [8]
PartyCandidateVotes%±%
Conservative David Folkes964
Conservative David Noyes774
Liberal Democrats Carolyn Harford343
Turnout 2,08132.7
Dodderhill [8]
PartyCandidateVotes%±%
Conservative Judith Pearce39369.1
Liberal Democrats Derek Prior17630.9
Majority21738.1
Turnout 56932.2
Drakes Broughton [8]
PartyCandidateVotes%±%
Conservative Paul Middlebrough41758.8
Liberal Democrats Josephine Wilkinson29241.2
Majority12517.6
Turnout 70937.5
Droitwich Central [8]
PartyCandidateVotes%±%
Liberal Democrats Graham Gopsill23837.4
Labour Eve Freer23536.9
Conservative Glenise Noyes16425.7
Majority30.5
Turnout 63730.2
Droitwich East (2 seats) [8]
PartyCandidateVotes%±%
Conservative Michael Barratt788
Conservative Pamela Davey716
Labour Peter Pinfield691
Labour Sheila Neary667
Turnout 2,86235.3
Droitwich South East (2 seats) [8]
PartyCandidateVotes%±%
Conservative Eileen Hope730
Conservative Donald Lawley645
Independent Ronald Waters487
Labour Bill Baker286
Labour Jon Baker264
Turnout 2,41233.8
Droitwich South West (2 seats) [8]
PartyCandidateVotes%±%
Conservative Terence Spencer497
Conservative Maureen Lawley476
Liberal Democrats Wendy Carter391
Independent Claude Heeley358
Labour John Cook324
Liberal Democrats Pamela Jackson-Smith282
Labour Sheila Seabourne278
Turnout 2,60634.6
Droitwich West (2 seats) [8]
PartyCandidateVotes%±%
Labour Roy Seabourne473
Labour John Wrenn442
Conservative Laurence Evans314
Conservative Alan Fisher306
Turnout 1,53521.1
Ecckington [8]
PartyCandidateVotes%±%
Conservative Peter Wright50759.1
Liberal Democrats Roy Chiverton23427.3
Labour Priscilla Cameron11713.6
Majority27331.8
Turnout 85839.0
Elmley Castle and Somerville [8]
PartyCandidateVotes%±%
Conservative Dorothy Mackison55862.3
Liberal Democrats Garth Raymer33837.7
Majority22024.6
Turnout 89645.1
Evesham North (2 seats) [8]
PartyCandidateVotes%±%
Conservative Josephine Sandalls461
Conservative Roma Kirke436
Labour Robin Lunn302
Liberal Democrats Pauline Christie298
Independent Paul Rencher220
Turnout 1,71728.1
Evesham South (2 seats) [8]
PartyCandidateVotes%±%
Conservative Ronald Cartwright549
Conservative Robert Banks504
Liberal Democrats Diana Brown354
Turnout 1,40722.9
Fladbury [8]
PartyCandidateVotes%±%
Conservative Malcolm Meikle55849.3
Liberal Democrats Thomas McDonald52246.1
Labour Ross Hayman524.6
Majority363.2
Turnout 1,13252.0
Great Hampton [8]
PartyCandidateVotes%±%
Conservative John Smith42068.4
Liberal Democrats Edward Martin19431.6
Majority22636.8
Turnout 61429.8
Hartlebury [8]
PartyCandidateVotes%±%
Conservative Muriel Mathews43577.1
Labour Steven Westwood12922.9
Majority30654.3
Turnout 56426.0
Havington and Norton [8]
PartyCandidateVotes%±%
Conservative Clive Holt42558.7
Liberal Democrats Noel Christie29941.3
Majority12617.4
Turnout 72435.4
Honeybourne and Pebworth [8]
PartyCandidateVotes%±%
Liberal Democrats Thomas Bean29547.6
Independent Sharon Summers18029.0
Conservative Lesley Auden14523.4
Majority11518.5
Turnout 62032.6
Inkberrow (2 seats) [8]
PartyCandidateVotes%±%
Conservative Audrey Steel1,262
Conservative David Lee1,093
Liberal Democrats Martin Davey632
Liberal Democrats Donald Aldridge518
Turnout 3,50541.3
Little Hampton (2 seats) [8]
PartyCandidateVotes%±%
Conservative Andrew Dyke480
Liberal Democrats John Payne420
Conservative John Stych333
Turnout 1,23321.5
Lovett and North Claines (2 seats) [8]
PartyCandidateVotes%±%
Conservative Paul Coley897
Conservative Andrew Christian-Brookes870
Liberal Democrats Anthony Miller556
Liberal Democrats Janet Saunders457
Turnout 2,78035.8
Norton and Whittington [8]
PartyCandidateVotes%±%
Conservative Robert Adamsunopposed
Ombersley [8]
PartyCandidateVotes%±%
Conservative Jean Dowty53980.6
Liberal Democrats Judith Cussen13019.4
Majority40961.1
Turnout 66936.5
Pershore (3 seats) [8]
PartyCandidateVotes%±%
Liberal Democrats Gaynor Amphhlett898
Liberal Democrats John Grantham785
Liberal Democrats Charles Tucker731
Conservative Richard Hampton654
Conservative Valerie Wood607
Conservative Maurene Wilson529
Independent Trudy Burge455
Independent Raith Annis328
Green David Shaw285
Independent Malcolm Dalley216
Independent Kenneth Rowe211
Labour Susan Hayman155
Turnout 5,85436.3
Pinvin [8]
PartyCandidateVotes%±%
Liberal Democrats Malcolm Argyleunopposed
South Bredon Hill [8]
PartyCandidateVotes%±%
Liberal Democrats Adrian Darby55557.3
Conservative Beverley Hardman36838.0
Labour Fiona Cameron454.6
Majority18719.3
Turnout 96850.6
The Littletons [8]
PartyCandidateVotes%±%
Conservative Mary Smith53260.0
Liberal Democrats Helen Martin35440.0
Majority17820.1
Turnout 88640.5
Upton Snodsbury [8]
PartyCandidateVotes%±%
Liberal Democrats Elizabeth Tucker60550.9
Conservative Linda Robinson58349.1
Majority221.9
Turnout 1,18855.8

Related Research Articles

<span class="mw-page-title-main">West Worcestershire (UK Parliament constituency)</span> Parliamentary constituency in the United Kingdom, 1997 onwards

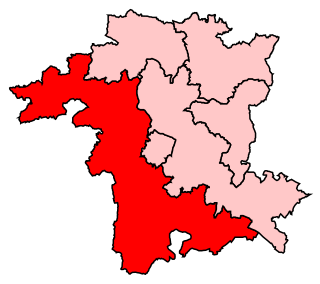
West Worcestershire is a constituency in Worcestershire represented in the House of Commons of the UK Parliament since 2010 by Harriett Baldwin, a Conservative. The constituency is considered a safe seat for the Conservatives. The constituency boundaries roughly correspond with the Malvern Hills District.

The 1999 Craven District Council election took place on 6 May 1999 to elect members of Craven District Council in North Yorkshire, England. One third of the council was up for election and the Conservative Party gained overall control of the council from no overall control.

<span class="mw-page-title-main">2004 Craven District Council election</span>

The 2004 Craven District Council election took place on 10 June 2004 to elect members of Craven District Council in North Yorkshire, England. One third of the council was up for election and the council stayed under no overall control.

<span class="mw-page-title-main">2003 Harlow District Council election</span>

The 2003 Harlow District Council election took place on 1 May 2003 to elect members of Harlow District Council in Essex, England. One third of the council was up for election and the council stayed under no overall control.

The 2003 Redditch Borough Council election took place on 1 May 2003 to elect members of Redditch Borough Council in the West Midlands region, England. One third of the council was up for election and the council stayed under no overall control.

<span class="mw-page-title-main">2004 St Albans City and District Council election</span>

The 2004 St Albans City and District Council election took place on 10 June 2004 to elect members of St Albans District Council in Hertfordshire, England. One third of the council was up for election and the council stayed under no overall control.

The 1998 Wyre Forest District Council election took place on 7 May 1998 to elect members of Wyre Forest District Council in Worcestershire, England. One-third of the council was up for election and the Labour Party stayed in overall control of the council.

<span class="mw-page-title-main">2002 Wyre Forest District Council election</span>

The 2002 Wyre Forest District Council election took place on 2 May 2002 to elect members of Wyre Forest District Council in Worcestershire, England. One third of the council was up for election and the Independent Kidderminster Hospital and Health Concern party gained overall control of the council from no overall control.

<span class="mw-page-title-main">2004 Wyre Forest District Council election</span> Election in Worcestershire, England

The 2004 Wyre Forest District Council election took place on 10 June 2004 to elect members of Wyre Forest District Council in Worcestershire, England. The whole council was up for election with boundary changes since the last election in 2003. The council stayed under no overall control, but with the Conservatives taking over as the largest party on the council from the Health Concern party.

<span class="mw-page-title-main">2006 Wyre Forest District Council election</span>

The 2006 Wyre Forest District Council election took place on 4 May 2006 to elect members of Wyre Forest District Council in Worcestershire, England. One third of the council was up for election and the council stayed under no overall control.

<span class="mw-page-title-main">2003 Solihull Metropolitan Borough Council election</span>

The 2003 Solihull Metropolitan Borough Council election took place on 1 May 2003 to elect members of Solihull Metropolitan Borough Council in the West Midlands, England. One third of the council was up for election and the Conservative Party stayed in overall control of the council.

The 1999 Wychavon District Council election took place on 6 May 1999 to elect members of Wychavon District Council in Worcestershire, England. The whole council was up for election and the Conservative Party gained overall control of the council from no overall control.

<span class="mw-page-title-main">2007 Wychavon District Council election</span>

The 2007 Wychavon District Council election took place on 3 May 2007 to elect members of Wychavon District Council in Worcestershire, England. The whole council was up for election and the Conservative Party stayed in overall control of the council.

<span class="mw-page-title-main">2011 Wychavon District Council election</span>

The 2011 Wychavon District Council election took place on 5 May 2011 to elect members of Wychavon District Council in Worcestershire, England. The whole council was up for election and the Conservative Party stayed in overall control of the council.

<span class="mw-page-title-main">2015 Wychavon District Council election</span>

The 2015 Wychavon District Council election took place on 7 May 2015 to elect members of Wychavon District Council in Worcestershire, England. The whole council was up for election and the Conservative Party stayed in overall control of the council.

<span class="mw-page-title-main">2003 West Oxfordshire District Council election</span>

The 2003 West Oxfordshire District Council election took place on 1 May 2003 to elect members of West Oxfordshire District Council in Oxfordshire, England. One third of the council was up for election and the Conservative Party stayed in overall control of the council.

<span class="mw-page-title-main">2004 West Oxfordshire District Council election</span>

The 2004 West Oxfordshire District Council election took place on 10 June 2004 to elect members of West Oxfordshire District Council in Oxfordshire, England. One third of the council was up for election and the Conservative Party stayed in overall control of the council.

<span class="mw-page-title-main">2006 West Oxfordshire District Council election</span>

The 2006 West Oxfordshire District Council election took place on 4 May 2006 to elect members of West Oxfordshire District Council in Oxfordshire, England. One third of the council was up for election and the Conservative Party stayed in overall control of the council.

<span class="mw-page-title-main">2007 West Oxfordshire District Council election</span>

The 2007 West Oxfordshire District Council election took place on 3 May 2007 to elect members of West Oxfordshire District Council in Oxfordshire, England. One third of the council was up for election and the Conservative Party stayed in overall control of the council.

The 2022 Birmingham City Council election took place on 5 May 2022, with all 101 council seats up for election across 37 single-member and 32 two-member wards. The election was held alongside other local elections across Great Britain and town council elections in Sutton Coldfield.

References

  1. "Local elections". BBC News Online . Retrieved 27 April 2015.
  2. 1 2 "English councils - Non-metropolitan districts". The Times . NewsBank. 3 May 2003. p. 47.
  3. 1 2 3 "Tories under siege at polls". Worcestershire, West Midlands, Herefordshire, and Shropshire Counties Publications. NewsBank. 11 April 2003.
  4. 1 2 3 4 "Victory fails to bring control". Worcestershire, West Midlands, Herefordshire, and Shropshire Counties Publications. NewsBank. 2 May 2003.
  5. "'Mr Pershore' John standing down after 56 year's service". Worcestershire, West Midlands, Herefordshire, and Shropshire Counties Publications. NewsBank. 10 April 2003.
  6. "Local election results - Wychavon". Worcestershire, West Midlands, Herefordshire, and Shropshire Counties Publications. NewsBank. 2 May 2003.
  7. 1 2 "Tory joy at the local elections". Worcestershire, West Midlands, Herefordshire, and Shropshire Counties Publications. NewsBank. 8 May 2003.
  8. 1 2 3 4 5 6 7 8 9 10 11 12 13 14 15 16 17 18 19 20 21 22 23 24 25 26 27 28 29 30 31 32 33 "District Council election" (PDF). Wychavon District Council. Archived from the original (PDF) on 27 April 2015. Retrieved 27 April 2015.