2003 Winchester City Council election

Last updated

2003 Winchester City Council election
Flag of England.svg
  2002 1 May 2003 2004  

20 of 57 seats to Winchester City Council
29 seats needed for a majority
 First partySecond party
 
Party Conservative Liberal Democrats
Seats before1435
Seats won106
Seats after1929
Seat changeIncrease2.svg4Decrease2.svg6
Popular vote12,15811,171
Percentage45.041.3

 Third partyFourth party
 
Party Labour Independent
Seats before53
Seats won21
Seats after54
Seat changeIncrease2.svg2Steady2.svg
Popular vote2,5701,117
Percentage9.54.1

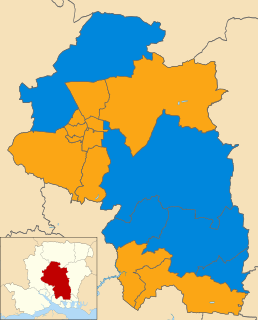
Winchester UK local election 2003 map.svg
Results by Ward

Council control before election

Liberal Democrats

Council control after election

Liberal Democrats

The 2003 Winchester Council election took place on 1 May 2003 to elect members of Winchester District Council in Hampshire, England. One third of the council was up for election and the Liberal Democrats stayed in overall control of the council. [1] [2]

Contents

Background

20 were contested in the election with the election in Droxford, Soberton and Hambledon being a by-election after the previous Conservative councillor resigned. [3] 2 other seats saw the sitting councillor standing down, Owslebury and Curdridge and St Luke, while 3 of the Liberal Democrat cabinet members were defending seats. [3]

Election result

The election saw the Liberal Democrats just keep a majority on the council with 29 of the 57 seats. However they lost 4 seats to the Conservatives and 2 to Labour. [4]

Winchester Local Election Result 2003 [4]
PartySeatsGainsLossesNet gain/lossSeats %Votes %Votes+/−
  Conservative 1140+455.045.812,772+9.2%
  Liberal Democrats 606-630.041.011,437-3.6%
  Labour 220+210.09.32,586+0.1%
  Independent 10005.04.01,117-5.5%

Ward results

Bishop's Waltham

Bishop's Waltham [4]
PartyCandidateVotes%±%
Independent Colin Chamberlain86351.1
Conservative Sally Lees46227.3
Liberal Democrats Jillian Blackmore28917.1
Labour Stephen Haines764.5
Majority40123.8
Turnout 1,69032.9-5.2
Independent hold Swing

Colden Common and Twyford

Colden Common and Twyford [4]
PartyCandidateVotes%±%
Liberal Democrats James Wagner1,00463.2
Conservative Peter Facey50932.0
Labour Clare McKenna764.8
Majority49531.2
Turnout 1,58938.4-3.7
Liberal Democrats hold Swing

Compton and Otterbourne

Compton and Otterbourne [4]
PartyCandidateVotes%±%
Conservative Murray McMillan77354.4
Liberal Democrats Peter Mason59842.1
Labour Kathleen Smith513.6
Majority17512.3
Turnout 1,42245.2+0.2
Conservative gain from Liberal Democrats Swing

Denmead

Denmead [4]
PartyCandidateVotes%±%
Conservative Patricia Stallard1,24471.8
Liberal Democrats Alan Slade43425.0
Labour Adrian Field553.2
Majority81046.8
Turnout 1,73334.8-6.2
Conservative hold Swing

Droxford, Soberton and Hambledon

Droxford, Soberton and Hambledon [4]
PartyCandidateVotes%±%
Conservative Anthony Coates61468.5+5.3
Liberal Democrats Margaret Scriven26629.7-7.1
Labour Albert Edwards161.8+1.8
Majority34838.8+12.4
Turnout 89657.9-0.8
Conservative hold Swing

Itchen Valley

Itchen Valley [4]
PartyCandidateVotes%±%
Conservative Daniel Baxter46371.8-0.1
Liberal Democrats David Keston15323.7-4.4
Labour Denise Baker294.5+4.5
Majority31048.1+4.3
Turnout 64541.5-0.4
Conservative hold Swing

Littleton and Harestock

Littleton and Harestock [4]
PartyCandidateVotes%±%
Liberal Democrats Kelsie Learney87567.4
Conservative James Duddridge35427.3
Labour Elaine Fullaway705.4
Majority52140.1
Turnout 1,29946.1+4.4
Liberal Democrats hold Swing

Owslebury and Curdridge

Owslebury and Curdridge [4]
PartyCandidateVotes%±%
Liberal Democrats Ian Merritt75552.8
Conservative Clive Mansell63444.3
Labour Timothy Curran422.9
Majority1218.5
Turnout 1,43149.1-0.6
Liberal Democrats hold Swing

St Barnabas

St. Barnabas [4]
PartyCandidateVotes%±%
Conservative Eileen Berry1,16355.2
Liberal Democrats John Higgins81938.9
Labour Simon Woolfenden1235.8
Majority34416.3
Turnout 2,10546.2-0.9
Conservative gain from Liberal Democrats Swing

St. Bartholomew

St. Bartholomew [4]
PartyCandidateVotes%±%
Liberal Democrats Susan Nelmes79849.8
Conservative Stephen Brine62739.1
Labour Denis Archdeacon17811.1
Majority17110.7
Turnout 1,60334.6-3.3
Liberal Democrats hold Swing

St. John and All Saints

St. John and All Saints [4]
PartyCandidateVotes%±%
Labour Antony De Peyer54339.0
Liberal Democrats Hilary Jones45732.9
Conservative Michael Lovegrove39128.1
Majority866.1
Turnout 1,39129.5-2.3
Labour gain from Liberal Democrats Swing

St. Luke

St. Luke [4]
PartyCandidateVotes%±%
Labour Peter Rees43832.9
Liberal Democrats Jacey Jackson33325.0
Conservative Richard Worrall30522.9
Independent Heather House25419.1
Majority1057.9
Turnout 1,33031.2-12.4
Labour gain from Liberal Democrats Swing

St. Michael

St. Michael [4]
PartyCandidateVotes%±%
Conservative Fiona Mather88450.8
Liberal Democrats Susan Chesters73642.3
Labour Debra Grech1217.0
Majority1488.5
Turnout 1,74139.3-4.7
Conservative hold Swing

St. Paul

St. Paul [4]
PartyCandidateVotes%±%
Liberal Democrats Richard Bennetts77262.3
Conservative Ian Jones34127.5
Labour Carol Orchard12610.2
Majority43134.8
Turnout 1,23927.3-6.3
Liberal Democrats hold Swing

Swanmore and Newton

Swanmore and Newtown [4]
PartyCandidateVotes%±%
Conservative Frank Pearson88555.3
Liberal Democrats Sarah Bradby67041.9
Labour Denis May442.8
Majority21513.4
Turnout 1,59949.9-2.5
Conservative hold Swing

The Alresfords

The Alresfords [4]
PartyCandidateVotes%±%
Conservative Ernest Jeffs1,05646.1
Liberal Democrats Valerie Miller78434.3
Labour Robin Atkins44919.6
Majority27211.8
Turnout 2,28946.1+2.1
Conservative hold Swing

Upper Meon Valley

Upper Meon Valley [4]
PartyCandidateVotes%±%
Conservative Christine Quar46469.3+1.5
Liberal Democrats Diana Vear17726.4-5.8
Labour Tessa Valentine294.3+4.3
Majority28742.9+7.3
Turnout 67045.2-5.6
Conservative hold Swing

Whiteley

Whiteley [4]
PartyCandidateVotes%±%
Conservative Caroline Watts29755.7
Liberal Democrats Patrick Wright21340.0
Labour Michael Chaplin234.3
Majority8415.7
Turnout 53329.3+4.6
Conservative gain from Liberal Democrats Swing

Wickham

Wickham [4]
PartyCandidateVotes%±%
Liberal Democrats Philip Clohosey62558.4
Conservative Graeme Quar41638.9
Labour David Picton-Jones292.7
Majority20919.5
Turnout 1,07043.0-0.1
Liberal Democrats hold Swing

Wonston and Micheldever

Wonston and Micheldever [4]
PartyCandidateVotes%±%
Conservative Malcolm Wright89054.4
Liberal Democrats Richard Bayley67941.5
Labour Nigel Lickley684.2
Majority21112.9
Turnout 1,63765.7+23.8
Conservative gain from Liberal Democrats Swing

Related Research Articles

City of Winchester Place in England

The City of Winchester is a local government district in Hampshire, England, with city status.
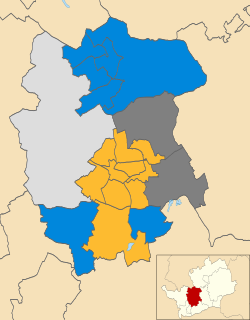
2008 St Albans City and District Council election

The 2008 St Albans City and District Council election took place on 1 May 2008 to elect members of St Albans District Council in Hertfordshire, England. One third of the council was up for election and the Liberal Democrats gained overall control of the council from no overall control.
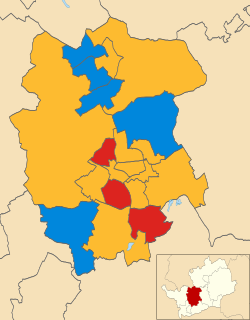
2003 St Albans City and District Council election

The 2003 St Albans City and District Council election took place on 1 May 2003 to elect members of St Albans District Council in Hertfordshire, England. One third of the council was up for election and the council stayed under no overall control.

2010 Winchester City Council election

The 2010 Winchester Council election took place on 6 May 2010 to elect members of Winchester District Council in Hampshire, England. One third of the council was up for election and the Liberal Democrats gained overall control of the council from the Conservative party.

2003 Woking Borough Council election

The 2003 Woking Council election took place on 1 May 2003 to elect members of Woking Borough Council in Surrey, England. One third of the council was up for election and the council stayed under no overall control.

The 1999 Winchester Council election took place on 6 May 1999 to elect members of Winchester District Council in Hampshire, England. One third of the council was up for election and the Liberal Democrats stayed in overall control of the council.

The 2000 Winchester Council election took place on 4 May 2000 to elect members of Winchester District Council in Hampshire, England. One third of the council was up for election and the Liberal Democrats stayed in overall control of the council.

2002 Winchester City Council election

The 2002 Winchester Council election took place on 2 May 2002 to elect members of Winchester District Council in Hampshire, England.

2004 Winchester City Council election

The 2004 Winchester Council election took place on 10 June 2004 to elect members of Winchester District Council in Hampshire, England. One third of the council was up for election and the Liberal Democrats lost overall control of the council to no overall control.

2006 Winchester City Council election

The 2006 Winchester Council election took place on 4 May 2006 to elect members of Winchester District Council in Hampshire, England. One third of the council was up for election and the Conservative party gained overall control of the council from no overall control.

2007 Winchester City Council election

The 2007 Winchester Council election took place on 3 May 2007 to elect members of Winchester District Council in Hampshire, England. One third of the council was up for election and the Conservative party stayed in overall control of the council.

2008 Winchester City Council election

The 2008 Winchester Council election took place on 1 May 2008 to elect members of Winchester District Council in Hampshire, England. One third of the council was up for election and the Conservative party stayed in overall control of the council.

2008 Stratford-on-Avon District Council election

The 2008 Stratford-on-Avon District Council election took place on 1 May 2008 to elect members of Stratford-on-Avon District Council in Warwickshire, England. One third of the council was up for election and the Conservative party stayed in overall control of the council.

2003 Hart District Council election

The 2003 Hart Council election took place on 1 May 2003 to elect members of Hart District Council in Hampshire, England. One third of the council was up for election and the Conservative party stayed in overall control of the council.

2003 Southampton City Council election

The 2003 Southampton Council election took place on 1 May 2003 to elect members of Southampton Unitary Council in Hampshire, England. One third of the council was up for election and the council stayed under no overall control.
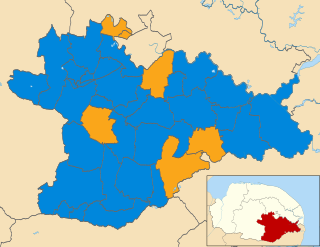
2011 South Norfolk District Council election

The elections to South Norfolk District Council were held on Thursday 5 May 2011 along with various other local elections around England, elections to the Scottish Parliament, National Assembly of Wales and Northern Ireland Assembly, and a referendum on whether to adopt the Alternative Vote electoral system for elections to the House of Commons. All 46 council seats were up for election. The previous council was controlled by the Conservatives, with the Liberal Democrats being the only opposition.

2011 East Hampshire District Council election

The 2011 East Hampshire District Council election took place on 5 May 2011 to elect members of East Hampshire District Council in Hampshire England. The whole council was up for election and the Conservative party stayed in overall control of the council.
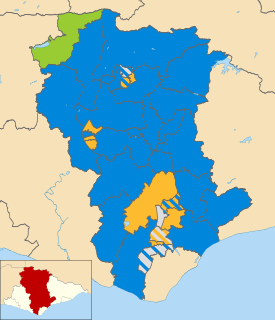
2007 Wealden District Council election

The 2007 Wealden District Council election took place on 3 May 2007 to elect members of Wealden District Council in East Sussex, England. The whole council was up for election and the Conservative party stayed in overall control of the council.

2015 Winchester City Council election

The 2015 Winchester City Council election took place on 7 May 2015 to elect members of Winchester City Council in England. In total, 20 out of 57 council seats were up for election. The Conservatives gained majority control of Winchester City Council from No Overall Control, following the defection of two former conservative councillors to the Liberal Democrats in 2014.
2019 Winchester City Council election

Elections to Winchester City Council took place on Thursday 2 May 2019, alongside other local elections across the country. The Conservatives party held a narrow majority of one at the last election, with the seats contested in this election being last contested in 2016 election. The Conservatives defended 10 seats, whilst the Liberal Democrats defended 4. Town and parish councils in the city boundary were also up for election.

References

  1. "Local elections". BBC News Online . Retrieved 30 January 2010.
  2. "Election Results". The Times . 2 May 2003. p. 17.
  3. 1 2 "City council nominations". Southern Daily Echo . 8 April 2003. Retrieved 30 January 2010.
  4. 1 2 3 4 5 6 7 8 9 10 11 12 13 14 15 16 17 18 19 20 21 22 "District Council Elections Results 2003". Winchester City Council. Archived from the original on 14 June 2011. Retrieved 30 January 2010.
Preceded by
2002 Winchester Council election
Winchester local elections Succeeded by
2004 Winchester Council election