
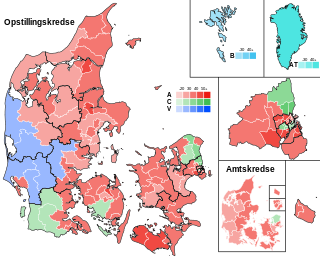
General elections were held in Denmark on 11 March 1998. Although the centre-right parties led by Venstre had been expected to win, the Social Democratic Party-led government of Poul Nyrup Rasmussen remained in power in a very close vote that required several recounts.

General elections were held in Denmark on 12 December 1990. Although the election resulted in a strong gain for the Social Democratic Party, Poul Schlüter's coalition government was able to continue despite the Danish Social Liberal Party leaving. Schlüter's coalition consisted of the Conservative People's Party and Venstre. Voter turnout was 83% in Denmark proper, 54% in the Faroe Islands and 51% in Greenland.

General elections were held in Denmark on 10 May 1988, just seven months after the last elections. Prime Minister Poul Schlüter chose to call for an election after the Conservative People's Party-led government fell short of a majority in a foreign policy issue after they failed to come to an agreement with the Social Democrats. In a parliamentary debate, Prime Minister Poul Schlüter accused Svend Auken of breaking a political deal between the two of them whilst Auken accused Schlüter of lying to the public.

General elections were held in Denmark on 8 September 1987. Although the Social Democratic Party remained the largest in the Folketing with 54 of the 179 seats, the Conservative People's Party-led coalition government was able to continue. Voter turnout was 87% in Denmark proper, 69% in the Faroe Islands and 45% in Greenland.
General elections were held in Denmark on 10 January 1984, after the opposition voted against the government's state budget bill. Although the Social Democratic Party remained the largest in the Folketing with 56 of the 179 seats, the Conservative People's Party achieved its best-ever result, gaining 16 seats. The coalition partners Venstre and the Christian People's Party also increased their representation, although the fourth government party, the Centre Democrats, lost seven of their 15 seats. Overall the coalition won three more seats, and Poul Schlüter continued as Prime Minister.

General elections were held in Denmark on 8 December 1981. The Social Democratic Party remained the largest in the Folketing, with 59 of the 179 seats. Voter turnout was 83% in Denmark proper, 55% in the Faroe Islands and 61% in Greenland.

General elections were held in Denmark on 23 October 1979. The Social Democratic Party remained the largest in the Folketing, with 68 of the 179 seats. Voter turnout was 86% in Denmark proper, 65% in the Faroe Islands and 50% in Greenland.

General elections were held in Denmark on 15 February 1977. The Social Democratic Party remained the largest in the Folketing, with 65 of the 179 seats. Voter turnout was 89% in Denmark proper, 63% in the Faroe Islands and 70% in Greenland.
General elections were held in Denmark on 4 December 1973 and in the Faroe Islands on 13 December. It has since been referred to as the Landslide Election, as five new or previously unrepresented parties won seats, and more than half the members of the parliament were replaced. The Social Democratic Party, which had led a minority government until this election, lost a third of their seats. After the election Poul Hartling, the leader of the liberal Venstre, formed the smallest minority government in Denmark's history with only 22 seats, supported by the Progress Party, the Conservative People's Party, the Social Liberal Party, the Centre Democrats and the Christian People's Party.

General elections were held in Denmark on 23 January 1968. The Social Democratic Party remained the largest in the Folketing, with 62 of the 179 seats. Voter turnout was 89% in Denmark proper, 57% in the Faroe Islands and 56% in Greenland. They were the last elections in which the old counties were used as constituencies.

General elections were held in Denmark on 15 November 1960. The Social Democratic Party remained the largest in the Folketing, with 76 of the 179 seats. Voter turnout was 86% in Denmark proper, 57% in the Faroe Islands and 66% in Greenland. They were the last elections in which the electoral threshold for the Danish seats was 60,000 votes. The following year the electoral law was amended to make it 2% of the vote.

General elections were held in the Kingdom of Denmark on 22 September 1953, the first under the new constitution. The Social Democratic Party remained the largest in the Folketing, with 74 of the 179 seats. Voter turnout was 81% in Denmark proper and 69% in Greenland. The electoral threshold was 60,000 votes.

Folketing elections were held in Denmark on 11 April 1924. The result was a victory for the Social Democratic Party led by Thorvald Stauning, which won 55 of the 149 seats. Voter turnout was 78.6% in Denmark proper. In the Faroe Islands constituency there was only one candidate, who was returned unopposed.

Folketing elections were held in Denmark on 2 December 1926, except in the Faroe Islands where they were held on 20 December. The Social Democratic Party remained the largest in the Folketing, with 53 of the 149 seats. Voter turnout was 77.0% in Denmark proper and 40.2% in the Faroes.
Folketing elections were held alongside Landsting elections in Denmark on 30 October 1945, except in the Faroe Islands where they were held on 20 November. The Social Democratic Party remained the largest in the Folketing, with 48 of the 149 seats. Voter turnout was 86% in Denmark proper and 57% in the Faroes.

Folketing elections were held in Denmark on 28 October 1947, except in the Faroe Islands where they were held on 18 February 1948. The Social Democratic Party remained the largest in the Folketing, with 57 of the 150 seats. Voter turnout was 86% in Denmark proper and 60% in the Faroes.

Folketing elections were held alongside Landsting elections in Denmark on 21 April 1953, except in the Faroe Islands where they were held on 7 May. The Social Democratic Party remained the largest in the Folketing, with 61 of the 151 seats. Voter turnout was 81% in Denmark proper but just 20% in the Faroes.
Folketing elections were held in Denmark on 7 June 1864. The National Liberal Party emerged as the largest faction, winning 40 of the 101 seats. Following the elections, Christian Albrecht Bluhme became Prime Minister on 7 July.
Folketing elections were held in Denmark on 4 August 1852. Although the National Liberal Party became the largest party, Christian Albrecht Bluhme of the Højre party remained Prime Minister after the elections.
Folketing elections were held in Denmark on 22 September 1869. The Mellem Party emerged as the largest factions, winning 27 seats. Christian Emil Krag-Juel-Vind-Frijs remained Prime Minister.


