
General elections were held in Denmark on 11 March 1998. Although the centre-right parties led by Venstre had been expected to win, the Social Democratic Party-led government of Poul Nyrup Rasmussen remained in power in a very close vote that required several recounts.

General elections were held in Denmark on 12 December 1990. Although the election resulted in a strong gain for the Social Democratic Party, Poul Schlüter's coalition government was able to continue despite the Danish Social Liberal Party leaving. Schlüter's coalition consisted of the Conservative People's Party and Venstre. Voter turnout was 83% in Denmark proper, 54% in the Faroe Islands and 51% in Greenland.

General elections were held in Denmark on 8 September 1987. Although the Social Democratic Party remained the largest in the Folketing with 54 of the 179 seats, the Conservative People's Party-led coalition government was able to continue. Voter turnout was 87% in Denmark proper, 69% in the Faroe Islands and 45% in Greenland.

General elections were held in Denmark on 8 February 2005. Prime Minister Anders Fogh Rasmussen's Venstre remained the largest party in the Folketing and his governing coalition with the Conservative People's Party remained intact, with the Danish People's Party providing the parliamentary support needed for the minority government. The Danish Social Liberal Party made the biggest gains of any party, although it remained outside the governing group of parties. The elections marked the second time in a row that the Social Democrats were not the largest party in parliament, a change from most of the 20th century. The Social Democrats lost five seats and leader Mogens Lykketoft resigned immediately after the elections. Voter turnout was 85% in Denmark proper, 73% in the Faroe Islands and 59% in Greenland.

General elections were held in Denmark on 8 December 1981. The Social Democratic Party remained the largest in the Folketing, with 59 of the 179 seats. Voter turnout was 83% in Denmark proper, 55% in the Faroe Islands and 61% in Greenland.

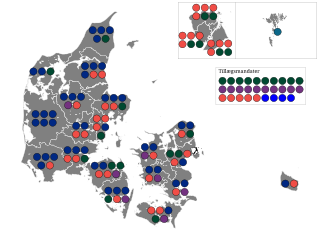
General elections were held in Denmark on 23 October 1979. The Social Democratic Party remained the largest in the Folketing, with 68 of the 179 seats. Voter turnout was 86% in Denmark proper, 65% in the Faroe Islands and 50% in Greenland.

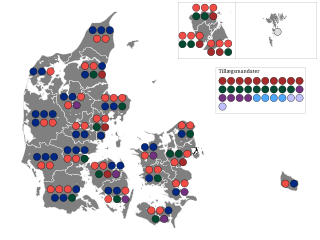
General elections were held in Denmark on 15 February 1977. The Social Democratic Party remained the largest in the Folketing, with 65 of the 179 seats. Voter turnout was 89% in Denmark proper, 63% in the Faroe Islands and 70% in Greenland.

General elections were held in Denmark on 21 September 1971 and in the Faroe Islands on 5 October. The Social Democratic Party remained the largest in the Folketing, with 70 of the 179 seats. Voter turnout was 87% in Denmark proper, 57% in the Faroe Islands and 52% in Greenland.

General elections were held in Denmark on 23 January 1968. The Social Democratic Party remained the largest in the Folketing, with 62 of the 179 seats. Voter turnout was 89% in Denmark proper, 57% in the Faroe Islands and 56% in Greenland. They were the last elections in which the old counties were used as constituencies.

General elections were held in Denmark on 22 November 1966, although in Greenland the elections were held on 6 December 1966. The Social Democratic Party remained the largest in the Folketing, with 69 of the 179 seats. Voter turnout was 89% in Denmark proper, 49% in the Faroe Islands and 59% in Greenland.

General elections were held in Denmark on 22 September 1964. The Social Democratic Party remained the largest in the Folketing, with 76 of the 179 seats. Voter turnout was 86% in Denmark proper, 50% in the Faroe Islands and 49% in Greenland. They were the first elections with the new electoral threshold of 2%.

General elections were held in Denmark on 14 May 1957. The Social Democratic Party remained the largest in the Folketing, with 70 of the 179 seats. Voter turnout was 84% in Denmark proper, 38% in the Faroe Islands and 62% in Greenland. The electoral threshold was 60,000 votes.

General elections were held in the Kingdom of Denmark on 22 September 1953, the first under the new constitution. The Social Democratic Party remained the largest in the Folketing, with 74 of the 179 seats. Voter turnout was 81% in Denmark proper and 69% in Greenland. The electoral threshold was 60,000 votes.
Folketing elections were held in Denmark on 26 April 1920, except in the Faroe Islands, where they were held on 20 May. The election campaign was the most aggressive and bitter in Denmark in the 20th century. Voter turnout was 80.6% in Denmark proper and 58.8% in the Faroe Islands.

Folketing elections were held in Denmark on 2 December 1926, except in the Faroe Islands where they were held on 20 December. The Social Democratic Party remained the largest in the Folketing, with 53 of the 149 seats. Voter turnout was 77.0% in Denmark proper and 40.2% in the Faroes.

Folketing elections were held in Denmark on 24 April 1929, except in the Faroe Islands where they were held on 29 May. The Social Democratic Party remained the largest in the Folketing, with 61 of the 149 seats. Voter turnout was 79.7% in Denmark proper and 58.0% in the Faroes. Social Democrat Thorvald Stauning returned to the Prime Ministership by forming a coalition government with the Social Liberals, a position he would hold until 1942.
Folketing elections were held alongside Landsting elections in Denmark on 30 October 1945, except in the Faroe Islands where they were held on 20 November. The Social Democratic Party remained the largest in the Folketing, with 48 of the 149 seats. Voter turnout was 86% in Denmark proper and 57% in the Faroes.

Folketing elections were held in Denmark on 22 October 1935, except in the Faroe Islands where they were held on 11 November. The Social Democratic Party led by Prime minister Thorvald Stauning remained the largest in the Folketing, winning 68 of the 149 seats. Voter turnout was 80.7% in Denmark proper and 55.4% in the Faroes. It was in this election that the Social Democrats used the famous slogan "Stauning or Chaos".

Folketing elections were held in Denmark on 28 October 1947, except in the Faroe Islands where they were held on 18 February 1948. The Social Democratic Party remained the largest in the Folketing, with 57 of the 150 seats. Voter turnout was 86% in Denmark proper and 60% in the Faroes.

Folketing elections were held alongside Landsting elections in Denmark on 21 April 1953, except in the Faroe Islands where they were held on 7 May. The Social Democratic Party remained the largest in the Folketing, with 61 of the 151 seats. Voter turnout was 81% in Denmark proper but just 20% in the Faroes.


