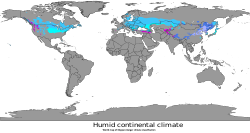
Climate of Massachusetts

Last updated
Koppen climate types of Massachusetts, using 1991-2020 climate normals. Koppen Climate Types Massachusetts.png
Köppen climate types of Massachusetts, using 1991-2020 climate normals.
A blizzard after hitting Boston on February 13, 2006 Blizzard Boston.jpg
A blizzard after hitting Boston on February 13, 2006

The climate of Massachusetts' is mainly a humid continental climate, with hot, humid summers, cold, snowy winters and abundant precipitation. [1] Massachusetts is a states located in the New England region of the northeastern United States. Most of its population of 7 million live in the Boston metropolitan area. The eastern half of this relatively small state is mostly urban and suburban. Massachusetts is the most populous of the six New England states and ranks third in the nation by population density and fourth by GDP per capita. Massachusetts receives about 43 inches or 1,090 millimetres of rain annually, fairly evenly distributed throughout the years, slightly wetter during the winter. [2] Summers are warm with average high temperatures in July above 80 °F or 26.7 °C and overnight lows above 60 °F or 15.6 °C common throughout the state. [3] Winters are cold, but generally less extreme on the coast with high temperatures in the winter averaging above freezing even in January, although areas further inland are much colder. The state does have extreme temperatures from time to time with 100 °F or 37.8 °C in the summer and temperatures below 0 °F or −17.8 °C in the winter not being unusual. [2]

Contents

The state has its share of extreme weather, prone to nor'easters and to severe winter storms. [4] Summers can bring thunderstorms, averaging around 30 days of thunderstorm activity per year. Massachusetts averages one tornado per year. [5] Massachusetts, like the entire United States eastern seaboard, is vulnerable to hurricanes. Because its location is farther east in the Atlantic Ocean than states farther south, Massachusetts has suffered a direct hit from a major hurricane three times since 1851, the same number of direct hits suffered by the southern Atlantic state of Georgia. [6] More often hurricanes weakened to tropical storm strength pass near Massachusetts. [6]

With the exception of southern Connecticut, Cape Cod and the offshore islands, most of New England has a humid continental climate with hot summers and cold winters. Owing to thick deciduous forests, fall in New England brings bright and colorful foliage attracting tourists. [7] Springs are generally wet and cloudy. Average rainfall generally ranges from 1,000 to 1,500 millimetres or 40 to 60 inches a year. Snowfall can often exceed 100 inches or 2.5 metres annually in the higher elevations. [8]

Climate type

A map of the Humid continental climate zone around the world, including Massachusetts. Humid continental climate (Koppen climate classification).svg
A map of the Humid continental climate zone around the world, including Massachusetts.

Western, central and interior northeastern Massachusetts’ climate is the continental climate type. This is found over large areas of land masses in the temperate regions of the mid-latitudes where there is a zone of conflict between polar and tropical air masses. The humid continental climate is marked by variable weather patterns and a large seasonal temperature variance. Places with at least four months with mean temperatures above 50 °F (10 °C), a coldest monthly temperature below 27 °F (−3 °C), and which do not meet the criteria for a semi-arid climate, are classified as continental. [9] Beverly, Lynn, Boston, and the Interstate 95 corridor southwest of Boston begin a broad transition zone into subtropical or oceanic climates, with slightly warmer winters. The only areas in Massachusetts that are classified as an oceanic climate are Cape Ann, parts of the South Shore and South Coast, Cape Cod and the islands. These areas have a moderate influence by the North Atlantic current, which has an impact on Bermuda and the British Isles as well.

Temperature

Massachusetts sees a wide variety of temperatures throughout the year, the average being as high as 95 °F (35 °C) in the summertime, and as low as -8 °F (-22 °C) in the wintertime. [10] In the capital and largest city of Boston, the hottest month of the year is July, with an average high temperature of 81 °F or 27.2 °C and an average low temperature of 66 °F (18 °C). [10] The coldest month of the year is January, with an average high temperature of 36 °F or 2.2 °C, and an average low temperature of 22 °F or −5.6 °C. [10] Boston has seen 70 °F or 21.1 °C twice in recorded history during February. The highest recorded temperature for February was 73 °F or 22.8 °C on February 23, 2017. The maximum temperature recorded in March was 90 °F or 32.2 °C on March 31, 1998. Spring in Boston can be warm, with temperatures as high as the 90s when winds are offshore, though it is just as possible for a day in late May to remain in the lower 40s due to cool ocean waters. The hottest month is July, with an average high of 82 °F or 27.8 °C and average low of 66 °F or 18.9 °C, with conditions usually humid. [11] Periods exceeding 90 °F or 32.2 °C in summer or below 10 °F or −12.2 °C in winter are not uncommon, but rarely prolonged. The record high temperature in Boston is 104 °F or 40 °C on July 4, 1911, and the record low −18 °F or −27.8 °C, recorded on February 9, 1934. [12]

The highest temperature recorded in Massachusetts is 107 °F or 41.7 °C, recorded August 2, 1975 in New Bedford. [13] The record low temperature in Massachusetts is −40 °F or −40 °C on January 22, 1984 in Chester. [14]

Cooler temperatures in the summertime are seen in the coastal areas of Massachusetts. On Nantucket, the warmest month of the year is July, with an average high temperature of 76 °F or 24.4 °C and an average low temperature of 64 °F or 17.8 °C. [15] Winters in coastal Massachusetts are nearly the same as winters on the mainland. In January, the coldest month of the year, Cape Cod has an average high temperature of 37 °F or 2.8 °C and an average low temperature of 21 °F or −6.1 °C. [15]

Monthly Normal High and Low Temperatures For Various Massachusetts Cities (°F)
CityJanFebMarAprMayJunJulAugSepOctNovDec
Boston [16] 36/2239/2446/3256/4067/5077/5982/6680/6472/5762/4652/3842/28
Worcester [10] 31/1634/1843/2654/3666/4674/5579/6177/6069/5158/4147/3236/22

Extreme weather

Nor'easters

Massachusetts is often hit with storms called "'nor'easters" during the winter months of the year. Nor'easters can be devastating because of two different impacts. First, the spiraling wind that hits land from the northeast, carries humid air from the ocean that can then drop as torrential rain or wet snow causing inland flooding and second, because that same northeast onshore wind can drive ocean surface water to pile up in bays and harbors causing extra high tides topped with tall and powerful waves causing coastal flooding and erosion. The storm is so named because, although the storm generally comes from the southwest, the onshore winds that cause problems in a nor'easter come from the northeast, in the coastal areas of the Northeastern United States and Atlantic Canada. More specifically, it describes a low pressure area whose center of rotation is just off the East Coast and whose leading winds in the left forward quadrant rotate onto land from the northeast. The same weather pattern, if entirely on land or entirely at sea, is not called a Nor'eastern because it does not involve the land-sea interface and don't cause the same weather problems. The precipitation pattern is similar to other extratropical storms. Nor'easters also can cause coastal flooding, coastal erosion, hurricane force winds, and heavy rain or snow. Nor'easters can occur at any time of the year but are mostly known for their presence in the winter season. [17] Most Nor'easters start from a low-pressure system that forms in the south, most often the Gulf of Mexico, and are drawn across to the Northeast by the jet stream. The divergence or diffluence in the upper atmosphere caused by the jet stream removes and disperses the rising air at a faster rate than it is replaced at the surface, which, along with the Coriolis Effect, creates and develops a storm. Their northeast track brings them up the East Coast past the mid-Atlantic and New England coastal states. The counterclockwise flow around a low pressure system brings the warm moist oceanic air over land. The warm moist air meets cold air carried southward by the trough. The deepening low enhances the surrounding pressure gradient, which acts to spiral the very different air masses toward each other at an even faster rate. The greater the temperature differences between the two air masses, the greater the turbulence and instability, and the more severe the storm can become. [17] [18]

If the nor'easter takes the East Coast track, that usually indicates the presence of a high pressure area in the vicinity of Bermuda. [19] The storm will then reach the North Carolina coast and begin to develop. At this time, the nor'easter can move slightly offshore, which would be the more destructive path, or can move slightly inland, which would present mostly rain. If it takes the offshore path, it would begin to rapidly strengthen. The effects would then start reaching the major cities of the Northeast, such as Boston. [17] The storm, now rapidly intensifying, tracks northward. These storms sometimes intensify during their entire existence. The storm moves northward, following the topography of the East Coast. It usually reaches its peak intensity while off the Canadian coast. The storm then reaches Arctic areas, and can reach intensities equal to a strong hurricane. They then meander throughout the North Atlantic and can last for several weeks. [17]

Tornadoes

Massachusetts is seldom hit by tornadoes, but has been part of one particularly notable event, the Flint-Worcester tornado outbreak sequence, on June 9, 1953. The massive Worcester tornado was on the ground for nearly ninety minutes. In that period it traveled 46 miles (74 km), reached 1-mile (1.6 km) in width and injured 1,300 people. At 5:08 P.M., the tornado entered Worcester and grew to an unprecedented width of one mile. [20] Damage was extensive in Worcester (the second largest city in Massachusetts), and caused some of the worst damage of any U.S tornado on record. [20] The hardest-hit areas included Assumption College, where a priest and two nuns were killed; the main building's 3-foot (0.91 m)-thick brick walls were reduced by three floors, and the landmark tower lost three stories. [20] The nearby Burncoat Hill neighborhood saw heavy devastation (especially on its western slope), but it was the Uncatena-Great Brook Valley neighborhoods to the east of Burncoat Hill that were leveled, houses vanished, and debris swept clean from the sites. Forty people died in the Uncatena-Great Brook Valley areas alone. [20] A 12-ton bus was picked up, rolled over several times and thrown against the newly constructed Curtis Apartments in Great Brook Valley, resulting in the deaths of two passengers. The Curtis Apartments blueprints were blown all the way to Duxbury, 75 miles (121 km) away. Across Boylston St. from the Curtis Apartments, the Brookside Home Farm (a city-operated dairy facility and laundry) sustained total damage, with six men killed and the loss of its herd of 80 cattle. Wrecked houses and bodies were blown into Lake Quinsigamond. The six fatalities at Brookside were the most in any particular building in the tornado. Ninety-four people were killed. [20]

The 2011 New England tornado outbreak spawned six tornadoes which killed three people, injured over two hundred, and caused extensive property damage in central and western Massachusetts.

Tropical cyclones

Hurricane Gloria caused 7 deaths in Massachusetts, as well as 84,000 power outages. Hurricane Gloria (1985).JPG
Hurricane Gloria caused 7 deaths in Massachusetts, as well as 84,000 power outages.

Massachusetts has been hit by many notable tropical cyclones. One of these was the New England Hurricane of 1938. The hurricane killed over 682 people, [21] damaged or destroyed over 57,000 homes, and caused property losses estimated at $4.7 billion (2005 US dollars). [22] In 1951 damaged trees and buildings were still to be seen in the affected areas. [23] The eye of the storm followed the Connecticut River north into Massachusetts, where the winds and flooding killed 99 people. [24] In Springfield, the river rose to 6 to 10 feet (2 to 3 m) above flood stage, causing significant damage. Up to 6 inches (152 mm) of rain fell across western Massachusetts, which combined with over 4 inches (102 mm) that had fallen a few days earlier produced widespread flooding. [24] Residents of Ware were stranded for days, and relied on air-dropped food and medicine. [24] After the flood receded, the town's Main Street was left a chasm in which sewer pipes could be seen. To the east, the surge left Falmouth and New Bedford under 8 feet (2.4 m) of water. Two-thirds of all the boats in New Bedford harbor sank. The Blue Hills Observatory registered sustained winds of 121 mph (195 km/h) and a peak gust of 186 mph (299 km/h). [24]

Hurricane Gloria glancingly struck Massachusetts in 1985. On August 19, 1991, Hurricane Bob, a Category 2 hurricane, hit southeastern Massachusetts, Cape Cod and Martha's Vineyard hard, killing 18 people and injuring 190, as well as causing billions of dollars in damage.

Climate data

MonthJanFebMarAprMayJunJulAugSepOctNovDecYear
Record high °F (°C)74
(23)
73
(23)
89
(32)
94
(34)
97
(36)
100
(38)
104
(40)
102
(39)
102
(39)
90
(32)
83
(28)
76
(24)
104
(40)
Mean maximum °F (°C)58.3
(14.6)
57.9
(14.4)
67.0
(19.4)
79.9
(26.6)
88.1
(31.2)
92.2
(33.4)
95.0
(35.0)
93.7
(34.3)
88.9
(31.6)
79.6
(26.4)
70.2
(21.2)
61.2
(16.2)
96.4
(35.8)
Mean daily maximum °F (°C)36.8
(2.7)
39.0
(3.9)
45.5
(7.5)
56.4
(13.6)
66.5
(19.2)
76.2
(24.6)
82.1
(27.8)
80.4
(26.9)
73.1
(22.8)
62.1
(16.7)
51.6
(10.9)
42.2
(5.7)
59.3
(15.2)
Daily mean °F (°C)29.9
(−1.2)
31.8
(−0.1)
38.3
(3.5)
48.6
(9.2)
58.4
(14.7)
68.0
(20.0)
74.1
(23.4)
72.7
(22.6)
65.6
(18.7)
54.8
(12.7)
44.7
(7.1)
35.7
(2.1)
51.9
(11.1)
Mean daily minimum °F (°C)23.1
(−4.9)
24.6
(−4.1)
31.1
(−0.5)
40.8
(4.9)
50.3
(10.2)
59.7
(15.4)
66.0
(18.9)
65.1
(18.4)
58.2
(14.6)
47.5
(8.6)
37.9
(3.3)
29.2
(−1.6)
44.5
(6.9)
Mean minimum °F (°C)4.8
(−15.1)
8.3
(−13.2)
15.6
(−9.1)
31.0
(−0.6)
41.2
(5.1)
49.7
(9.8)
58.6
(14.8)
57.7
(14.3)
46.7
(8.2)
35.1
(1.7)
24.4
(−4.2)
13.1
(−10.5)
2.6
(−16.3)
Record low °F (°C)−13
(−25)
−18
(−28)
−8
(−22)
11
(−12)
31
(−1)
41
(5)
50
(10)
46
(8)
34
(1)
25
(−4)
−2
(−19)
−17
(−27)
−18
(−28)
Average precipitation inches (mm)3.39
(86)
3.21
(82)
4.17
(106)
3.63
(92)
3.25
(83)
3.89
(99)
3.27
(83)
3.23
(82)
3.56
(90)
4.03
(102)
3.66
(93)
4.30
(109)
43.59
(1,107)
Average snowfall inches (cm)14.3
(36)
14.4
(37)
9.0
(23)
1.6
(4.1)
0.0
(0.0)
0.0
(0.0)
0.0
(0.0)
0.0
(0.0)
0.0
(0.0)
0.2
(0.51)
0.7
(1.8)
9.0
(23)
49.2
(125)
Average precipitation days (≥ 0.01 in)11.810.611.611.611.810.99.49.09.010.510.311.9128.4
Average snowy days (≥ 0.1 in)6.66.24.40.80.00.00.00.00.00.20.64.223.0
Average relative humidity (%)62.362.063.163.066.768.568.470.871.868.567.565.466.5
Average dew point °F (°C)16.5
(−8.6)
17.6
(−8.0)
25.2
(−3.8)
33.6
(0.9)
45.0
(7.2)
55.2
(12.9)
61.0
(16.1)
60.4
(15.8)
53.8
(12.1)
42.8
(6.0)
33.4
(0.8)
22.1
(−5.5)
38.9
(3.8)
Mean monthly sunshine hours 163.4168.4213.7227.2267.3286.5300.9277.3237.1206.3143.2142.32,633.6
Percent possible sunshine 56575857596365646360495059
Average ultraviolet index 1245788864215
Source 1: NOAA (relative humidity, dew point and sun 1961−1990) [26] [27] [28]
Source 2: Weather Atlas (UV) [29]
Climate data for Boston, Massachusetts
MonthJanFebMarAprMayJunJulAugSepOctNovDecYear
Average sea temperature °F (°C)41.3
(5.2)
38.1
(3.4)
38.4
(3.5)
43.1
(6.2)
49.2
(9.5)
58.4
(14.7)
65.7
(18.7)
67.9
(20.0)
64.8
(18.2)
59.4
(15.3)
52.3
(11.3)
46.6
(8.2)
52.1
(11.2)
Source: Weather Atlas [29]
Climate data for Worcester Regional Airport (elevation 1,000 feet (300 m)), 1991–2020 normals, extremes 1892–present
MonthJanFebMarAprMayJunJulAugSepOctNovDecYear
Record high °F (°C)67
(19)
71
(22)
84
(29)
91
(33)
94
(34)
98
(37)
102
(39)
99
(37)
99
(37)
91
(33)
79
(26)
72
(22)
102
(39)
Mean maximum °F (°C)55
(13)
54
(12)
64
(18)
78
(26)
85
(29)
88
(31)
90
(32)
88
(31)
84
(29)
75
(24)
66
(19)
58
(14)
91
(33)
Mean daily maximum °F (°C)32.3
(0.2)
35.1
(1.7)
43.0
(6.1)
55.7
(13.2)
66.6
(19.2)
74.5
(23.6)
79.8
(26.6)
78.1
(25.6)
70.7
(21.5)
58.9
(14.9)
47.9
(8.8)
37.5
(3.1)
56.7
(13.7)
Daily mean °F (°C)24.7
(−4.1)
27.0
(−2.8)
34.5
(1.4)
46.1
(7.8)
56.7
(13.7)
65.2
(18.4)
70.8
(21.6)
69.3
(20.7)
61.9
(16.6)
50.6
(10.3)
40.2
(4.6)
30.5
(−0.8)
48.1
(8.9)
Mean daily minimum °F (°C)17.1
(−8.3)
18.9
(−7.3)
26.0
(−3.3)
36.5
(2.5)
46.8
(8.2)
55.9
(13.3)
61.7
(16.5)
60.5
(15.8)
53.2
(11.8)
42.2
(5.7)
32.5
(0.3)
23.4
(−4.8)
39.6
(4.2)
Mean minimum °F (°C)−2
(−19)
1
(−17)
9
(−13)
25
(−4)
36
(2)
45
(7)
54
(12)
52
(11)
40
(4)
29
(−2)
18
(−8)
7
(−14)
−4
(−20)
Record low °F (°C)−19
(−28)
−24
(−31)
−6
(−21)
9
(−13)
27
(−3)
33
(1)
41
(5)
38
(3)
27
(−3)
19
(−7)
3
(−16)
−17
(−27)
−24
(−31)
Average precipitation inches (mm)3.52
(89)
3.26
(83)
4.19
(106)
4.08
(104)
3.56
(90)
4.22
(107)
3.93
(100)
4.14
(105)
4.24
(108)
4.84
(123)
4.00
(102)
4.28
(109)
48.26
(1,226)
Average snowfall inches (cm)18.2
(46)
21.2
(54)
13.7
(35)
1.9
(4.8)
0.0
(0.0)
0.0
(0.0)
0.0
(0.0)
0.0
(0.0)
0.0
(0.0)
1.1
(2.8)
1.9
(4.8)
14.9
(38)
72.9
(185)
Average precipitation days (≥ 0.01 in)12.210.912.412.613.211.811.010.39.511.510.812.2138.4
Average snowy days (≥ 0.1 in)7.57.64.91.20.00.00.00.00.00.31.05.628.1
Source: NOAA [30] [31] [32]
Climate data for Nantucket, Massachusetts (Nantucket Memorial Airport) 1991–2020 normals, extremes 1948–present
MonthJanFebMarAprMayJunJulAugSepOctNovDecYear
Record high °F (°C)63
(17)
59
(15)
66
(19)
83
(28)
85
(29)
92
(33)
92
(33)
100
(38)
86
(30)
83
(28)
74
(23)
63
(17)
100
(38)
Mean maximum °F (°C)54
(12)
51
(11)
57
(14)
66
(19)
75
(24)
81
(27)
84
(29)
84
(29)
79
(26)
73
(23)
64
(18)
58
(14)
86
(30)
Mean daily maximum °F (°C)39.5
(4.2)
40.1
(4.5)
44.2
(6.8)
52.2
(11.2)
60.7
(15.9)
68.7
(20.4)
75.4
(24.1)
75.7
(24.3)
70.4
(21.3)
61.9
(16.6)
52.8
(11.6)
45.1
(7.3)
57.2
(14.0)
Daily mean °F (°C)33.1
(0.6)
33.5
(0.8)
37.9
(3.3)
45.5
(7.5)
53.8
(12.1)
62.2
(16.8)
69.0
(20.6)
69.0
(20.6)
63.7
(17.6)
55.2
(12.9)
46.4
(8.0)
38.6
(3.7)
50.7
(10.4)
Mean daily minimum °F (°C)26.6
(−3.0)
27.0
(−2.8)
31.5
(−0.3)
38.8
(3.8)
47.0
(8.3)
55.7
(13.2)
62.6
(17.0)
62.4
(16.9)
57.0
(13.9)
48.6
(9.2)
40.0
(4.4)
32.2
(0.1)
44.1
(6.7)
Mean minimum °F (°C)10
(−12)
14
(−10)
18
(−8)
28
(−2)
36
(2)
46
(8)
54
(12)
53
(12)
45
(7)
35
(2)
26
(−3)
18
(−8)
8
(−13)
Record low °F (°C)−3
(−19)
−2
(−19)
7
(−14)
20
(−7)
28
(−2)
35
(2)
47
(8)
39
(4)
34
(1)
22
(−6)
16
(−9)
−3
(−19)
−3
(−19)
Average precipitation inches (mm)3.18
(81)
2.84
(72)
3.84
(98)
3.60
(91)
2.98
(76)
3.00
(76)
2.72
(69)
3.00
(76)
3.59
(91)
4.39
(112)
3.79
(96)
3.93
(100)
40.86
(1,038)
Average snowfall inches (cm)7.4
(19)
8.5
(22)
6.6
(17)
0.8
(2.0)
0.0
(0.0)
0.0
(0.0)
0.0
(0.0)
0.0
(0.0)
0.0
(0.0)
0.0
(0.0)
0.2
(0.51)
5.8
(15)
29.4
(75)
Average precipitation days (≥ 0.01 in)11.610.210.511.911.711.611.913.112.513.110.912.4141.4
Source 1: NOAA [33] [34]
Source 2: Western Regional Climate Center (snow 1948–present) [35]

See also

Related Research Articles

<span class="mw-page-title-main">Climate of Virginia</span> Overview of the climate of the U.S. state of Virginia

The climate of Virginia, a state on the east coast of the United States, is mild compared to more northern areas of the United States such as New England and the Midwest. Most of Virginia east of the Blue Ridge mountains, the southern part of the Shenandoah Valley, and the Roanoke Valley, has a humid subtropical climate. In the mountainous areas west of the Blue Ridge, the climate is warm-summer humid continental or oceanic climate. Severe weather, in the form of tornadoes, tropical cyclones, and winter storms, impacts the state on a regular basis. Central Virginia received significant snowfall of 20 inches in December 2009.

Milwaukee has a humid continental climate, with four distinct seasons and wide variations in temperature and precipitation in short periods of time. The city's climate is also strongly influenced by nearby Lake Michigan, which creates two varying climates within the Milwaukee area. The Urban heat island effect also plays a role in the city's climate, insulating it from winter cold, but keeping it cooler in spring and summer.

<span class="mw-page-title-main">Climate of Minnesota</span> Climatic conditions of Minnesota, US

Minnesota has a humid continental climate, with hot summers and cold winters. Minnesota's location in the Upper Midwest allows it to experience some of the widest variety of weather in the United States, with each of the four seasons having its own distinct characteristics. The area near Lake Superior in the Minnesota Arrowhead region experiences weather unique from the rest of the state. The moderating effect of Lake Superior keeps the surrounding area relatively cooler in the summer and warmer in the winter, giving that region a smaller yearly temperature variation. On the Köppen climate classification, much of the southern third of Minnesota—roughly from the Twin Cities region southward—falls in the hot summer zone (Dfa), and the northern two-thirds of Minnesota falls in the warm summer zone (Dfb).

<span class="mw-page-title-main">Climate of California</span> Overview of the climate of the U.S. state of California

The climate of California varies widely from hot desert to alpine tundra, depending on latitude, elevation, and proximity to the Pacific Coast. California's coastal regions, the Sierra Nevada foothills, and much of the Central Valley have a Mediterranean climate, with warmer, drier weather in summer and cooler, wetter weather in winter. The influence of the ocean generally moderates temperature extremes, creating warmer winters and substantially cooler summers in coastal areas.

The climate of Houston is classified as a humid subtropical climate, with tropical influences. August normally ranks as the warmest month at an average temperature of 120 °F (49 °C) and January the coldest month at an average temperature of 25 °F (−4 °C).

Columbus, Ohio has a humid continental climate, characterized by humid, hot summers and cold winters, with no dry season. The Dfa climate has average temperatures above 22 °C during the warmest months, with at least four months averaging above 10 °C, and below 0 °C during the coldest. The climate is transitional with the Cfa humid subtropical climate to the south, characterized by humid, hot summers and cool winters.

<span class="mw-page-title-main">Climate of Florida</span> Climate

The climate of the north and central parts of the U.S. state of Florida is humid subtropical. South Florida has a tropical climate. There is a defined rainy season from May through October when air mass thundershowers that build in the heat of the day drop heavy but brief summer rainfall.

<span class="mw-page-title-main">Climate of Georgia (U.S. state)</span> Overview of the climate of the U.S. state of Georgia

The climate of Georgia is a humid subtropical climate, with most of the state having short, mild winters and long, hot summers. The Atlantic Ocean on the east coast of Georgia and the hill country in the north impact the state's climate. Also, the Chattahoochee River divides Georgia into separate climatic regions with the mountain region to the northwest being cooler than the rest of the state; the average temperatures for the mountain region in January and July are 39 °F (4 °C) and 78 °F (26 °C) respectively. Winter in Georgia is characterized by mild temperatures and little snowfall around the state, with the potential for snow and ice increasing in the northern parts of the state. Summer daytime temperatures in Georgia often exceed 95 °F (35 °C). The state experiences widespread precipitation. Tornadoes and tropical cyclones are common.

<span class="mw-page-title-main">Climate of the United States</span> Varies due to changes in latitude, and a range of geographic features

The climate of the United States varies due to changes in latitude, and a range of geographic features, including mountains and deserts. Generally, on the mainland, the climate of the U.S. becomes warmer the further south one travels, and drier the further west, until one reaches the West Coast.

<span class="mw-page-title-main">Climate of North Carolina</span> Overview of the climate of the U.S. state of North Carolina

North Carolina's climate varies from the Atlantic coast in the east to the Appalachian Mountain range in the west. The mountains often act as a "shield", blocking low temperatures and storms from the Midwest from entering the Piedmont of North Carolina.

<span class="mw-page-title-main">Climate of South Carolina</span> Overview of the climate of the U.S. state of South Carolina

South Carolina has a humid subtropical climate, with hot summers throughout most of the state. But, an exception does occur in the Blue Ridge Mountains, as outlier pockets of an Oceanic Climate do exist. Mild winters predominate in the eastern and southern part of the state, but cool to occasionally cold winters are the standard in the northwestern area of the state, especially areas at or above 600 feet in elevation. On average, between 40 and 80 inches of precipitation falls annually across the state, potentially even in excess of 100 inches in portions of the Appalachian temperate rainforest. Tropical cyclones, and afternoon thunderstorms due to hot and humid conditions, contribute to precipitation during the summer and sometimes fall months, while extratropical cyclones contribute to precipitation during the fall, winter, and spring months. The coast experiences nearly all of their tropical weather impacts from storms coming directly from the Atlantic coast. The northwestern area of the state can receive impacts from both Atlantic basin storms moving westward from the coast and also occasionally very heavy rainfall and flooding from storms originating from the Gulf of Mexico that move inland towards the northeast after making landfall from the Florida Panhandle to Louisiana.

<span class="mw-page-title-main">Geography of Connecticut</span> Overview of the Geography of Connecticut

The U.S. state of Connecticut is bordered on the south by Long Island Sound, on the west by New York, on the north by Massachusetts, and on the east by Rhode Island. The state capital and fourth largest city is Hartford, and other major cities and towns include Bridgeport, New Haven, Stamford, Waterbury, Norwalk, Danbury, New Britain, Greenwich, and Bristol. There are 169 incorporated towns in Connecticut, with cities and villages included within some towns.

<span class="mw-page-title-main">Climate of New York (state)</span> Overview of the climate of the U.S. state of New York

The climate of New York (state) is generally humid continental, while the extreme southeastern portion of the state lies in the warmer humid subtropical climate zone. Winter temperatures average below freezing during January and February in much of the state of New York, but several degrees above freezing along the Atlantic coastline, including New York City.

<span class="mw-page-title-main">Climate of the Tampa Bay area</span>

The Tampa Bay area has a humid subtropical climate, closely bordering a tropical climate near the waterfront areas. There are two basic seasons in the Tampa Bay area, a hot and wet season from May through October, and a mild and dry season from November through April.

<span class="mw-page-title-main">Climate of Miami</span> Overview of the climate of Miami

The climate of Miami is classified as having a tropical monsoon climate with hot and humid summers; short, warm winters; and a marked drier season in the winter. Its sea-level elevation, coastal location, position just above the Tropic of Cancer, and proximity to the Gulf Stream shape its climate.

<span class="mw-page-title-main">Climate of Alabama</span> Overview of the climate of the U.S. state of Alabama

The state of Alabama is classified as humid subtropical (Cfa) under the Köppen climate classification. The state's average annual temperature is 64 °F (18 °C). Temperatures tend to be warmer in the state's southern portion with its proximity to the Gulf of Mexico, while its northern portions, especially in the Appalachian Mountains in the northeast, tend to be slightly cooler. Alabama generally has hot, humid summers and mild winters with copious precipitation throughout the year. The state receives an average of 56 inches (1,400 mm) of rainfall each year and experiences a lengthy growing season of up to 300 days in its southern portion. Hailstorms occur occasionally during the spring and summer here, but they are seldom destructive. Heavy fogs are rare, and they are confined chiefly to the coast. Thunderstorms also occur year-around. They are most common in the summer, but they are most commonly severe during the spring and late autumn. That is when destructive winds and tornadoes occur frequently, especially in the northern and central parts of the state. Central and northern Alabama are squarely within Dixie Alley, the primary area in the U.S. outside the Southern Plains with relatively high tornado risk. Alabama is ranked second in the U.S for the deadliest tornadoes. Hurricanes are quite common in the state, especially in the southern part. Major hurricanes occasionally strike the coast, such as Hurricane Frederic in September 1979 and Hurricane Ivan in September 2004; both storms resulted in significant to devastating damage in the Mobile area.

<span class="mw-page-title-main">Climate of Allentown, Pennsylvania</span> Overview of the climate of Allentown, Pennsylvania, United States

The climate of Allentown, Pennsylvania is classified as a humid continental climate. Allentown's warmest month is July with a daily average temperature of 74.7 °F (23.7 °C) and the coldest month being January with a daily average of 29.4 °F (−1.4 °C). The average precipitation of Allentown is 45.35 inches (1,152 mm) per year.

<span class="mw-page-title-main">Cold-core low</span> Cyclone with an associated cold pool of air at high altitude

A cold-core low, also known as an upper level low or cold-core cyclone, is a cyclone aloft which has an associated cold pool of air residing at high altitude within the Earth's troposphere, without a frontal structure. It is a low pressure system that strengthens with height in accordance with the thermal wind relationship. If a weak surface circulation forms in response to such a feature at subtropical latitudes of the eastern north Pacific or north Indian oceans, it is called a subtropical cyclone. Cloud cover and rainfall mainly occurs with these systems during the day.

<span class="mw-page-title-main">Climate of New England</span> Overview of the climate of New England

The climate of New England varies greatly across its 500-mile (800 km) span from northern Maine to southern Connecticut.

<span class="mw-page-title-main">2014–15 North American winter</span> Winter season in North America

The 2014–15 North American winter was frigid and prolifically wintry, especially across the eastern half of North America in the months of January–March. The season began early, with many places in North America experiencing their first wintry weather during mid-November. A period of below-average temperatures affected much of the contiguous United States, and several records were broken. An early trace of snowfall was recorded in Arkansas. There were greater accumulations of snow across parts of Oklahoma as well. A quasi-permanent phenomenon referred to as the polar vortex may have been partly responsible for the cold weather. Temperatures in much of the United States dropped 15 to 35 °F below average by November 19, following a southward "dip" of the polar vortex into the eastern two-thirds of the country. The effects of this dip were widespread, bringing about temperatures as low as 28 °F (−2 °C) in Pensacola, Florida. Following a significant snowstorm there, Buffalo, New York received several feet of snow from November 17–21. In addition, significant winter weather occurred throughout the season, including a major blizzard that struck the Northeastern United States at the end of January, another blizzard that affected much of the Northern United States days later in early February, and several significant snow events paired with very frigid temperatures for much of February.

References

  1. "Humid continental climate map". The Weather Channel . Retrieved 2008-07-01.[ dead link ]
  2. 1 2 "Climate Data (Massachusetts)". NOAA. Archived from the original on 2008-06-19. Retrieved 2008-07-01.
  3. "Boston, MA- History and Almanac". Weather Underground. Archived from the original on 2008-07-01. Retrieved 2008-07-01.
  4. Multi-Community Environmental Storm Observatory (2006). "Nor'easters". Archived from the original on 2008-06-10. Retrieved 2008-07-01.
  5. "Monthly tornado averages by state and region". U.S. Tornadoes. March 19, 2013. Archived from the original on August 23, 2016. Retrieved August 12, 2016.
  6. 1 2 US Mainland Strikes per State 1851-2004 Archived 2007-06-08 at the Wayback Machine . National Hurricane Center. Retrieved July 2, 2008.
  7. "New England's Fall Foliage". Discover New England. Archived from the original on 2008-06-21. Retrieved 2008-07-01.
  8. "New England," Microsoft Encarta Online Encyclopedia 2006
  9. Peel, M. C.; Finlayson B. L.; McMahon, T. A. (2007). "Updated world map of the Köppen-Geiger climate classification". Hydrol. Earth Syst. Sci. 11 (5): 1633–1644. Bibcode:2007HESS...11.1633P. doi: 10.5194/hess-11-1633-2007 . ISSN   1027-5606. Archived from the original on 2017-02-10. Retrieved 2008-07-01.(direct: Final Revised Paper Archived 2012-02-03 at the Wayback Machine )
  10. 1 2 3 4 "Daily temperature and precipitation records at Worcester, MA". NOAA. Archived from the original on 2008-08-04. Retrieved 2008-07-01.
  11. "Boston Daily Normals". NWS Taunton, MA. 2006. Archived from the original on 2008-10-07. Retrieved 2008-07-02.
  12. "Boston Temperature Records". NWS Taunton, MA. 2006. Archived from the original on 2008-12-18. Retrieved 2008-07-02.
  13. "State Climate Extremes Committee Massachusetts Record Temperatures". NOAA National Centers for Environmental Information. Archived from the original on 2020-07-05. Retrieved 2020-07-05.
  14. "Weather Extremes: Some Errors in the NCDC U.S.A. State Weather Extreme Records Data: Part 2". Weather Underground. Archived from the original on 2015-10-12. Retrieved 2020-07-05.
  15. 1 2 "MONTHLY AVERAGES for Hyannis, MA". The Weather Channel. Archived from the original on 2011-05-22. Retrieved 2008-07-02.
  16. "Daily temperature and precipitation records at Boston, MA". NOAA. Archived from the original on 2008-12-18. Retrieved 2008-07-01.
  17. 1 2 3 4 Multi-Community Environmental Storm Observatory (2006). "Nor'easters". Archived from the original on 2007-10-09. Retrieved 2008-01-22.
  18. Storm-E (2007). "Nor'easters". Archived from the original on 2007-06-26. Retrieved 2008-01-22.
  19. Weather channel (2007). "Nor'easters". Weather Channel. Archived from the original on 2008-01-13. Retrieved 2008-01-22.
  20. 1 2 3 4 5 Pombo, Jamy. "Worcester Tornado: 50 Years Later". The Boston Channel.com (WCVB). Archived from the original on 2008-06-02. Retrieved 2008-07-03.
  21. Scotti, R. A. "Sudden Sea - The Great Hurricane of 1938". Boston: Little, Brown & Co., 2003. Archived from the original on January 2, 2007. Retrieved 2007-11-30.
  22. "The Great Hurricane of 1938". The Boston Globe. Boston.com. 2005-07-19. Archived from the original on 2012-10-18. Retrieved 2007-11-30.
  23. Lane, F.W. The Elements Rage (David & Charles 1966, ISBN ), p.16
  24. 1 2 3 4 Galvin, John. "The New England Hurricane: New York, Connecticut, Rhode Island, Massachusetts, Vermont, September 1938". Popular Mechanics. Archived from the original on 2008-10-24. Retrieved 2008-07-03.
  25. ThreadEx
  26. "Summary of Monthly Normals 1991–2020". National Oceanic and Atmospheric Administration. Retrieved May 4, 2021.
  27. "NowData – NOAA Online Weather Data". National Oceanic and Atmospheric Administration . Retrieved May 24, 2021.
  28. "WMO Climate Normals for BOSTON/LOGAN INT'L AIRPORT, MA 1961–1990". National Oceanic and Atmospheric Administration. Retrieved July 18, 2020.
  29. 1 2 "Boston, Massachusetts, USA - Monthly weather forecast and Climate data". Weather Atlas. Retrieved July 4, 2019.
  30. "NowData – NOAA Online Weather Data". National Oceanic and Atmospheric Administration. Archived from the original on November 13, 2020. Retrieved May 30, 2021.
  31. "Threaded Extremes". Archived from the original on March 5, 2020. Retrieved November 9, 2010.
  32. "Station: Worcester RGNL AP, MA". U.S. Climate Normals 2020: U.S. Monthly Climate Normals (1991-2020). National Oceanic and Atmospheric Administration. Archived from the original on 2021-06-02. Retrieved May 30, 2021.
  33. "NowData – NOAA Online Weather Data". National Oceanic and Atmospheric Administration. Archived from the original on June 8, 2017. Retrieved May 30, 2021.
  34. "Station: Nantucket Mem AP, MA". U.S. Climate Normals 2020: U.S. Monthly Climate Normals (1991–2020). National Oceanic and Atmospheric Administration. Archived from the original on 2022-05-31. Retrieved May 30, 2021.
  35. "General Climate Summary Tables". Western Regional Climate Center. Archived from the original on March 1, 2020. Retrieved February 19, 2015.
  1. Mean monthly maxima and minima (i.e. the expected highest and lowest temperature readings at any point during the year or given month) calculated based on data at said location from 1991 to 2020.
  2. Official records for Boston were kept at downtown from January 1872 to December 1935, and at Logan Airport (KBOS) since January 1936. [25]