Climate of San Diego

Last updated

San Diego
Climate chart (explanation)
J
F
M
A
M
J
J
A
S
O
N
D
 
 
2
 
 
66
47
 
 
2.3
 
 
67
49
 
 
1.8
 
 
68
53
 
 
0.8
 
 
68
56
 
 
0.1
 
 
69
59
 
 
0.1
 
 
71
62
 
 
0
 
 
75
65
 
 
0
 
 
76
67
 
 
0.2
 
 
76
65
 
 
0.6
 
 
73
61
 
 
1
 
 
69
54
 
 
1.5
 
 
65
45
Average max. and min. temperatures in °F
Precipitation totals in inches
Source:NWS [1]
Metric conversion
J
F
M
A
M
J
J
A
S
O
N
D
 
 
50
 
 
19
8
 
 
58
 
 
19
10
 
 
46
 
 
20
12
 
 
20
 
 
20
13
 
 
3
 
 
20
15
 
 
1.8
 
 
22
17
 
 
0.8
 
 
24
19
 
 
0.5
 
 
24
19
 
 
3.8
 
 
24
18
 
 
14
 
 
23
16
 
 
26
 
 
21
12
 
 
39
 
 
18
7
Average max. and min. temperatures in °C
Precipitation totals in mm

The climate of San Diego, California is classified as a hot-summer Mediterranean climate (Köppen climate classification Csa). The basic climate features hot, sunny, and dry summers, and cooler, wetter winters. However, San Diego is much more arid than typical Mediterranean climates, and winters are still dry compared with most other zones with this type of climate. [2] The climate at San Diego International Airport, the location for official weather reports for San Diego, as well as the climate at most beach areas, straddles the border between BSh and BSk due to the mild winters and cool summers in these locations.

Contents

Temperatures

Average monthly temperatures range from 57.3 °F (14.1 °C) in January to 72 °F (22 °C) in August.[ citation needed ] On average, 344 days a year are hotter than 60 °F (16 °C), but only 25 days are hotter than 80 °F (27 °C). [3]

Late summer and early autumn are typically the hottest times of the year with an average high of 78 °F (26 °C) in August and 77 °F (25 °C) in September. [4] Temperatures occasionally reach 90 °F (32 °C) or higher. [5] Snow and ice are rare in the wintertime, typically occurring only inland from the coast when present.

San Diego experiences marine layer clouds, most often between May and August, which cause cool temperatures, cloudy weather and fog in the morning. Marine layer conditions linger until the heat of the sun becomes strong enough to evaporate the clouds. The local sayings "May gray" and "June gloom" refer to the way in which San Diego has the most trouble shaking off the early morning fog during those months, and cool, cloudy conditions often last into the afternoon or even all day. [6] [7]

Temperatures soar to very high readings only on rare occasions, chiefly when easterly winds (known as the "Santa Ana winds") bring hot, dry air from the inland deserts. Although confusing to tourists, newcomers, and out-of-the-region newscasters, this makes October the fire season for San Diego and the rest of Southern California due to low precipitation and sporadic heat waves that the average monthly temperatures do not immediately show. For example, the months with the highest record high temperatures are September at 111 °F (44 °C) and October at 107 °F (42 °C). [4]

The record high temperature at the National Weather Service office in San Diego of 111 °F (44 °C) was on September 26, 1963. The record low temperature was 25 °F (−4 °C) on January 7, 1913. [8] The record high temperature was tied only once and happened on September 27, 2010, 47 years and two days after the set record. Several cities near San Diego, including Los Angeles, broke their all-time records that day. [9]

Precipitation

San Diego on average has 146 sunny days and 117 partly cloudy days a year. The average annual precipitation is less than 12 inches (30 cm), resulting in a borderline arid climate. Rainfall is strongly concentrated in the cooler half of the year, particularly the months December through March, although precipitation is lower than any other part of the U.S. west coast. While the summer months are virtually rainless, subtropical moisture from the North American Monsoon usually results in increased humidity and thunderstorms for at least a few days each summer. Rainfall is highly variable from year to year and from month to month, and San Diego is subject to both droughts and floods. While hurricanes are very rare, San Diego receives more tropical storms and remnants of tropical storms than anywhere else in California. Famous examples include the 1858 San Diego Hurricane and the 1939 California tropical storm, as well as the remnants of Hurricane Kathleen in 1976, all of which brought several inches of rain and high winds to San Diego. Inland areas like El Cajon can receive over 20 inches (51 cm) per year on average; further inland at higher elevations in the Cleveland National Forest receive more yet, and some areas like Palomar Mountain average more than 40 inches (100 cm) of rainfall per year.

At the National Weather Service office, there are an average of 41 days with measurable precipitation. The wettest year was 1941 with 24.93 inches (63.3 cm) and the driest year was 1953 with 3.23 inches (8.2 cm). The most rainfall in one month was 9.09 inches (23.1 cm) in January 1993. The most rainfall in 24 hours was 3.23 inches (8.2 cm) on April 5, 1926. [10]

Snow

Snow has been recorded falling on lowland San Diego communities only five times in over 125 years of record-keeping. [11] Snow flurries were last seen in San Diego on February 14, 2008 around 1,700 to 1,800 feet (520 to 550 m), and the last measurable snowfall to hit various neighborhoods and suburbs around the city fell on December 13, 1967. In winter, light snow is common in mountainous regions of east and north San Diego County (including Ramona and Julian) above 3,000–4,000 feet (910–1,220 m). [12]

Variation

Climate in the San Diego area often varies dramatically over short geographical distances, due to the city's topography (the Bay, and the numerous hills, mountains, and canyons), thus exhibiting microclimate: frequently, particularly during the "May gray / June gloom" period, a thick "marine layer" cloud cover will keep the air cool and damp within a few miles of the coast, but will yield to bright cloudless sunshine between about 5 and 15 miles (8 and 24 km) inland—the cities of El Cajon and Santee for example, rarely experience the cloud cover.

Compared to national averages

On average, San Diego sees 21 days with some precipitation while the rest of the country sees about 110. The national average for mostly sunny days is 213 while San Diego's is 267. San Diego's annual snowfall is 0 inches per year while the nation usually sees an average of 24.2 inches (610 mm) per year. The United States average for days above 90 °F (32 °C) is 37.9 days while San Diego's is only 2.5 days, and there are, on average 0 days below 32 °F (0 °C) in San Diego, while the national average is 88 days. The average low temperature in January for the country is 26.5 °F (−3.1 °C), and for San Diego it is 50 °F (10 °C). The average high temperature in July for San Diego is 76 °F (24 °C). The national average is 86.8 °F (30.4 °C). [10]

Data

MonthJanFebMarAprMayJunJulAugSepOctNovDecYear
Record high °F (°C)88
(31)
91
(33)
99
(37)
98
(37)
98
(37)
101
(38)
100
(38)
98
(37)
111
(44)
107
(42)
100
(38)
88
(31)
111
(44)
Mean maximum °F (°C)78.8
(26.0)
78.6
(25.9)
80.2
(26.8)
82.1
(27.8)
79.3
(26.3)
79.6
(26.4)
82.9
(28.3)
85.2
(29.6)
90.6
(32.6)
87.8
(31.0)
85.4
(29.7)
77.0
(25.0)
94.0
(34.4)
Average high °F (°C)66.4
(19.1)
66.2
(19.0)
67.0
(19.4)
68.8
(20.4)
69.5
(20.8)
71.7
(22.1)
75.3
(24.1)
77.3
(25.2)
77.2
(25.1)
74.6
(23.7)
70.7
(21.5)
66.0
(18.9)
70.9
(21.6)
Daily mean °F (°C)58.4
(14.7)
59.0
(15.0)
60.7
(15.9)
62.9
(17.2)
64.8
(18.2)
67.2
(19.6)
70.7
(21.5)
72.4
(22.4)
71.7
(22.1)
68.1
(20.1)
62.7
(17.1)
57.9
(14.4)
64.7
(18.2)
Average low °F (°C)50.3
(10.2)
51.8
(11.0)
54.5
(12.5)
57.1
(13.9)
60.0
(15.6)
62.6
(17.0)
66.1
(18.9)
67.5
(19.7)
66.2
(19.0)
61.5
(16.4)
54.8
(12.7)
49.8
(9.9)
58.5
(14.7)
Mean minimum °F (°C)43.7
(6.5)
46.1
(7.8)
48.7
(9.3)
51.9
(11.1)
55.8
(13.2)
59.3
(15.2)
63.0
(17.2)
63.9
(17.7)
61.8
(16.6)
55.5
(13.1)
48.2
(9.0)
43.0
(6.1)
42.6
(5.9)
Record low °F (°C)25
(−4)
34
(1)
36
(2)
39
(4)
45
(7)
50
(10)
54
(12)
54
(12)
50
(10)
43
(6)
36
(2)
32
(0)
25
(−4)
Average precipitation inches (mm)1.98
(50)
2.20
(56)
1.46
(37)
0.65
(17)
0.28
(7.1)
0.05
(1.3)
0.08
(2.0)
0.01
(0.25)
0.12
(3.0)
0.50
(13)
0.79
(20)
1.67
(42)
9.79
(249)
Average precipitation days (≥ 0.01 in)6.57.16.23.82.20.70.70.30.92.43.75.840.3
Average relative humidity (%)63.165.767.367.070.674.074.674.172.769.466.363.769.0
Average dew point °F (°C)42.8
(6.0)
45.3
(7.4)
47.3
(8.5)
49.5
(9.7)
53.1
(11.7)
57.0
(13.9)
61.2
(16.2)
62.4
(16.9)
60.6
(15.9)
55.6
(13.1)
48.6
(9.2)
43.2
(6.2)
52.2
(11.2)
Mean monthly sunshine hours 239.3227.4261.0276.2250.5242.4304.7295.0253.3243.4230.1231.33,054.6
Percent possible sunshine 75747071585770716869737469
Source: NOAA (sun, relative humidity, and dew point 1961–1990) [14] [15] [16]

See or edit raw graph data.

Sea temperatures

Average annual temperature of sea is 65 °F (18 °C), from 59 °F (15 °C) in January to 72 °F (22 °C) in August. [17] Water temperatures have risen since 1950 as measured at Scripps Pier. [18]

Average sea temperature [17]
JanFebMarAprMayJunJulAugSepOctNovDec
59 °F (15 °C)61 °F (16 °C)61 °F (16 °C)62 °F (17 °C)64 °F (18 °C)67 °F (19 °C)70 °F (21 °C)72 °F (22 °C)70 °F (21 °C)68 °F (20 °C)65 °F (18 °C)62 °F (17 °C)

Santa Anas

The months of September through April bring warm winds from the desert called "Santa Anas". Occurring about 10 days out of the year, these winds bring sometimes hot, but always dry conditions. Inland, and in mountain passes and canyons, they can burst out in gusts of 100 miles per hour (160 km/h) and can lower relative humidity to single digits, although by the coast they rarely see gusts of over 40 miles per hour (64 km/h). They can spread and worsen wildfires. Because these winds blow from east to west, common perception is that they are pulling hot air from the desert. However, it is not uncommon during a Santa Ana condition for the coast to be even hotter than the desert regions. The Santa Ana winds are actually warm due to barometric pressure increases: As the air is pulled down to sea level from the higher altitudes of the Great Basin and Rocky Mountains to the east, it is compressed and its temperature rises. [19]

Hurricanes

Since the track of most hurricanes is well to the south of San Diego, and the cold California Current (normally sea temperatures are only in the upper 60's F off the CA coast) keeps ocean water significantly colder than in the Gulf of Mexico and western Atlantic (often sea temperatures over 82 F), tropical cyclones rarely impact San Diego. Most northwestward moving tropical cyclones dissipate over Baja California and fail to bring any precipitation to San Diego. The only tropical cyclone known to impact San Diego as a hurricane in around 200 years of record-keeping was the 1858 San Diego Hurricane. Two more cyclones managed to bring tropical storm-force winds to Southern California: the 1939 California tropical storm and the Hurricane Kathleen (1976). Average surface temperature of the water at Scripps Pier in the California Current has increased by almost 3 degrees since 1950, according to scientists at Scripps Institution of Oceanography. [18]

May and June clouds

During the months of May and June, the marine layer brings cloudiness that covers coastal and nearby inland communities. Some call it "May Gray", or "June Gloom".

Southern Oscillation

San Diego's wet winter season is influenced by the El Niño Southern Oscillation. During the El Niño phase, San Diego receives more winter storms with warmer and more humid conditions. During the La Niña phase, San Diego becomes drier with cooler and less humid conditions.

Ultraviolet index

Ultraviolet index [20]
JanFebMarAprMayJunJulAugSepOctNovDecYear
3468910101086436.7

See also

Notes

  1. Mean monthly maxima and minima (i.e. the highest and lowest temperature readings during an entire month or year) calculated based on data at said location from 1991 to 2020.
  2. Official precipitation records for San Diego were kept at the Weather Bureau Office in downtown from October 1850 to December 1859 at the Mission San Diego and from November 1871 to June 1939 and a variety of buildings at downtown, and at San Diego Int'l (Lindbergh Field) since July 1939. [13] Temperature records, however, only date from October 1874. For more information on data coverage, see ThreadEx

Related Research Articles

<span class="mw-page-title-main">June Gloom</span> Weather phenomenon where clouds develop and temperatures cool over coastal California

June Gloom is a California term for a weather pattern that results in cloudy, overcast skies with cool temperatures during the late spring and early summer. While it is most common in the month of June, it can occur in surrounding months, giving rise to other colloquialisms, such as “Graypril,” "May Gray," "No-Sky July," and "Fogust." Low-altitude stratus clouds form over the cool water of the California Current, and spread overnight into the coastal regions of California.

The climate of Salt Lake City, Utah features cold and snowy winters, hot and dry summers, and modest to light seasonal rainfall. Lying in the Salt Lake Valley, the city is surrounded by mountains and the Great Salt Lake. Under the Köppen climate classification, Salt Lake City has either a Mediterranean climate (Csa) or dry-summer continental climate (Dsa) depending on which variant of the system is used, though it borders on a cold semi-arid climate (BSk) due to the city's relatively low precipitation.

<span class="mw-page-title-main">Climate of Puerto Rico</span> Predominantly tropical rainforest in the Köppen climate classification

The climate of Puerto Rico in the Köppen climate classification is predominantly tropical rainforest. Temperatures throughout the year are warm to hot, averaging near 85 °F (29 °C) in lower elevations and 70 °F (21 °C) in the mountains. Easterly trade winds pass across the island year round while the rainy season stretches from April into November. The relatively cool trade winds are blocked by the mountains of the Cordillera Central which causes rain shadows and sharp variations in the temperature and wind speed over short distances. About a quarter of the average annual rainfall for Puerto Rico occurs during tropical cyclones, which are more frequent during La Niña years.

<span class="mw-page-title-main">Climate of California</span> Overview of the climate of the U.S. state of California

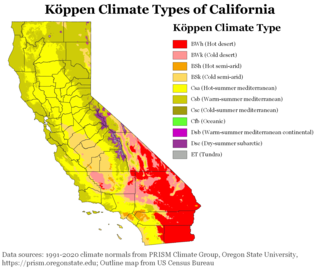
The climate of California varies widely from hot desert to alpine tundra, depending on latitude, elevation, and proximity to the Pacific Coast. California's coastal regions, the Sierra Nevada foothills, and much of the Central Valley have a Mediterranean climate, with warmer, drier weather in summer and cooler, wetter weather in winter. The influence of the ocean generally moderates temperature extremes, creating warmer winters and substantially cooler summers in coastal areas.

The climate of Houston is classified as a humid subtropical climate, with tropical influences. August normally ranks as the warmest month at 84.6 °F (29.2 °C) and January the coldest month at 53.1 °F (11.7 °C).

<span class="mw-page-title-main">Climate of Florida</span> Climate

The climate of the north and central parts of the US state of Florida is humid subtropical. South Florida has a tropical climate. There is a defined rainy season from May through October when air mass thundershowers that build in the heat of the day drop heavy but brief summer rainfall.

<span class="mw-page-title-main">Climate of Texas</span> Overview of the climate of the U.S. state of Texas

Texas' weather varies widely, from arid in the west to humid in the east. The huge expanse of Texas encompasses several regions with distinctly different climates: Northern Plains, Trans-Pecos Region, Texas Hill Country, Piney Woods, and South Texas. Generally speaking, the part of Texas that lies to the east of Interstate 35 is subtropical, while the portion that lies to the west of Interstate 35 is arid desert.

<span class="mw-page-title-main">Climate of Georgia (U.S. state)</span> Overview of the climate of the U.S. state of Georgia

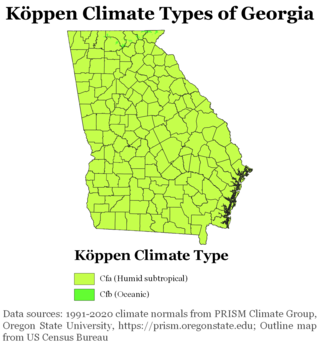
The climate of Georgia is a humid subtropical climate, with most of the state having short, mild winters and long, hot summers. The Atlantic Ocean on the east coast of Georgia and the hill country in the north impact the state's climate. Also, the Chattahoochee River divides Georgia into separate climatic regions with the mountain region to the northwest being cooler than the rest of the state; the average temperatures for the mountain region in January and July are 39 °F (4 °C) and 78 °F (26 °C) respectively. Winter in Georgia is characterized by mild temperatures and little snowfall around the state, with the potential for snow and ice increasing in the northern parts of the state. Summer daytime temperatures in Georgia often exceed 95 °F (35 °C). The state experiences widespread precipitation. Tornadoes and tropical cyclones are common.

<span class="mw-page-title-main">Climate of the United States</span> Varies due to changes in latitude, and a range of geographic features

The climate of the United States varies due to changes in latitude, and a range of geographic features, including mountains and deserts. Generally, on the mainland, the climate of the U.S. becomes warmer the further south one travels, and drier the further west, until one reaches the West Coast.

<span class="mw-page-title-main">Climate of North Carolina</span> Overview of the climate of the U.S. state of North Carolina

North Carolina's climate varies from the Atlantic coast in the east to the Appalachian Mountain range in the west. The mountains often act as a "shield", blocking low temperatures and storms from the Midwest from entering the Piedmont of North Carolina.

<span class="mw-page-title-main">Climate of South Carolina</span> Overview of the climate of the U.S. state of South Carolina

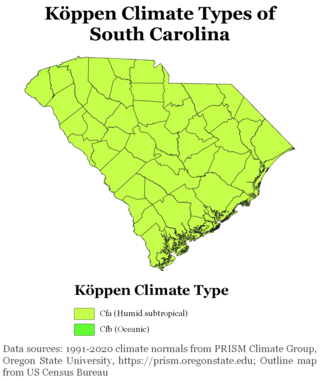
South Carolina has a humid subtropical climate, with hot summers throughout most of the state. But, an exception does occur in the Blue Ridge Mountains, as outlier pockets of an Oceanic Climate do exist. Mild winters predominate in the eastern and southern part of the state, but cool to occasionally cold winters are the standard in the northwestern area of the state, especially areas at or above 600 feet in elevation. On average, between 40 and 80 inches of precipitation falls annually across the state, potentially even in excess of 100 inches in portions of the Appalachian temperate rainforest. Tropical cyclones, and afternoon thunderstorms due to hot and humid conditions, contribute to precipitation during the summer and sometimes fall months, while extratropical cyclones contribute to precipitation during the fall, winter, and spring months. The coast experiences nearly all of their tropical weather impacts from storms coming directly from the Atlantic coast. The northwestern area of the state can receive impacts from both Atlantic basin storms moving westward from the coast and also occasionally very heavy rainfall and flooding from storms originating from the Gulf of Mexico that move inland towards the northeast after making landfall from the Florida Panhandle to Louisiana.

<span class="mw-page-title-main">Climate of Japan</span> Overview of the Climate of Japan

Most regions of Japan, such as Honshu, Shikoku, and Kyushu, belong to the temperate zone with humid subtropical climate characterized by four distinct seasons. However, its climate varies from cool humid continental climate in the north such as northern Hokkaido, to warm tropical rainforest climate in the south such as the Yaeyama Islands and Minami-Tori-shima.

<span class="mw-page-title-main">Climate of Massachusetts</span> Overview of the climate of Massachusetts

The climate of Massachusetts is mainly a humid continental climate, with hot, humid summers and cold, snowy winters and abundant precipitation. Massachusetts is a state located in the New England region of the northeastern United States. Most of its population of 7.0 million live in the Boston metropolitan area. The eastern half of this relatively small state is mostly urban and suburban. Massachusetts is the most populous of the six New England states and ranks third in the nation by population density and fourth by GDP per capita. Massachusetts receives about 43 inches or 1,090 millimetres of rain annually, fairly evenly distributed throughout the year, slightly wetter during the winter. Summers are warm with average high temperatures in July above 80 °F or 26.7 °C and overnight lows above 60 °F or 15.6 °C common throughout the state. Winters are cold, but generally less extreme on the coast with high temperatures in the winter averaging above freezing even in January, although areas further inland are much colder. The state does have extreme temperatures from time to time with 100 °F or 37.8 °C in the summer and temperatures below 0 °F or −17.8 °C in the winter not being unusual.

<span class="mw-page-title-main">Climate of Mexico</span> Overview of the climate of Mexico

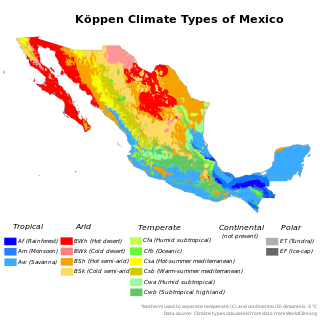
The climate of Mexico is very varied. The Tropic of Cancer effectively divides the country into temperate and tropical zones. Land that is north of the twenty-fourth parallel experiences lower temperatures during the winter months. South of the twenty-fourth parallel, temperatures are fairly consistent all year round and vary solely as a function of elevation. The north of the country usually receives less precipitation than the south.

<span class="mw-page-title-main">Climate of Los Angeles</span>

The climate of Los Angeles is mild to hot year-round, and mostly dry. It is classified as a Mediterranean climate, which is a type of dry subtropical climate. It is characterized by seasonal changes in rainfall—with a dry summer and a winter rainy season. Under the modified Köppen climate classification, the coastal areas are classified as Csb, and the inland areas as Csa.

<span class="mw-page-title-main">Climate of the Tampa Bay area</span>

The Tampa Bay area has a humid subtropical climate, closely bordering a tropical climate near the waterfront areas. There are two basic seasons in the Tampa Bay area, a hot and wet season from May through October, and a mild and dry season from November through April.

<span class="mw-page-title-main">Climate of Alabama</span> Overview of the climate of the U.S. state of Alabama

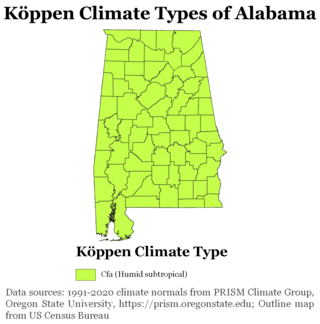
The state of Alabama is classified as humid subtropical (Cfa) under the Köppen climate classification. The state's average annual temperature is 64 °F (18 °C). Temperatures tend to be warmer in the state's southern portion with its proximity to the Gulf of Mexico, while its northern portions, especially in the Appalachian Mountains in the northeast, tend to be slightly cooler. Alabama generally has hot, humid summers and mild winters with copious precipitation throughout the year. The state receives an average of 56 inches (1,400 mm) of rainfall each year and experiences a lengthy growing season of up to 300 days in its southern portion. Hailstorms occur occasionally during the spring and summer here, but they are seldom destructive. Heavy fogs are rare, and they are confined chiefly to the coast. Thunderstorms also occur year-around. They are most common in the summer, but they are most commonly severe during the spring and late autumn. That is when destructive winds and tornadoes occur frequently, especially in the northern and central parts of the state. Central and northern Alabama are squarely within Dixie Alley, the primary area in the U.S. outside the Southern Plains with relatively high tornado risk. Alabama is ranked second in the U.S for the deadliest tornadoes. Hurricanes are quite common in the state, especially in the southern part. Major hurricanes occasionally strike the coast, such as Hurricane Frederic in September 1979 and Hurricane Ivan in September 2004; both storms resulted in significant to devastating damage in the Mobile area.

<span class="mw-page-title-main">Climate of Allentown, Pennsylvania</span> Overview of the climate of Allentown, Pennsylvania, United States

The climate of Allentown, Pennsylvania is classified as a humid continental climate. Allentown's warmest month is July with a daily average temperature of 74.7 °F (23.7 °C) and the coldest month being January with a daily average of 29.4 °F (−1.4 °C). The average precipitation of Allentown is 45.35 inches (1,152 mm) per year.

<span class="mw-page-title-main">Geography of southern California</span> Overview of the geography of southern California

The geography of southern California refers to the geography of southern California in the United States.

<span class="mw-page-title-main">2014–15 North American winter</span> Winter season in North America

The 2014–15 North American winter was frigid and prolifically wintry, especially across the eastern half of North America in the months of January–March. The season began early, with many places in North America experiencing their first wintry weather during mid-November. A period of below-average temperatures affected much of the contiguous United States, and several records were broken. An early trace of snowfall was recorded in Arkansas. There were greater accumulations of snow across parts of Oklahoma as well. A quasi-permanent phenomenon referred to as the polar vortex may have been partly responsible for the cold weather. Temperatures in much of the United States dropped 15 to 35 °F below average by November 19, following a southward "dip" of the polar vortex into the eastern two-thirds of the country. The effects of this dip were widespread, bringing about temperatures as low as 28 °F (−2 °C) in Pensacola, Florida. Following a significant snowstorm there, Buffalo, New York received several feet of snow from November 17–21. In addition, significant winter weather occurred throughout the season, including a major blizzard that struck the Northeastern United States at the end of January, another blizzard that affected much of the Northern United States days later in early February, and several significant snow events paired with very frigid temperatures for much of February.

References

  1. "National Oceanic and Atmospheric Agency: San Diego climate by month". Wrh.noaa.gov. Retrieved May 4, 2011.
  2. M. Kottek; J. Grieser; C. Beck; B. Rudolf; F. Rubel (2006). "World Map of the Köppen-Geiger climate classification updated". Meteorol. Z. 15 (3): 259–263. Bibcode:2006MetZe..15..259K. doi:10.1127/0941-2948/2006/0130 . Retrieved April 22, 2009.
  3. "San Diego CA Average Temperatures by Month - Current Results". www.currentresults.com. Retrieved July 9, 2018.
  4. 1 2 "Intellicast - San Diego Historic Weather Averages in California (92147)". www.intellicast.com. Retrieved July 9, 2018.
  5. National-Record High Temp: http://www.vroomvroomvroom.com/maximum-temperatures-in-usa/
  6. Union-Tribune, San Diego. "Less May gray and June gloom, but more rain?". sandiegouniontribune.com. Retrieved July 9, 2018.
  7. "Marine Layer Information". meteora.ucsd.edu. Retrieved July 9, 2018.
  8. http://www.wrcc.dri.edu/cgi-bin/cliMAIN.pl?ca7740; http://www.city-data.com/forum/weather/155963-your-record-high-record-low-10.html
  9. Enloe, Jesse (December 2, 2012). "CA All-Time Highest Max Temperature Records set on September 27, 2010". NOAA . Retrieved December 2, 2012.
  10. 1 2 "SAN DIEGO LINDBERGH FLD, CALIFORNIA - Climate Summary".
  11. "Rowe, P.: "The Day it Snowed on San Diego" San Diego Union-Tribune, December 13, 2007.
  12. ""Snow play" a popular winter activity at Laguna Mountain Recreation Area, Palomar Mountain and Cuyamaca Rancho State Park (Feb 26 2011)". Archived from the original on May 11, 2011. Retrieved February 27, 2011.
  13. Conner, Glen. History of weather observations San Diego, California 1849–1948. Climate Database Modernization Program, NOAA's National Climatic Data Center. pp. 7–8.
  14. "NowData – NOAA Online Weather Data". National Oceanic and Atmospheric Administration . Retrieved June 14, 2021.
  15. "Summary of Monthly Normals 1991–2020". National Oceanic and Atmospheric Administration. Archived from the original on August 8, 2023. Retrieved June 14, 2021.
  16. "San Diego/Lindbergh Field CA Climate Normals 1961–1990". National Oceanic and Atmospheric Administration. Archived from the original on August 8, 2023. Retrieved July 18, 2020.
  17. 1 2 "Pacific Ocean Temperatures on California Coast" - beachcalifornia.com
  18. 1 2 Lee, Mike (June 18, 2011). "Is global warming changing California Current?". U-T (San Diego Union Tribune). Retrieved June 20, 2011.
  19. Fovell, Robert, Professor of Atmospheric and Oceanic Sciences, UCLA, "The Santa Ana Winds FAQ http://people.atmos.ucla.edu/fovell/ASother/mm5/SantaAna/santa_ana_faq.html 2016-03-29
  20. Average UV index San Diego, USA – weather-atlas.com